
IN their paper, "Are The Beatles Different? A Computerized Psychological Analysis of Their Music," North and Krause (2023) investigate the "innovativeness" of The Beatles' oeuvre through an empirical analysis of a large data set drawn from the Spotify API (Negi et al., 2021). North and Krause take an exploratory approach, relying on Spotify's precomputed (and somewhat "obtuse") acousticness, danceability, energy, valence, tempo, duration, and loudness features. Simply put, they compared The Beatles' average rating on each feature to (1) the entire data set and (2) tracks released by comparable artists in the same decade. They found that The Beatles' music was (statistically) significantly more danceable, energetic, faster, louder, shorter, and less acoustic than that of their contemporaries.
As a reviewer of this paper, I appreciated the straightforwardness and clarity of this analytical approach. However, at the same time a (potential) validity issue occurred to me, and I suggested that the authors explore a few alternative analyses (or suite of analyses) to explore this (possible) problem. Ultimately, my suggested analyses went beyond the scope of "revise and submit." The editor therefore asked me to present my alternate analyses in a separate commentary. I will do so here.
North and Krause's statistical approach assumes that each track's features are statistically independent. However, there are several common sources of data dependence in the data: for example, two tracks from the same year are more likely to be similar than two tracks from different years, making them not fully independent samples. Genre and, of course, artist are also likely sources of data dependence. The sample includes various subgenres of rock, pop, hip hop, country, jazz, and classical music, as well as (some) non-musical tracks (comedy skits, books-on-tape, etc.). Bizarrely, the second and seventh most common "artists" in the dataset, accounting for 1,996 tracks between them, are Russian-language audio-book chapters from writings by Ernest Hemingway and Erich Maria Remarque. If we compare the "danceability" of the Beatles to the danceability of the rest of the corpus, this includes the danceability of All Quiet on the Western Front (read in Russian) and Beethoven's 5th Symphony. (Fortunately, "non-musical" tracks appear to represent a small part of the dataset and so are only adding a bit of noise to the data.)
My main concern is that, given the heterogeneity of the dataset, any individual artist in the data set might be (statistically) different from the global average. By analogy, consider that nearly any random sample of men will be statistically taller (on average) than the average human (man or woman)—simply because men are taller on average than women. Similarly, if, for example, rock music in general is higher in energy and more danceable than other types of music, then The Beatles' higher energy and danceability may simply be attributed to their genre. To be fair, North and Krause account for the temporal/historical trends in their second analysis, by restricting their comparison to music released at the same time as The Beatles'. This approach should account for dependence on time, but not on genre.
To investigate my methodological concerns, I explored two approaches. First, I reproduce North and Krause's analyses on a set of "peer" artists, to see how many of them get the same result. Second, I pursue alternative approaches to incorporating data dependence into a statistical model.
ANALYZING THE BEATLES' PEERS
My first approach is to apply North and Krause's analysis techniques to some of The Beatles' commercial and critical "peers." Perhaps the most commonly cited "peers" of The Beatles are fellow "British Invasion" bands like The Rolling Stones, the Who, and the Kinks—all bands which were commercially successful at roughly the same time as The Beatles, in (roughly) the same genre, and which are generally recognized by critics for their importance and influence on the genre (Kallen, 2012). I also thought it would be useful to compare The Beatles and these "peers" with other contemporary artists that were successful at the time, but which are not usually feted as much in later discourse: four bands in the data set that fit this bill are The Dave Clark Five, Paul Revere & The Raiders, The Monkees, and The Association. Finally, for some additional context, I include some other notable artists who were not contemporaries or "obvious" peers of The Beatles, but who are often critically lauded: Frank Sinatra, Elvis Presley, Michael Jackson, Queen, Led Zeppelin, Pink Floyd, and Nirvana. Of course, there are many other artists in the data set which could be compared, and these choices are somewhat arbitrary. However, the goal is simply to see what happens when we apply North and Krause's methodology to these other artists; later I will expand my analysis to all artists in the dataset.
I should acknowledge that my selection of "peers" is badly biased towards older music (pre-1990) and towards men (particularly white men). The fact that these artists came to my mind as The Beatles' peers reflects my own biases, certainly, but also the broader biased reality of critical and market celebrations of "great artists"—most discussions and celebrations of "great" bands, like The Beatles, tend to be dominated by other white male artists. Of course, there are many "great" non-white and/or female artists that are The Beatles' peers, but my goal here was to simply choose a quick and dirty list for comparison, not to really explore a proper representative sample of music (Shea, 2022).
I conduct all my statistical tests using the R programming language; fortunately, the MANOVA and 𝜒2 tests I conduct on The Beatles return the exact same numbers reported by North and Krause, which shows that my analyses are consistent with their SPSS-based analyses. Since I will be conducting many tests, I adopt an α level of α=.01 throughout the paper. This is far from a complete correction for running so many tests, but at least sets a higher bar of significance for this exploratory investigation.
Note that the Negi et al. (2021) data includes multiple artist tags for 33,903 (about one in five) tracks. These include hip hop tracks featuring multiple rappers, bands featuring guest musicians, and tracks attributed to a composer paired with an orchestra (e.g., Orchestre Symphonique de Paris playing music by Claude Debussy), among other possibilities. In the following analyses, I needed to identify a single artist for each track (fortunately, only 3.3% of rock music in the dataset is attributed to multiple artists). My approach was to take, for each multi-artist attribution, the single artist that appears the most in the dataset.
Comparison of artists with the entire dataset
Like North and Krause, I begin with comparisons of each peer artist to the whole dataset. Replicating North and Krause's MANOVA analyses, these tests are significant for every peer artist except The Association (Table 1). These global tests do not give us much to interpret, so I next explore the "innovativeness" of each peer artist for each feature. To replicate North and Krause's Table 1 for each artist would be unnecessarily detailed, so I will tabulate only the 𝜂2 value for each artist on each feature (Table 2), with significant (α=.01) results underlined. To interpret the direction and magnitude of these effects, we can visualize the means of each feature for each artist as well (Figure 1).
| Artist | F(7, 169901) | p |
|---|---|---|
| The Beatles | 42.15 | < .01 |
| The Rolling Stones | 72.91 | < .01 |
| The Kinks | 31.91 | < .01 |
| The Who | 48.51 | < .01 |
| The Dave Clark Five | 7.70 | < .01 |
| Paul Revere & The Raiders | 3.71 | < .01 |
| The Association | 2.31 | .024 |
| The Monkees | 15.20 | < .01 |
| Frank Sinatra | 190.98 | < .01 |
| Elvis Presley | 82.66 | < .01 |
| Stevie Wonder | 21.33 | < .01 |
| Michael Jackson | 43.44 | < .01 |
| Queen | 48.77 | < .01 |
| Led Zeppelin | 99.39 | < .01 |
| Pink Floyd | 66.17 | < .01 |
| Nirvana | 54.78 | < .01 |
| Artist | Acousticness | Danceability | Energy | Valence | Tempo | Duration | Loudness |
|---|---|---|---|---|---|---|---|
| The Beatles | .0003* | .0000_ | .0001* | .0003* | .0000* | .0005* | .0002* |
| The Rolling Stones | .0009* | .0000_ | .0023* | .0007* | .0002* | .0000_ | .0012* |
| The Kinks | .0004* | .0000_ | .0009* | .0004* | .0000_ | .0002* | .0004* |
| The Who | .0008* | .0002* | .0012* | .0000_ | .0002* | .0000_ | .0003* |
| The Dave Clark Five | .0001* | .0000_ | .0001* | .0001* | .0000_ | .0001* | .0000_ |
| Paul Revere & The Raiders | .0000* | .0000_ | .0001* | .0001* | .0000_ | .0000_ | .0000_ |
| The Association | .0000_ | .0000_ | .0000_ | .0000_ | .0000_ | .0000_ | .0000_ |
| The Monkees | .0000* | .0000_ | .0002* | .0002* | .0000_ | .0002* | .0001* |
| Frank Sinatra | .0018* | .0031* | .0038* | .0017* | .0002* | .0005* | .0011* |
| Elvis Presley | .0013* | .0002* | .0002* | .0003* | .0001* | .0011* | .0002* |
| Stevie Wonder | .0003* | .0000_ | .0000_ | .0002* | .0000_ | .0000_ | .0000_ |
| Michael Jackson | .0005* | .0011* | .0007* | .0001* | .0000_ | .0001* | .0006* |
| Queen | .0008* | .0005* | .0005* | .0004* | .0000_ | .0000_ | .0002* |
| Led Zeppelin | .0010* | .0009* | .0011* | .0000_ | .0000_ | .0012* | .0001* |
| Pink Floyd | .0001* | .0010* | .0001* | .0013* | .0000_ | .0006* | .0006* |
| Nirvana | .0010* | .0003* | .0010* | .0001* | .0003* | .0000_ | .0003* |
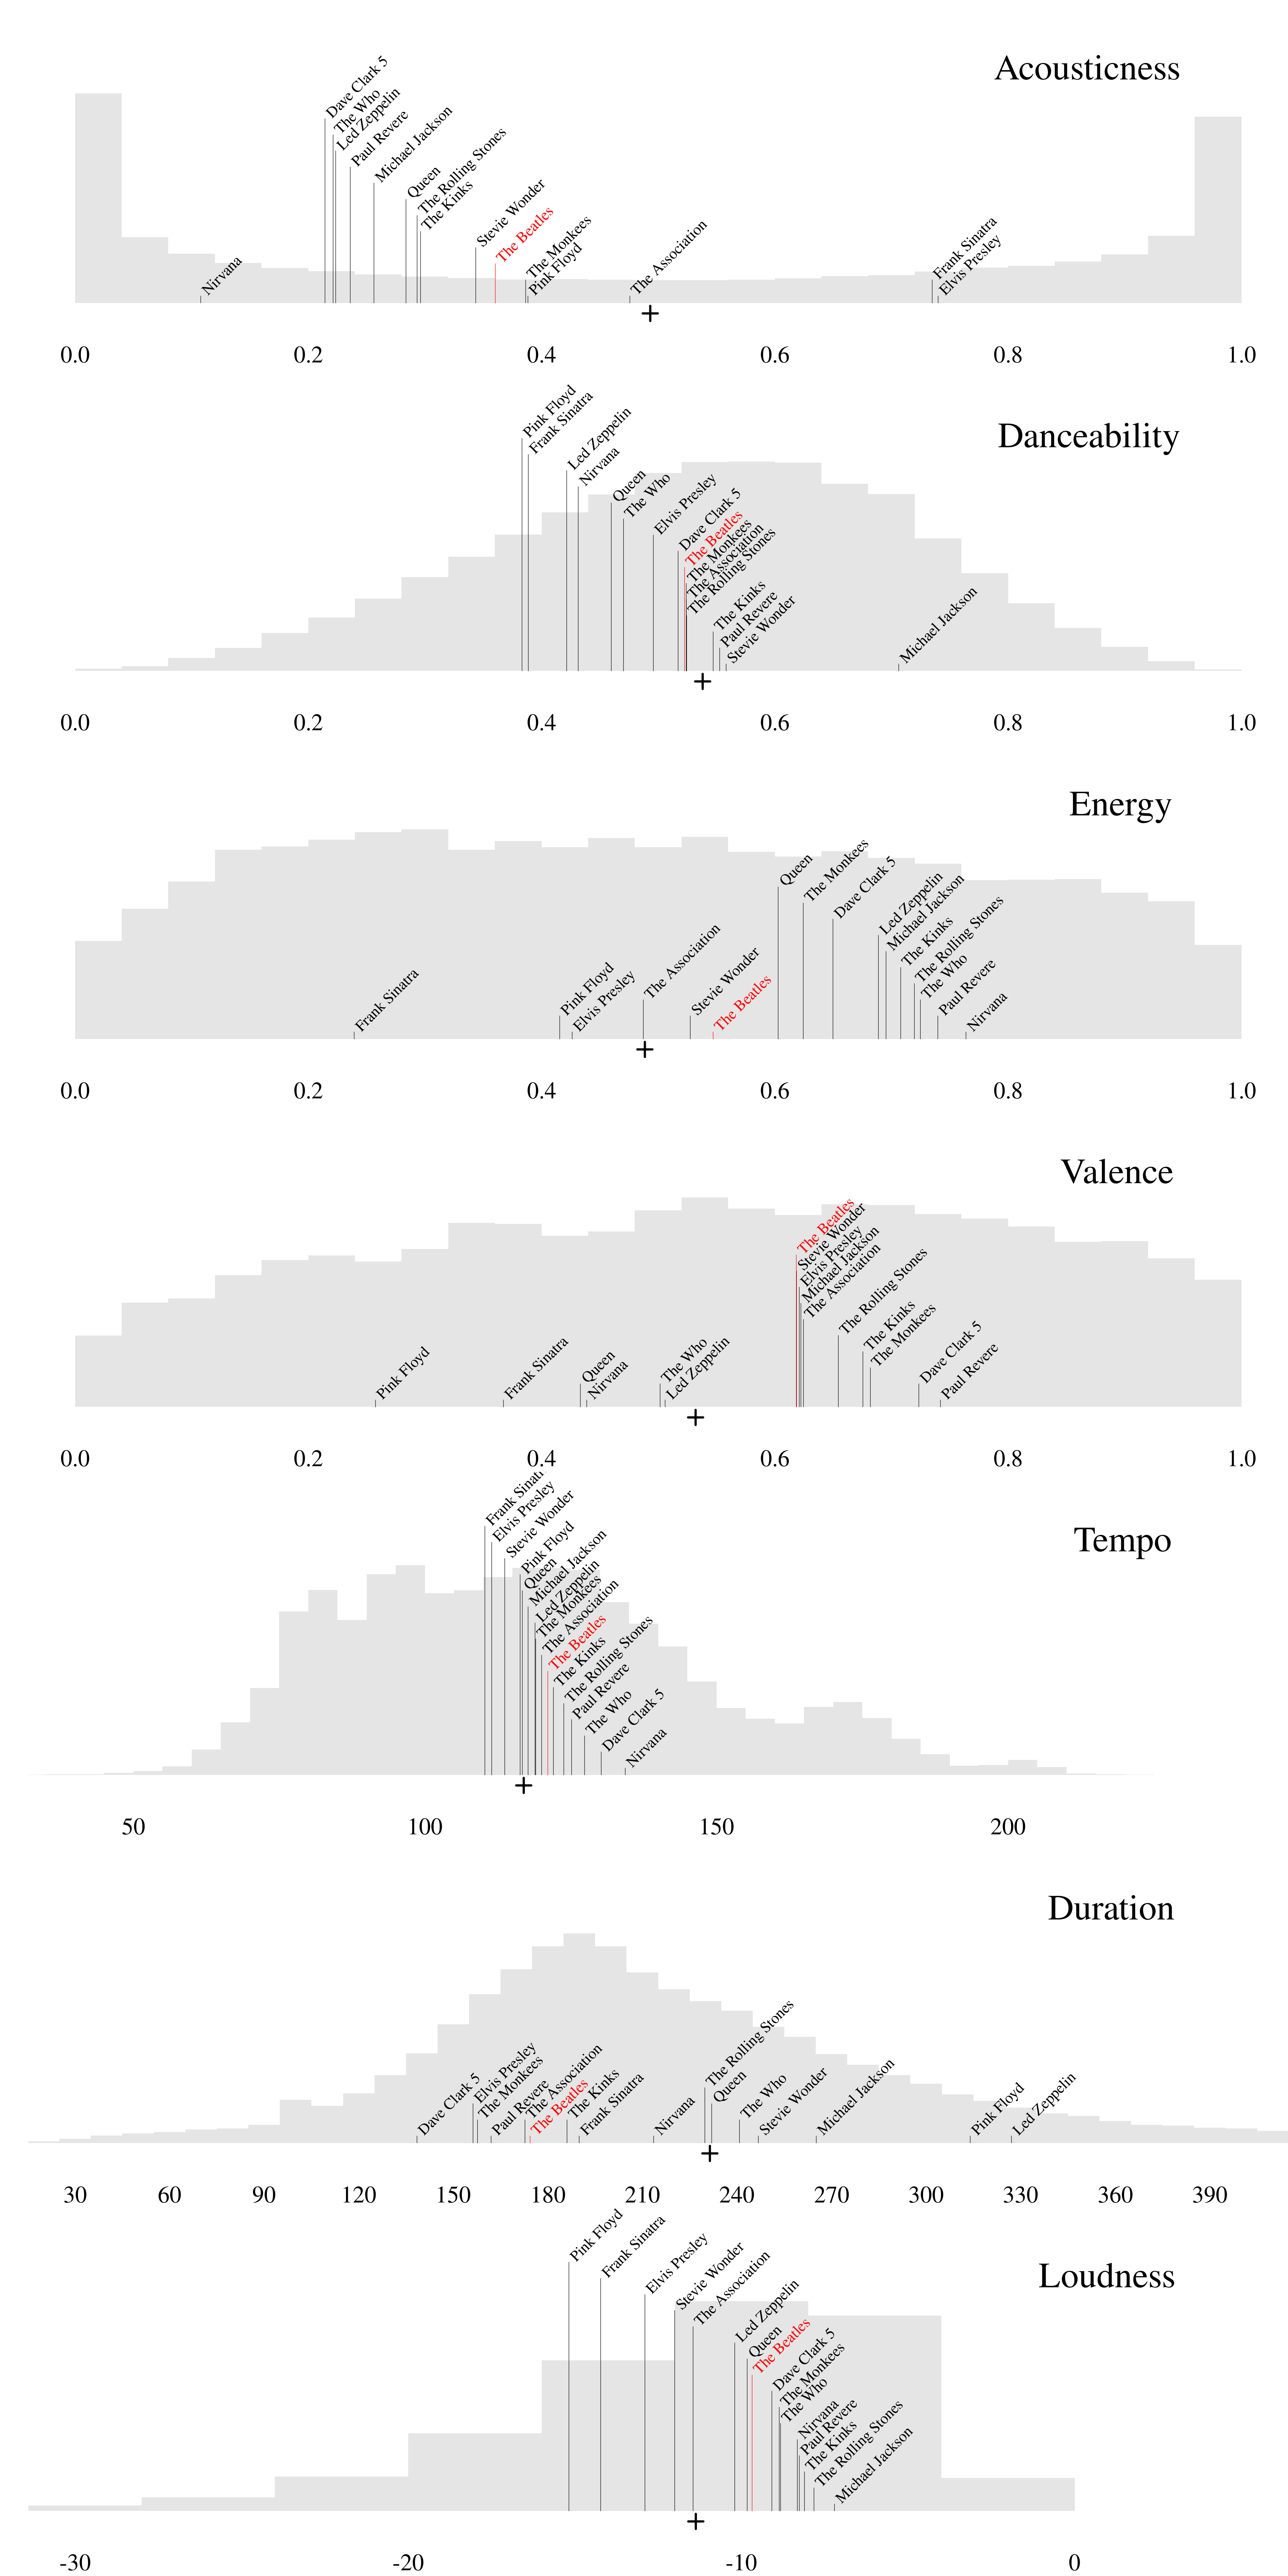
Figure 1. Distribution of each feature in dataset (grey histogram) with the global corpus mean indicated by a cross below the histogram and the mean of each "peer" artist indicated with a black line (except The Beatles highlighted in red).
My principle a priori concern—namely that any artist will be significantly different from the corpus as a whole—appears to be somewhat justified: many artists are just as "statistically innovative" as The Beatles, by this measure. However, these peers are all exceptional artists, so perhaps finding that most are "significantly innovative" is to be expected. What is more, not all my results are significant and the 𝜂2 vary a fair amount, so this analytical approach appears to have some discriminative power. Indeed, the four least feted artists on my list (The Dave Clark Five, Paul Revere & the Raiders, the Monkees, and the Association) are the four least innovative by the 𝜂2 metric (Table 2). However, it also quite clear that The Beatles themselves are not outliers in any of these seven features. In fact, The Beatles' mean feature values (which are consistent with North and Krause's report) are actually clearly "middle of the pack" amongst the peers that I have selected.
Other artists
We might now wonder whether only exceptional bands, like Led Zeppelin or Nirvana, score higher 𝜂2 values like .0012 or .0010. To answer this, we must apply the same analyses to more artists in the data set. The whole dataset includes 18,541 artists. However, the vast majority of these artists only appear a few times in the data (e.g., 82% of artists appear fewer than 10 times). In contrast, 640 artists appear fifty or more times in the data. I next applied the same MANOVA analysis to all of these artists. Using the same α=.01, 635 of these artists are significantly different from the corpus as a whole (including the significant peers already discussed above). Even if we change to α=.0001, 626 artists count as "significantly innovative." (Note that The Association only has 33 tracks in the dataset, which may explain their lack of significance. Figure 1, for example, shows that The Association's and The Beatles' average valence values are nearly identical.)
These results underscore that the biggest problem with this approach is leaning on the idea of "statistical significance." North and Krause quite rightly note that the effect sizes they find are very small. However, because the dataset is large, even these tiny effects reach "statistical significance." We might also note that all these analyses are extremely unbalanced. For example, in The Beatles (M)ANOVAs we are comparing their 413 tracks against 169,496 non-Beatles tracks. Using the effect size 𝜂2 is probably a better approach than using "significance," but it is still affected by the great imbalances in the tests. I found that 50 of these artists have an 𝜂2 that is equal or greater than that of Led Zeppelin, and 166 have a greater value than The Beatles' 𝜂2=.0017. Musical artists with MANOVA 𝜂2 values higher than 95% of other artists include Ludwig van Beethoven (𝜂2=.033), Claude Debussy (𝜂2=.012), Billie Holiday (𝜂2=.0092), and Metallica and Frank Sinatra tied with 𝜂2=.0078. However, these 𝜂2 values are strongly correlated with sample size (r=.825): Beethoven has 976 tracks in the data, Metallica only 238.
Comparison of artists with contemporaries
The previous analyses underscore that it is problematic to simply compare a particular artist with the corpus as a whole. Due to the great variety in the data, any artist will be different from the corpus-wide average. I do not think this can reasonably be interpreted as a measure of "innovativeness." North and Krause address this problem, to some extent, in their second analysis where they reduce the comparison to the historical period when The Beatles were actively making music (1962–1970). In contrast, in the first analysis, The Beatles were compared to artists from the 1940s, 1990s, and 2010s. Figure 2 shows the simple regression slope for each of the seven features across the century this dataset covers. All the features except for valence, show a significant (p<.01) trend over the course of the century. This demonstrates the importance of reducing the scope of comparison to contemporaneous peers. However, even within a constrained period, other sources of dependent variation (notably genre) are evident in the data, and it is not clear to me that this is sufficient to overcome the problem that I have laid out above.
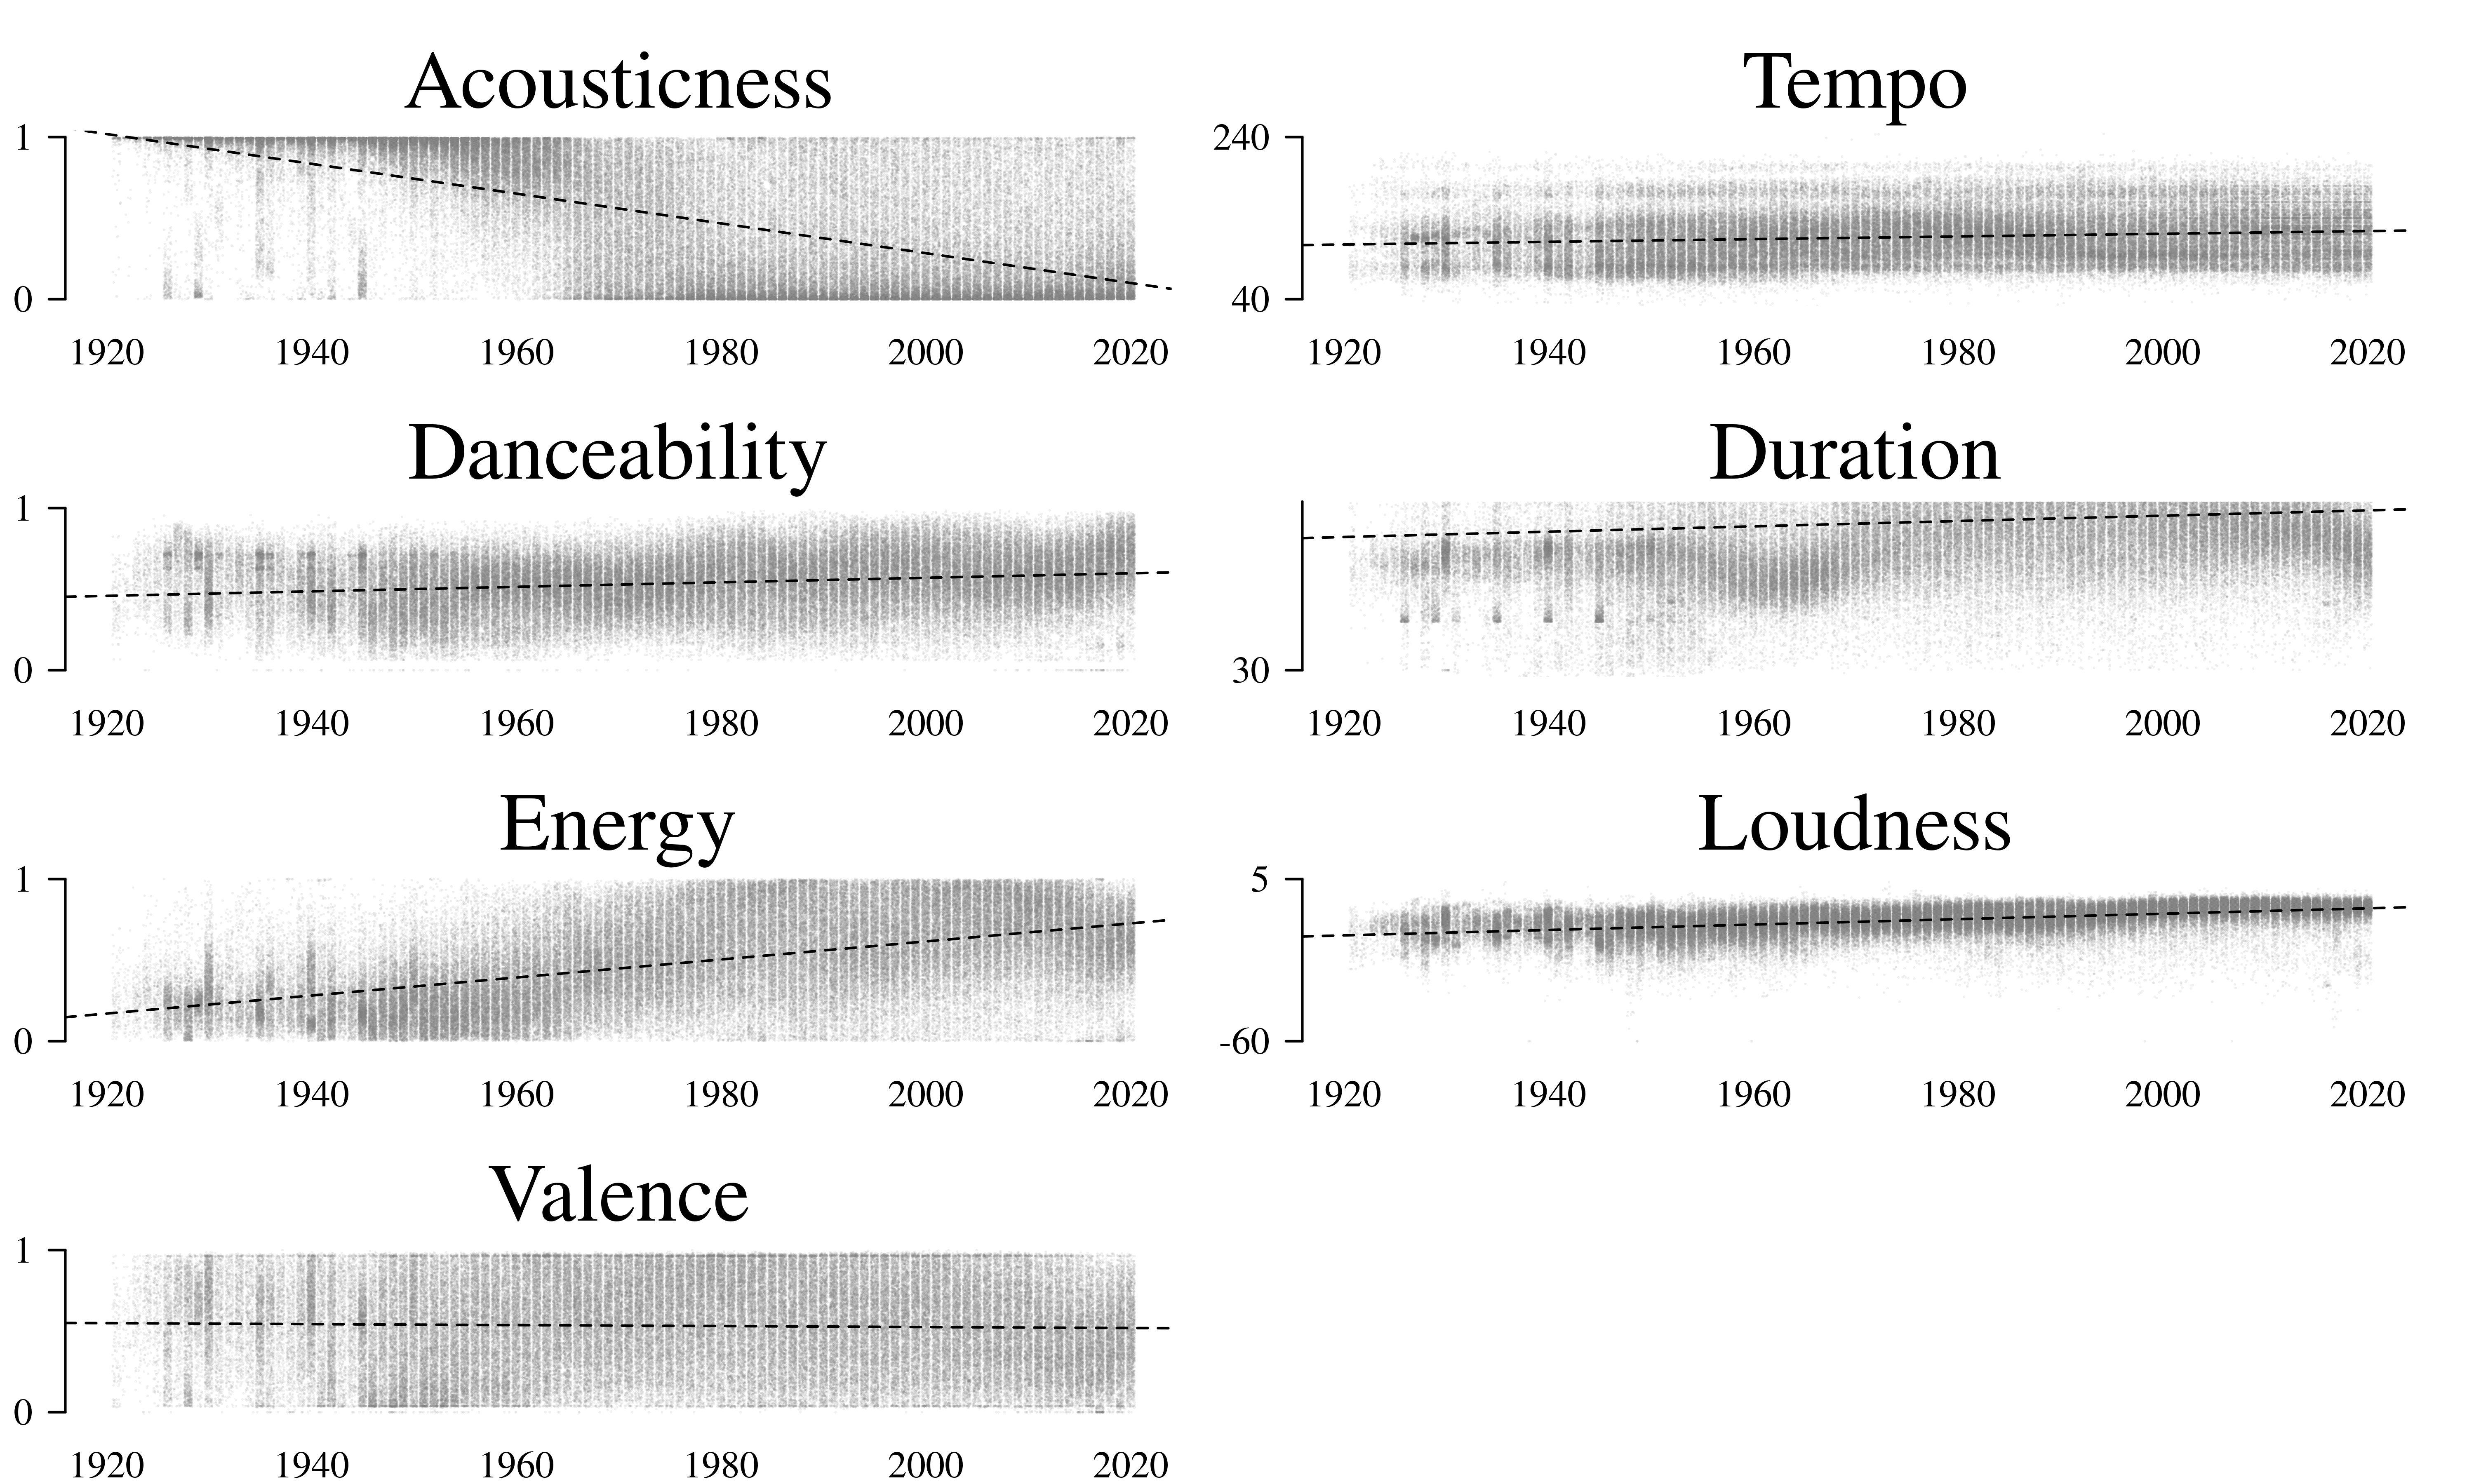
Figure 2. Simple linear regression predicting each feature from year.
To replicate North and Krause's second analysis for other artists, we need to establish comparable "active eras" for each artist. Unfortunately, establishing the appropriate period of comparison for each "peer" artist is not always as easy as for The Beatles. Peer artists like The Rolling Stones, for example, have actively released records for a much longer period of time than The Beatles. Therefore, for each artist, I selected the 3–12-year period that best matches with that artist's most successful active period. This assessment was based on my own personal knowledge of each artist's history and guided by their representation in the data: The Beatles' four "less feted" peers of the 1960s only had songs in the sample from a short period. I ended Led Zeppelin's and Nirvana's target periods when deaths led their bands to break up. For other artists, the active period was less clear-cut, and I elected to sample from their first appearance in the data through to the first place where the number of songs in the sample dropped significantly. I then reproduced the MANOVA analyses from above, constraining the data to the relevant period (Table 3).
| Artist | F | Degrees of freedom | p |
|---|---|---|---|
| The Beatles (1962-1970) | 29.40 | 7, 17992 | < .01 |
| The Rolling Stones (1964-1973) | 68.72 | 7, 19992 | < .01 |
| The Kinks (1964-1972) | 41.47 | 7, 17992 | < .01 |
| The Who (1965-1973) | 80.80 | 7, 17992 | < .01 |
| The Dave Clark Five (1964-1967) | 6.83 | 7, 7992 | < .01 |
| Paul Revere & The Raiders (1965-1971) | 3.79 | 7, 13992 | < .01 |
| The Association (1966-1969) | 0.62 | 7, 7992 | .75 |
| The Monkees (1966-1968) | 10.65 | 7, 5992 | < .01 |
| Frank Sinatra (1954-1962) | 88.88 | 7, 17992 | < .01 |
| Elvis Presley (1956-1965) | 33.53 | 7, 19992 | < .01 |
| Stevie Wonder (1972-1982) | 8.35 | 7, 21992 | < .01 |
| Michael Jackson (1979-1988) | 30.11 | 7, 19992 | < .01 |
| Queen (1973-1980) | 40.16 | 7, 15992 | < .01 |
| Led Zeppelin (1969-1979) | 54.44 | 7, 21992 | < .01 |
| Pink Floyd (1969-1980) | 43.77 | 7, 23992 | < .01 |
| Nirvana (1989-1994) | 33.26 | 7, 11992 | < .01 |
As North and Krause found for The Beatles, the analysis restricted to contemporary artists results in broadly similar results. Once, again, it appears that many (perhaps most) artists will be "significantly" different from the still large and diverse sample of tracks released contemporaneously.
GENRE
Even if we restrict our analysis to contemporary artists, variation between styles and genre is still present in the data. To further elucidate what is going on, I wanted to look at the influence of genre. Unfortunately, Negi et al.'s (2021) data does not include genre labels, so I had to retrieve them independently. Since the analysis here has focused on artists, I elected to determine genre by artist, not directly for every track—this limited the scope of my task from 169,909 tracks to "only" 27,622 unique artists. For each unique artist, I queried the Discogs API (https://www.discogs.com/developers/) for records they released, and took the genre label that appeared most frequently on their releases. Unfortunately, 7% of the artists did not have a match in Discogs. For the remaining 93% of the data, tracks were associated with fifteen unique genres. These genre labels are far from perfect, but they seem to be mostly correct—for example, the most common artists in each genre (Table 4) seem to be mostly reasonable. Unsurprisingly, the distribution of genres in the corpus is unbalanced, and has shifted quite a bit over time, as can be seen in Figure 3.
| Genre | Artists |
|---|---|
| Blues | Lead Belly; B.B. King; Stevie Ray Vaughan; Muddy Waters; John Lee Hooker; Robert Johnson; Sister Rosetta Tharpe; Howlin' Wolf; Leroy Carr; Albert King; Otis Rush; Taj Mahal; Brownie McGhee; Freddie King; Champion Jack Dupree; Bessie Smith; Lightnin' Hopkins; Bobby "Blue" Bland; The Blues Brothers; The Paul Butterfield Blues Band |
| Brass/ Military | Carl Woitschach; Marine Band Of The Royal Netherlands Navy; Banda Republicana; Sgt. Barry Sadler; Erich-Weinert-Ensemble; Hafız Yaşar; Heeresmusikkorps 9; John Philip Sousa; The Great American Main Street Band; The United States Military Academy Band; Zabawa |
| Children's | Raffi; Alvin & The Chipmunks; Frances Archer; Marni Nixon; Disney Studio Chorus; Barney; Cedarmont Kids; The Countdown Kids; Scripture Lullabies; Fredrik Vahle; Rockabye Baby!; The Wiggles; Elizabeth Mitchell; The Laurie Berkner Band; Ernie; Jodi Benson; Mickey Mouse; Rudyard Kipling; VeggieTales; Charity Bailey |
| Classical | Frédéric Chopin; Ludwig van Beethoven; Wolfgang Amadeus Mozart; Johann Sebastian Bach; Igor Stravinsky; Giuseppe Verdi; Vladimir Horowitz; New York Philharmonic; Giacomo Puccini; Arturo Toscanini; Claude Debussy; Jascha Heifetz; London Symphony Orchestra; Sinclair Lewis; Richard Wagner; Wiener Philharmoniker; William Kapell; Erik Satie; Isaac Stern; Eugene Ormandy |
| Electronic | Unspecified; Depeche Mode; Brian Eno; Madonna; Daft Punk; Enya; Donna Summer; New Order; Nine Inch Nails; Gorillaz; Janet Jackson; Tears For Fears; Kygo; Kraftwerk; P!nk; Diddy; Björk; Orchestral Manoeuvres In The Dark; Aphex Twin; Cyndi Lauper |
| Folk/ World/ Country | Johnny Cash; Lata Mangeshkar; Willie Nelson; Mohammed Rafi; Shamshad Begum; George Strait; Waylon Jennings; Geeta Dutt; John Prine; Marty Robbins; Dolly Parton; Asha Bhosle; George Jones; Hank Williams, Jr.; John Denver; Amirbai Karnataki; Kenny Chesney; Alan Jackson; Lefty Frizzell; Alabama |
| Funk/Soul | Marvin Gaye; Stevie Wonder; Aretha Franklin; Sam Cooke; Otis Redding; Prince; The Isley Brothers; The Weeknd; James Brown; The Temptations; Beyoncé; Earth, Wind & Fire; Ray Charles; Bill Withers; Curtis Mayfield; Sly & The Family Stone; Al Green; Sade; The Platters; Mahalia Jackson |
| Hip Hop | Drake; Eminem; JAY-Z; Lil Wayne; 2Pac; Kanye West; Mac Miller; The Notorious B.I.G.; Chris Brown; Lil Uzi Vert; Beastie Boys; Future; Kendrick Lamar; Travis Scott; Nicki Minaj; OutKast; Ice Cube; J. Cole; Snoop Dogg; Lil Baby |
| Jazz | Frank Sinatra; Billie Holiday; Ella Fitzgerald; Miles Davis; Duke Ellington; Nina Simone; Thelonious Monk; Louis Armstrong; John Coltrane; Oscar Peterson; Count Basie; Sarah Vaughan; Stan Getz; Nat King Cole; Charles Mingus; Peggy Lee; Bill Evans Trio; Chet Baker; Bill Evans; Sonny Rollins |
| Latin | Francisco Canaro; Ignacio Corsini; Vicente Fernández; Javier Solís; Los Tigres Del Norte; Carmen Miranda; Juan Gabriel; La Sonora Matancera; Antonio Aguilar; Los Bukis; Luis Miguel; Joan Sebastian; José Alfredo Jimenez; Los Temerarios; Bad Bunny; Grupo Laberinto; Chalino Sanchez; Daddy Yankee; La Sonora Santanera; Los Panchos |
| Non-Music | Dale Carnegie; Ernst H. Gombrich; Federico García Lorca; Bill Cosby; Robin Williams; Honoré de Balzac; Marcel Pagnol; Jean Amrouche; Nature Sounds; Jack Kerouac; Robert Frost; Harold Courlander; Frank Wedekind; Kino; Richard Pryor; Alfred Hitchcock; Jean Servais; Jean Giono; Mary Norton; Bill Burr |
| Pop | Dean Martin; Doris Day; Taylor Swift; Michael Jackson; Bee Gees; Neil Diamond; Jackie Gleason; BTS; Bing Crosby; ABBA; Percy Faith & His Orchestra; Barbra Streisand; Mariah Carey; Harry Belafonte; Lana Del Rey; Lady Gaga; One Direction; Rihanna; Les Paul; Justin Bieber |
| Reggae | Bob Marley & The Wailers; Charlie Chaplin; Peter Tosh; UB40; Slightly Stoopid; Toots & The Maytals; Steel Pulse; Jimmy Cliff; Rebelution; The Wailers; Desmond Dekker; Stick Figure; Dirty Heads; Gregory Isaacs; Sean Paul; Black Uhuru; Burning Spear; Shaggy; Yellowman; Buju Banton |
| Rock | Bob Dylan; The Rolling Stones; The Beach Boys; Elvis Presley; Queen; The Beatles; Fleetwood Mac; Led Zeppelin; Elton John; The Who; Grateful Dead; Metallica; U2; The Kinks; Red Hot Chili Peppers; David Bowie; Van Morrison; Pink Floyd; Eric Clapton; Billy Joel |
| Stage/ Screen | Judy Garland; MGM Studio Orchestra; John Williams; Leonard Bernstein; Henry Mancini; Richard Rodgers; Andrew Lloyd Webber; Ennio Morricone; Joe Hisaishi; Alfred Newman; Bernard Herrmann; Hans Zimmer; Stephen Sondheim; Alan Menken; Howard Shore; Nelson Riddle; John Barry; Lin-Manuel Miranda; Cole Porter; Charles Strouse |
| Unknown | Ernest Hemingway; Erich Maria Remarque; Orchestra Studio 7; Giorgos Papasideris; Roza Eskenazi; Rita Ampatzi; Markos Vamvakaris; Zofia Dromlewiczowa; Sonny Boy Williamson I; Stellakis Perpiniadis; Umm Kulthum; Seweryn Goszczyński; Panic! At The Disco; K.C.Dey; Kostas Roukounas; Dimitris Arapakis; Suicide Boy; Stratos Pagioumtzis; Ramon Ayala Y Sus Bravos Del Norte; M. S. Subbulakshmi |
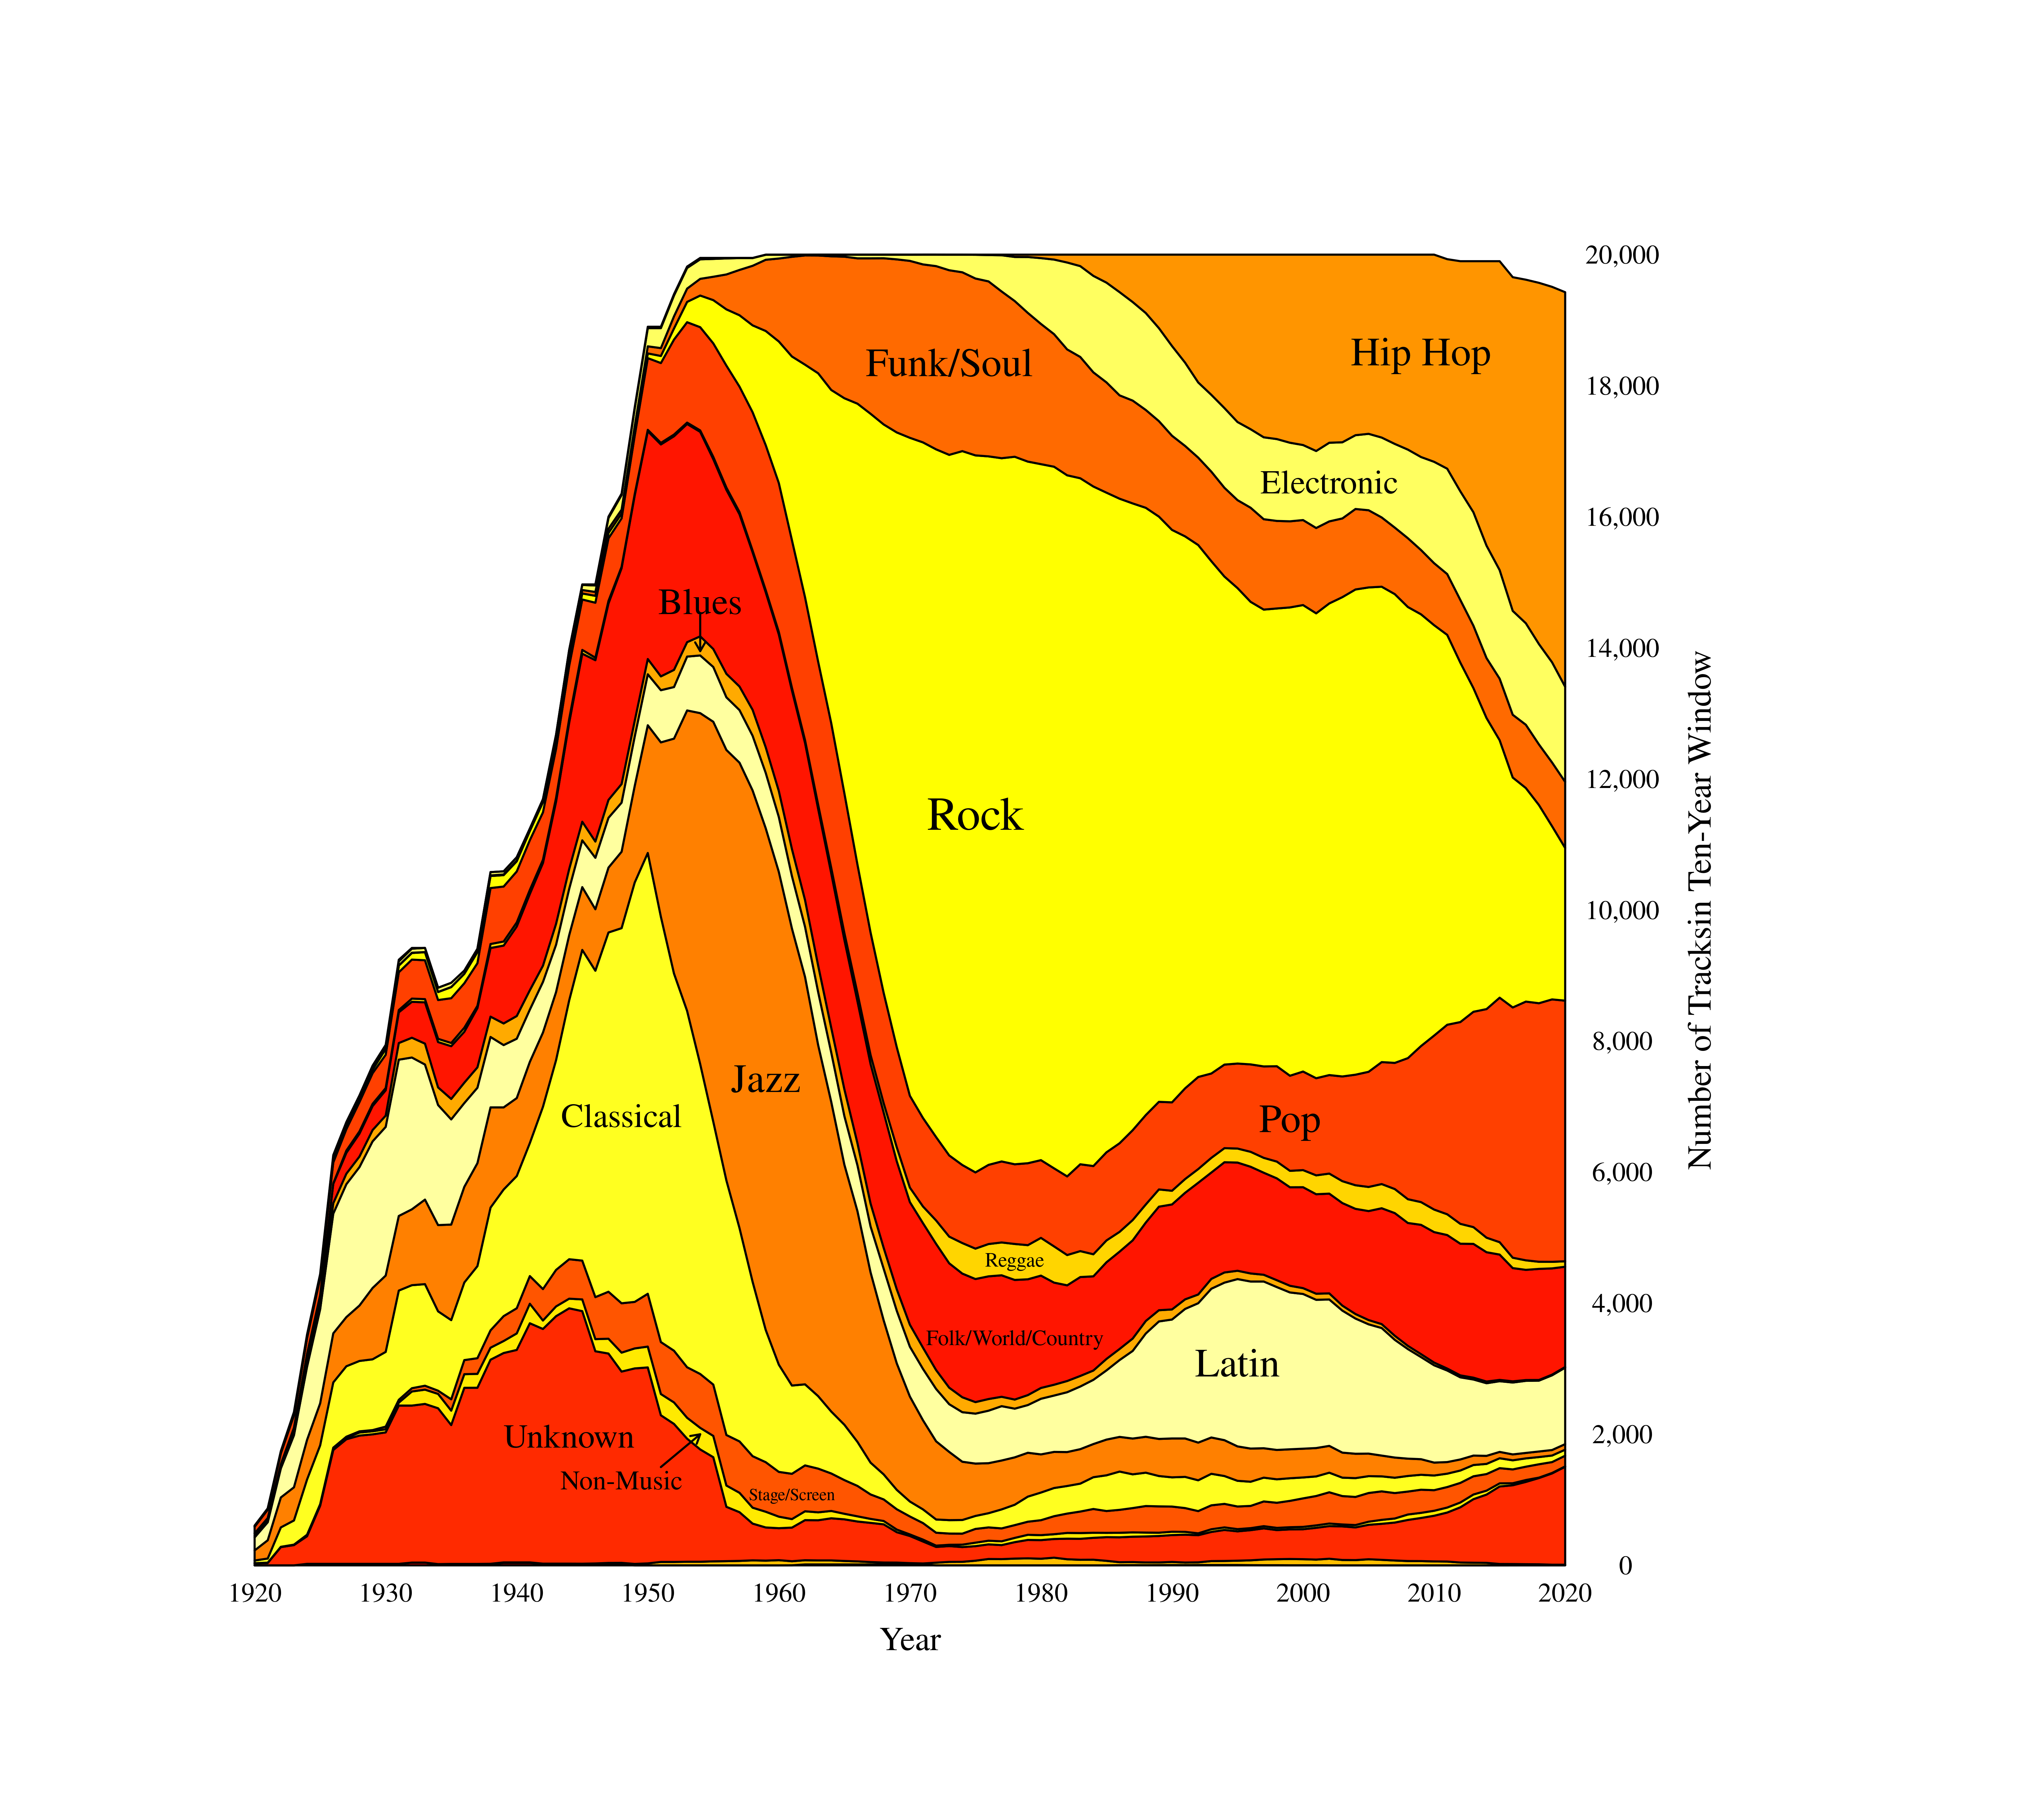
Figure 3. Proportion of tracks from each genre over time, counted over ten-year rolling windows. The genres Children's and Brass/Military occupy the small sliver at the bottom.
Genre analysis
Figure 4 shows the mean and interquartile ranges for each feature across the fifteen genres identified in Table 4. Notably, there is significant (see Table 5) variation in acousticness, danceability, energy, valence, and duration between the Discogs-derived genre labels. Indeed, variation between genres accounts for quite a lot (𝜂2≥.16) of variance in all features except tempo and duration. If we add genre, along with active period, as comparison criteria, we find that our peer artists are still "significantly" innovative (Table 6).
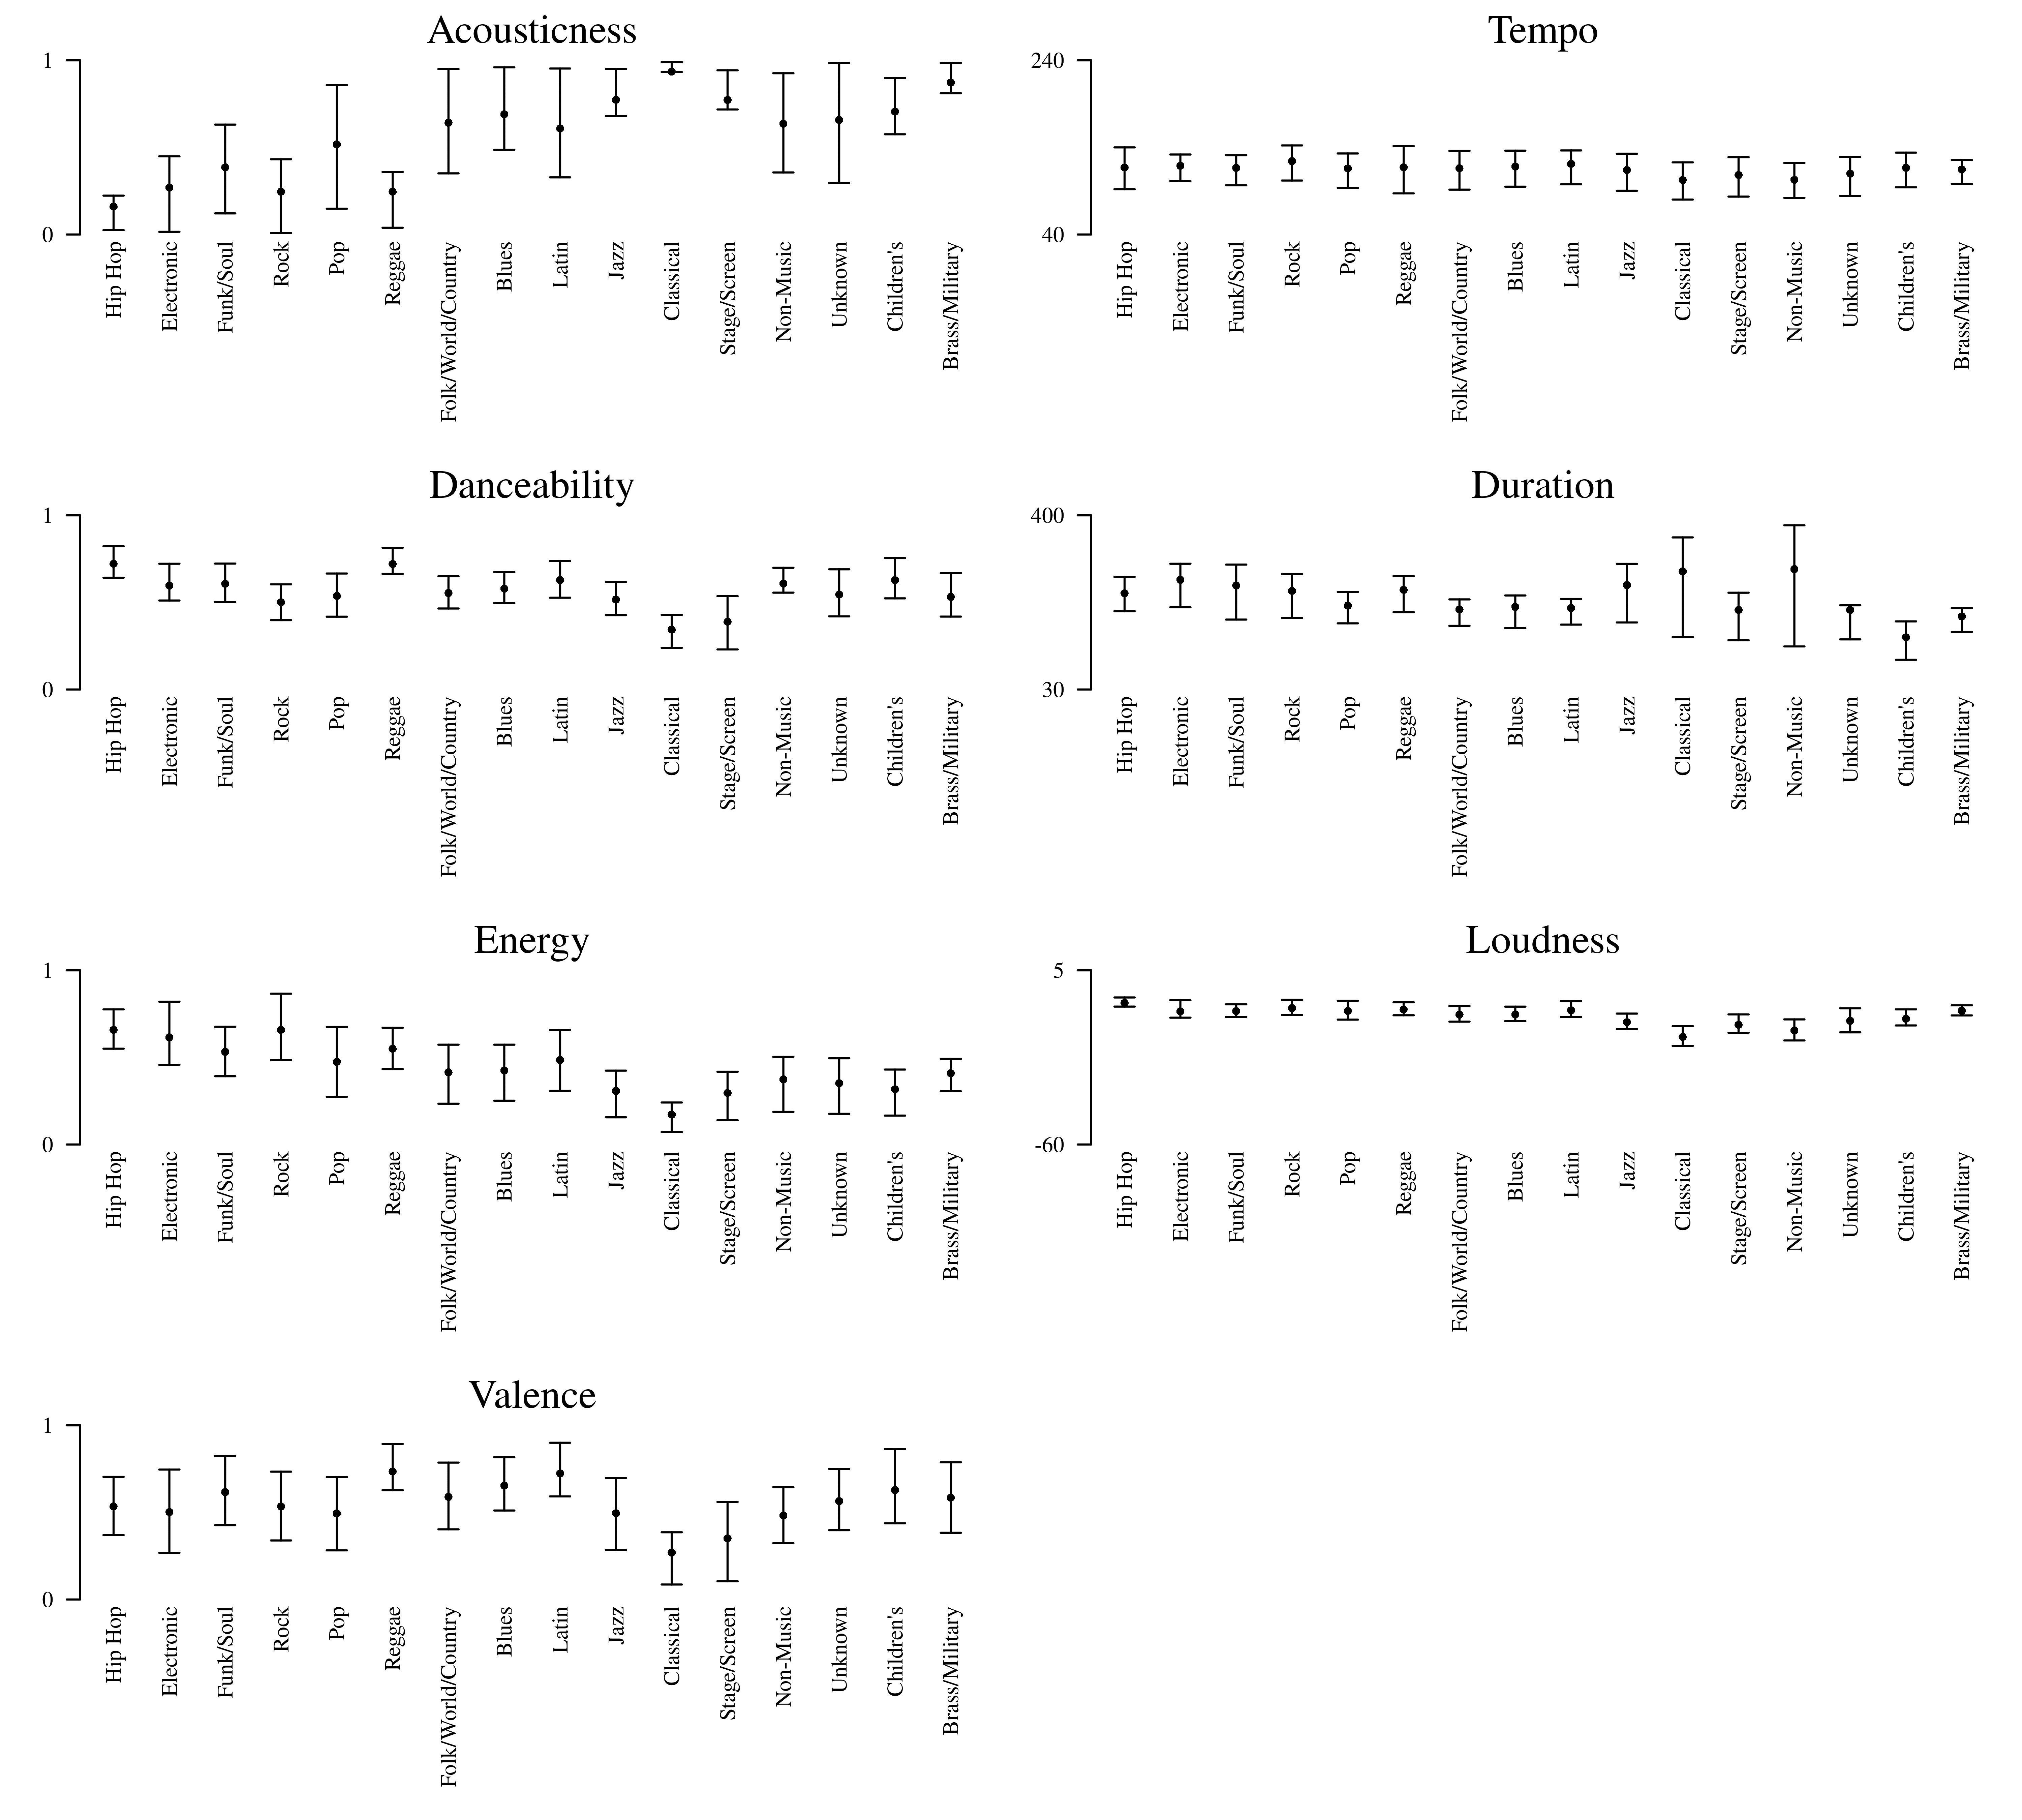
Figure 4. Mean and interquartile range for each feature across genres.
| Feature | F(15, 169893) | p | η2 |
|---|---|---|---|
| Acousticness | 7,687.22 | < .01 | .40 |
| Danceability | 3,703.23 | < .01 | .25 |
| Energy | 5,831.20 | < .01 | .34 |
| Valence | 2,079.92 | < .01 | .16 |
| Tempo | 489.06 | < .01 | .04 |
| Duration | 533.21 | < .01 | .04 |
| Loudness | 5,412.70 | < .01 | .32 |
| Artist | F | Degrees of freedom | p |
|---|---|---|---|
| The Beatles (1962-1970) | 16.87 | 7, 6793 | < .01 |
| The Rolling Stones (1964-1973) | 41.57 | 7, 9373 | < .01 |
| The Kinks (1964-1972) | 33.77 | 7, 8244 | < .01 |
| The Who (1965-1973) | 50.43 | 7, 8945 | < .01 |
| The Dave Clark Five (1964-1967) | 3.17 | 7, 2922 | < .01 |
| Paul Revere & The Raiders (1965-1971) | 2.81 | 7, 6813 | < .01 |
| The Association (1966-1969) | 1.56 | 7, 3796 | .14 |
| The Monkees (1966-1968) | 8.01 | 7, 2674 | < .01 |
| Frank Sinatra (1954-1962) | 107.50 | 7, 7149 | < .01 |
| Elvis Presley (1956-1965) | 64.67 | 7, 2795 | < .01 |
| Stevie Wonder (1972-1982) | 15.10 | 7, 2749 | < .01 |
| Michael Jackson (1979-1988) | 28.94 | 7, 1338 | < .01 |
| Queen (1973-1980) | 31.74 | 7, 8686 | < .01 |
| Led Zeppelin (1969-1979) | 38.92 | 7, 12055 | < .01 |
| Pink Floyd (1969-1980) | 48.84 | 7, 13148 | < .01 |
| Nirvana (1989-1994) | 11.80 | 7, 4763 | < .01 |
Despite further restricting our comparison to contemporaries of the same genre, all our peers (except The Association) are still "significantly" different from the rest. Still, in these analyses the sample size remains very large (6,793 for The Beatles, for example), which makes statistical significance a low bar to pass. This is not to suggest that these significant tests are in error—i.e., that the null hypothesis is true. I have conducted a few randomize simulations with the data, and despite the data imbalance, the Type-1 error rate of the approach does not seem to be inflated. Thus, it seems reasonable to conclude that these peer artists do differ from the mean feature values. The question is rather whether the scope of these differences is meaningful compared to other artists. It seems quite clear that the features we are considering vary between artists to an extent that nearly any artist will be distinct from the mean. Our need then, is to establish a metric for "normal" feature variation.
ALTERNATIVE ANALYSIS
At this point, I will propose an alternative approach to modeling the "innovativeness" of artists. A proper evaluation of the "innovativeness" of artists needs to consider variation in time and between genres and needs to account for the extreme imbalance between each artist and the full dataset. I will propose such an approach. For each of the seven Spotify features we have considered, plus three additional features (instrumentalness, liveness, and speechiness), which North and Krause did not analyze, I fitted a mixed-effects multiple regression model using the R package lme4 (version 1.1-34). I included genre and year as fixed main effects, in addition to their (fixed) interaction. Critically, I included a random-effect intercept for artist. 2 Using log-likelihood ratio tests, the effects for year, genre, and year*genre were all significant at α=.01 (Table 7).
| Feature | Effect | 𝜒2 (df) | p | Error |
|---|---|---|---|---|
| Acousticness | Year | 3,920.89(1) | < .01 | |
| Genre | 8,019.33(15) | < .01 | ||
| Year * Genre | 1,196.67(15) | < .01 | ||
| sresidual=0.19 | ||||
| sartist=0.20 | ||||
| Danceability | Year | 123.34(1) | < .01 | |
| Genre | 4,978.25(15) | < .01 | ||
| Year * Genre | 616.89(15) | < .01 | ||
| sartist=0.10 | ||||
| sresidual=0.12 | ||||
| Energy | Year | 1,450.12(1) | < .01 | |
| Genre | 5,576.11(15) | < .01 | ||
| Year * Genre | 1,042.19(15) | < .01 | ||
| sartist=0.15 | ||||
| sresidual=0.16 | ||||
| Instrumentalness | Year | 225.65(1) | < .01 | |
| Genre | 3,199.51(15) | < .01 | ||
| Year * Genre | 717.69(15) | < .01 | ||
| sartist=0.20 | ||||
| sresidual=0.20 | ||||
| Liveness | Year | 190.96(1) | < .01 | |
| Genre | 521.15(15) | < .01 | ||
| Year * Genre | 359.24(15) | < .01 | ||
| sartist=0.06 | ||||
| sresidual=0.17 | ||||
| Speechiness | Year | 209.00(1) | < .01 | |
| Genre | 6,345.50(15) | < .01 | ||
| Year * Genre | 328.93(15) | < .01 | ||
| sartist=0.08 | ||||
| sresidual=0.07 | ||||
| Loudness | Year | 433.63(1) | < .01 | |
| Genre | 4,528.26(15) | < .01 | ||
| Year * Genre | 4,029.69(15) | < .01 | ||
| sartist=3.49 | ||||
| sresidual=3.24 | ||||
| Tempo | Year | 235.91(1) | < .01 | |
| Genre | 1,314.90(15) | < .01 | ||
| Year * Genre | 197.71(15) | < .01 | ||
| sartist=8.12 | ||||
| sresidual=29.05 | ||||
| Valence | Year | 968.38(1) | < .01 | |
| Genre | 3,104.65(15) | < .01 | ||
| Year * Genre | 242.01(15) | p < .01 | ||
| sartist=0.15 | ||||
| sresidual=0.20 | ||||
| Duration | Year | 327.59(1) | p < .01 | |
| Genre | 824.31(15) | p < .01 | ||
| Year * Genre | 412.86(15) | p < .01 | ||
| sartist=74.55 | ||||
| sresidual=97.9 | ||||
Of particular interest in Table 7 is each model's estimate of the random variation between artists: sartist. These models assume normal (Gaussian) variation; sartist indicates the standard deviation of each artist, varying around a global mean (for the feature, in a particular year/genre). If we take the individual random intercept for each artist and normalize them by sartist, we get an artist-wise Z-score for each feature (Figure 5). This modeling approach estimates intercepts for all the artists at the same time, so data imbalance is not a consideration.

Figure 5. Estimated random-effect Z-scores for each peer artists, for ten features. 95% confidence interval indicated in light dotted lines.
These Z-scores, I would offer, make for better evaluations of any artists' dissimilarity from their peers. Crucially, these Z-scores do not correlate with sample size—the largest absolute correlation with sample size is r=.065, for the liveness Z-scores—, so higher scores are not simply an artifact of larger sample sizes. What we see is that none of these peer artists' variability is obviously exceptional. (Pink Floyd's high "liveness" can be attributed to 40 tracks from live performances in the 1980s and 1990s included in the data. However, there is no readily apparent explanation for Elvis Presley's high acousticness score.) What's more, the Beatles scores are generally quite small. If we compare my peer artists' scores to other artists in the dataset, we find that none are particularly exceptional there either.
CONCLUSIONS
In conclusion, I believe that North and Krause's conclusions that the Beatles' music is significantly more "innovative" than other artists in the Spotify dataset is a hasty one. Though the Spotify features show evidence of real variation between artists and genres, and across time, it doesn't appear that artistic or critical success is associated clearly with these features. The Spotify data itself also includes enough errors to call any of these analyses into question. If we simply search the data set for the "artists" with the most extreme 𝜂2 statistics or Z-scores, we find non-music "artists" like "Ocean Sounds," "Pink Noise," "Environment", and "Franklin Delano Roosevelt." Some of the actual rock bands with the highest Z-scores include Ted Nugent, King Crimson, The J. Geils Band, and Peter Frampton—a weird mix of artists to consider "innovative." My overarching conclusion is that the gross acoustic features which are captured by the Spotify features are simply not valid measures of interesting concepts like innovativeness. This may be an operational issue: e.g., perhaps Spotify's measure of "energy" is not a valid measure of "true" energy in music. It may also be a theoretical issue: for example, it may be that variation in tempo simply has no bearing on innovativeness. In any case, none of my analyses suggest that the Beatles are extreme (or even moderate) outliers with regards to any of these features. If the Beatles really were great—and I for one think they were—that greatness must manifest itself in a form not captured in Spotify's features.
ACKNOWLEDGEMENTS
This article was copyedited by Niels Chr. Hansen and layout-edited by Jonathan Tang.
NOTES
-
Correspondence can be addressed to: Dr. Nathaniel Condit-Schultz, Georgia Institute of Technology, 840 McMillan St. NW, Atlanta, GA 30332, USA, natcs@gatech.edu.
Return to Text -
Including random slopes for genre was not possible because all artists were only marked with a single genre; similarly, random slopes for year could not be included because the majority of artists only had tracks within a single year.
Return to Text
REFERENCES
- Kallen, S. A. (2012). The History of Rock and Roll. Greenhaven Publishing LLC.
- Negi, E., & Singla, G., & Bachchan, H., & Agarwal, S., & Rastogi, T., & Raut, S., & Vibes (2021). "Spotify-Data 1921-2020: Audio features of songs from 1921-2020." https://www.kaggle.com/ektanegi/spotifydata-19212020, accessed August 18th, 2023.
- North, A. C., & Krause, A. E. (2023). Are The Beatles different? A computerized psychological analysis of their music. Empirical Musicology Review, 18(2), 133–147. https://doi.org/10.18061/emr.v18i2.9178
- Shea, N. J. (2022). A demographic sampling model and database for addressing racial, ethnic, and gender bias in popular-music empirical research. Empirical Musicology Review, 17(1), 49–58. https://doi.org/10.18061/emr.v17i1.8531
