
FIRST described by Schachter & Singer (1962) in the framework of their two-factor theory of emotion, misattribution of arousal is a psychological process in which physiological arousal induced by one source is plausibly but wrongly attributed to a second source, thereby resulting in an evaluation of the wrongly presumed source that is more extreme than it would have been otherwise. The phenomenon has been documented in subsequent studies across a wide variety of contexts and sources, but most particularly in regard to increased sexual/romantic attraction due to arousal from sources such as fear and exercise. A classic experiment reported in Dutton & Aron (1974) showed how fear-induced arousal (brought about by walking over a rickety suspension bridge) led male participants to experience heightened sexual attraction to a female confederate, and similar such findings have been reported in subsequent studies using the same (e.g., Meston & Frohlich, 2003) or different (e.g., exercise; White, Fishbein, & Rutstein, 1981) sources of arousal (for a review, see Meston & Frohlich, 2003).
Two recent studies address the question of whether music could be a source of misattributed arousal in the context of romantic/sexual attraction, and to what extent therefore an arousal effect, as opposed to a courtship display effect (Darwin, 1871; Miller, 2000) or an interpersonal synchrony induced bonding effect (see e.g., Tarr, Launay, & Dunbar, 2014), can account for the well-established enhancing effect of music in such a context. Marin, Schober, Gingras, & Leder (2017) used a crossmodal priming paradigm to look at the effect of musical primes of low or high complexity, and therefore low or high arousal (Marin & Leder, 2013), on participants' evaluations of opposite-sex faces. They found the expected effects with their female participants, with the high complexity/arousal music condition producing higher attractiveness and dating desirability ratings than the low complexity/arousal or no music conditions, but there were no clear effects with their male participants. While the female results are therefore consistent with the arousal hypothesis, the overall pattern of results, as they note, is consistent with a courtship display account, according to which complexity acts as a fitness indicator influencing females in their mate preferences more than males (see Charlton, 2014, for evidence of musical complexity as a fitness indicator; Madison, Holmquist, & Vestin, 2017, for findings of a greater female response to the putative fitness indicator of music improvisational skill). Given the plausibility of the courtship display account (requiring only the additional assumption that participants inferred a link between the people depicted in the photographs and the musical primes), it is therefore unclear to what extent their findings are indicative of a pure arousal effect.
Chang, Kragness, Tsou, Bosnyak, Thiede & Trainor (2021) investigated the social bonding hypothesis using a speed-dating paradigm, predicting that participants in their experiment (a real speed-dating event) would show increased romantic interest when the background music of their date was high-groove rather than low-groove, because it would engender a higher degree of interpersonal synchrony (both partners moving more in time to the music together) and thereby lead to greater bonding. The hypothesis was not supported: there was no effect of groove on interpersonal similarity of body sway (their measure of interpersonal synchrony), while similarity of body sway did not predict greater romantic interest. However there was an effect of groove, with high-groove music promoting greater romantic interest than low-groove music, which Chang et al. tentatively interpreted as an arousal effect, with groove as the source of arousal (Bowling, Graf Ancochea, Fitch, & Hove, 2019).
In brief, there is suggestive evidence of an effect of musically induced arousal on romantic/sexual attraction, but it falls short of being conclusive. The aim of the current study is to provide more unambiguous evidence of an arousal effect, using groove as the musical source. We created an online experiment simulating a face-to-face dating event, in which participants rated the attractiveness of opposite-sex faces in a series of slideshows presented twice, once accompanied by a low-groove and once by a high-groove drum track, following which they rated the drum tracks for groove. The simulation was conceptually based on the popular "singles mixer" (Leach, 2019), and in particular on the "bar-hopping" events popularised by the German company Face-to-Face Dating (https://www.face-to-face-dating.de): at these types of events, unlike speed-dating events, participants mix in groups and music is sometimes played (see e.g., Simon, 2022). We used static facial images to reduce the likelihood of any movement-induced bonding effect, and presented them in groups of three in slideshows, accompanied by single drum tracks, so as to reduce the likelihood of individual music-to-person ascriptions yielding a courtship display effect. On the basis of Bowling et al.'s (2019) finding (Experiment 3) that groove induced solely by metrical manipulation (syncopation) leads to increased arousal, we used pairs of syncopated and unsyncopated drum tracks (matched for loudness, duration, and tempo) to induce different levels of groove, and hence arousal. We used drum tracks rather than music excerpts in order to exclude any other potentially confounding arousal-inducing elements (e.g., pitch and harmony; Smit, Dobrowohl, Schaal, Milne, & Herff, 2020), and although it would be highly unusual for drum tracks to constitute the main element in the musical accompaniment to a dating event, it would not be unusual for them to be heard as at least an occasional element, as drum breaks are a common feature in a number of popular musical styles (see e.g., Williams, 2022). We hypothesize that, for both male and female participants, the drum tracks perceived as high in groove will enhance the attractiveness of the opposite-sex faces via the high levels of arousal that they induce, and hence that participants' groove ratings, reflecting their level of arousal, will predict their attractiveness ratings.
METHOD
Ethics statement
The study protocol was approved by the local ethics committee at the University of Hertfordshire (protocol number LMS/UG/UH/04014). Participants were informed before starting the experiment that they could withdraw at any time without consequences, and that consent would be taken as implied by their completion of the experiment. No personal data other than age and sex were collected.
Participants
We based our estimate of the required number of participants on the male findings in Marin et al. (2017), as both the paradigm and repeated measures design of their experiment rendered their findings the most relevant basis for estimation. We did not perform a formal power calculation, as details of the most relevant contrasts of interest (between the high and low arousal music conditions) were not reported. However given that their final male sample of 32 participants yielded a mixture of marginally significant and non-significant findings, while their initial male sample of 40 participants (with background variables uncontrolled for) yielded one significant contrast in the expected direction (the dating desirability ratings difference between the no music and music conditions), we assumed that a sample size of N ≈ 40 would be adequate.
Eighty-four participants (41 females, 43 males) completed the study. Female participants ranged in age from 18-41 years (M = 24.2, SD = 6.09), with most (36 of 41) under 30. Male participants ranged in age from 18-42 years (M = 23.6, SD = 4.14), with most (40 of 43) also under 30. The data of a further five participants was discarded, due to them not answering all the questions (n = 3) or "speeding" (n = 2; see Appendix A). Participants were recruited by opportunity sampling (via the University of Hertfordshire's SONA Psychology Research Participant System, social media, and word of mouth). The eligibility criteria (outlined in the information sheet presented before the experiment and also in recruitment information) were that a participant should be "a male or female adult (over the age of 18) of heterosexual orientation", "enjoy listening to one or more styles of popular music", and able to do the experiment on a laptop, PC or Mac (not a mobile device) using headphones or earphones.
Although the male and female participants were closely matched in age, we did not follow Marin et al. (2017) in collecting data on participant relationship status, wish to have children, mood, and musical preferences, and then matching the two groups on these variables to control for potential confounding effects:
- Given that the predictor variable in the current study is participants' own groove ratings, there is no need to control for musical preference or mood variables (see e.g., Vuoskoski & Eerola, 2011) only likely to influence their musical response and hence only the predictor variable.
- While relationship status (though not wish to have children, as far as we are aware) can affect evaluations of facial attractiveness, via a relationship-protective process in partnered individuals of "romantic derogation" (Simpson, Gangestad, & Lerma, 1990), the process appears to be different in males and females (de Jong, Reis, Peters, DeHaan, & Birnbaum, 2019), and to depend on level of relationship commitment (Rodrigues, Lopes, & Kumashiro, 2017) and regulatory resources (Ritter, Karremans, & van Schie, 2010), thereby making it difficult to control for. However, the process appears to be triggered only when a relationship threat is perceived (study 3 in Linardatos & Lydon, 2011), and so to the extent that the experimental task in the current study is not perceived as relationship-threatening, any resultant potentially confounding effects are likely to be minimised.
Materials
Eighteen female (12 Caucasian, 6 non-Caucasian) and eighteen male faces (12 Caucasian, 6 non-Caucasian) were selected from the Face Research Lab London Set (Debruine & Jones, 2017; see Appendix B), which is a set of color images of 102 male and female faces taken in London in April 2012. The faces were taken from the smiling front set and were selected to be of average attractiveness: the neutral front set versions were rated between 2.8 and 4.2 by 1,753 heterosexual opposite-sex respondents (664 males and 1,089 females) on a 7-point scale (where 1 = "much less attractive than usual" and 7 = "much more attractive than usual"), with a mean rating of 3.51 (SD = 0.36) for the female faces and 3.31 (SD = 0.42) for the male faces. (The selection midpoint of 3.5 was set lower than the rating scale midpoint as there were only 12 female and 2 male faces in the whole set rated above 4). The images were cropped to show only the face and neck (to remove evidence of the white T-shirts all the individuals were wearing, in the interests of greater ecological validity). Six slideshows were created (Microsoft PowerPoint presentations exported to mp4) consisting of groups of three faces (two Caucasian and one non-Caucasian) preceded by ordinal numbers (#1, #2, and #3), with the first face appearing 7.5 seconds after the start and each face appearing for 2 seconds (separated by 5.5 second intervals). There were two versions of each slideshow, one with a high-groove drum track accompaniment and the other with a low-groove drum track accompaniment. The high-groove accompaniments were provided by one of three high-groove drum tracks from the Lucerne Groove Research Library (from among the top five most highly rated for groove in the study reported in Senn, Kilchenmann, Bechtold, & Hoesl, 2018), while the low-groove accompaniments were provided by three drum tracks created in Sibelius 6 (Spreadbury, Finn, & Finn, 2009) using a single variant of a pattern receiving low groove ratings in the study in Witek, Clarke, Wallentin, Kringelbach, & Vuust (2014), and that were matched for tempo, duration and overall loudness with their high-groove counterparts (see Appendix C for further details).
Procedure
The experiment was conducted online via the Qualtrics survey platform. Participants were first presented with a participant information page outlining the experiment and the nature of their involvement. They were informed that the purpose of the experiment was "to discover whether the experience of groove (the sensation evoked by highly rhythmic music, involving an urge to move in time with it) can affect people's judgments of sexual attractiveness". On clicking start they were asked for their age and sex, and were then taken to the appropriate opposite-sex branch of the experiment, where they were presented with a task instruction page outlining the experimental scenario: a simulated face-to-face dating event comprising six different groups of people in neighboring bars, each with three opposite-sex targets. They were told they would be presented with slideshows of the faces of the three targets and asked to "rate their physical attractiveness on a scale from 1 ("not at all attractive") to 5 ("very attractive")". They were then randomized to one of two presentation lists of the slideshows (the low-groove versions of slideshows 1, 2, and 3 and high-groove versions of slideshows 4, 5, and 6, or the complementary list) and were presented with them in pseudorandom order. Upon completion of this task, they were told they would be presented with the slideshows again for a second rating ("Having been to all 6 bars … you decide to go round a second time. Please watch the slideshows again … following the same procedure as before"), and were presented with the slideshows in the other presentation list in pseudorandom order. In this way all participants rated the faces in all six slideshows twice, once with a high-groove and once with a low-groove drum track accompaniment. Finally, they listened to the six drum tracks (presented in pseudorandom order) and rated them for groove (on a 5-point scale in answer to the question "To what extentdoes this drum-track make you want to move (dance, tap your feet, clapyour hands etc.)?", from 1, "not at all", to 5, "very much").
Data analysis
The goal of the analyses was to determine the effect of participants' groove response, as indicated by their groove ratings of the drum tracks, on their evaluations of physical attractiveness, as indicated by their ratings of the opposite-sex faces. After checking participants' groove ratings, analyses were conducted using linear mixed-effect (LME) modeling to investigate the relationship between attractiveness ratings and groove ratings. Analyses were performed first over the whole sample, as the experimental hypothesis predicts no sex differences in outcomes, but then also separately for the male and female samples (following Marin et al., 2017), as there are well-established mating-related sex differences that might affect relevant variables (e.g., levels of attraction in early stages of mate selection; Fletcher, Kerr, Li, & Valentine, 2014) which as a result could reduce the power of the whole-sample analyses. Model fitting was implemented using the lmer() function from the "lme4" package (Bates, Mächler, & Bolker, 2012) in R (R Core Team, 2020), following the strategy described in Burnham & Anderson (2002) and Zuur, Ieno, Walker, Saveliev, & Smith (2009) of determining first the best random effects structure, using restricted maximum likelihood estimation, where the best structure is the one yielding an AIC (Akaike Information Criterion) score at least two points lower than that of all other candidates with the same or a smaller number of parameters. The random effects tested were intercepts for participants and items (faces nested within slideshows), together with by-participant and by-item random slopes. The fixed effects in the finally chosen model were evaluated via the summary() function in the "lmerTest" package (Kuznetsova, Brockhoff & Christensen, 2017), which calculates t-statistics and corresponding p values, using Satterthwaite's method. The model output tables were created using the tab_model() function in sjPlot (Lüdecke, 2018), which in addition to estimates, confidence intervals (CIs), t-statistics and p values for the fixed-effect predictors, report information on the random effects (σ2, the within-group variance; τ00Face and τ00Participant, the between-group variances for items and participants respectively; and ICC, the Intraclass Correlation Coefficient), and the marginal and conditional R2 values (the variance accounted for by the fixed and fixed plus random effects respectively; Nagakawa, Johnson & Schielzeth, 2017).
RESULTS
Groove ratings
Groove ratings were submitted to a 3-way mixed ANOVA, with groove condition (high and low) and drum track pair as within-groups factors and sex as a between-groups factor. The means and standard deviations are shown in Table 1. As expected, the high-groove drum tracks were rated very much higher on groove than the low-groove drum tracks, yielding a highly significant effect of groove condition, F(1, 82) = 175.401, p < .001, η2p = 0.681. Drum track pair 2 however showed a lower differential than the other drum track pairs, mainly because the low-groove drum track was rated more highly compared to the other two low-groove drum tracks, yielding a significant main effect of drum track pair, F(2, 164) = 4.201, p = .0166, η2p = 0.049, and a significant interaction of drum track pair with groove condition, F(2, 164) = 12.143, p < .001, η2p = 0.129. Males and females gave similar ratings to the high-groove tracks, and although the female ratings for the low-groove tracks were lower than the male ratings, the larger resultant differential did not yield any significant interactions involving sex or a main effect of sex.
| Female | Male | All | ||||
|---|---|---|---|---|---|---|
| high (n = 41) | low (n = 41) | high (n = 43) | low (n = 43) | high (n = 84) | low (n = 84) | |
| DTP1 Mean (SD) | 3.54 (1.07) | 1.59 (0.74) | 3.74 (1.26) | 1.86 (1.08) | 3.64 (1.17) | 1.73 (0.94) |
| DTP2 Mean (SD) | 3.63 (0.92) | 2.22 (0.96) | 3.23 (1.21) | 2.49 (1.01) | 3.43 (1.09) | 2.36 (0.99) |
| DTP3 Mean (SD) | 3.49 (1.14) | 1.88 (0.98) | 3.49 (1.05) | 1.98 (0.96) | 3.49 (1.09) | 1.93 (0.97) |
Attractiveness ratings
WHOLE-SAMPLE ANALYSES
The whole sample comprised 84 participants with 3024 observations. Model-fitting (with groove ratings as the sole fixed effect) yielded a random effects structure which included random intercepts for participants and items (faces) but no by-participant or by-item slopes and no nesting factor (slideshow). Inclusion of the fixed effect factor did not result in a significant improvement in model fit: there was only a marginally significant relationship between groove ratings and attractiveness ratings (t = 1.77, p = 0.076). The participant and item random effects accounted for a substantial portion of the total variance (ICC = 0.47), with items (faces) accounting for 0.2/(0.62 + 0.37 + 0.2) = 16.8%, and participants 0.37/(0.62 + 0.37 + 0.2) = 31.1% of the total. A summary output of the model results is given in Table 2.
| Attractiveness ratings - all participants | ||||
|---|---|---|---|---|
| Predictors | Estimates | CI | t | p |
| (Intercept) | 2.10 | 1.90 – 2.31 | 19.79 | <.001 |
| Groove ratings | 0.02 | -0.00 – 0.05 | 1.77 | .076 |
| Random Effects | ||||
| σ2 | 0.62 | |||
| τ00Participant | 0.37 | |||
| τ00Face | 0.20 | |||
| ICC | 0.47 | |||
| NFace | 36 | |||
| NParticipant | 84 | |||
| Observations | 3024 | |||
| Marginal R2 / Conditional R2 | 0.001 / 0.475 | |||
In order to investigate possible gender differences in arousal response, we also fitted a model with both groove ratings and gender as fixed effect factors together with an interaction term. As before, the process yielded a random effects structure which included only random intercepts for participants and items (faces). Inclusion of the fixed effect factors did not result in a significant improvement in model fit: there was no evidence of any relationship between groove ratings or gender and attractiveness ratings, and no evidence of an interaction effect. The participant and item random effects accounted for a substantial portion of the total variance (ICC = 0.47), with items (faces) accounting for 16.2% and participants 30.8% of the total. A summary output of the model results is given in Table 3.
| Attractiveness ratings - all participants | ||||
|---|---|---|---|---|
| Predictors | Estimates | CI | t | p |
| (Intercept) | 2.01 | 1.71 – 2.30 | 13.33 | <.001 |
| Groove ratings | 0.01 | -0.03 – 0.04 | 0.30 | .768 |
| Gender | 0.20 | -0.22 – 0.61 | 0.94 | .351 |
| Groove ratings * Gender | 0.03 | -0.02 – 0.08 | 1.29 | .199 |
| Random Effects | ||||
| σ2 | 0.62 | |||
| τ00Participant | 0.36 | |||
| τ00Face | 0.19 | |||
| ICC | 0.47 | |||
| NFace | 36 | |||
| NParticipant | 84 | |||
| Observations | 3024 | |||
| Marginal R2 / Conditional R2 | 0.019 / 0.482 | |||
SUBSAMPLE ANALYSES
The female sample comprised 41 participants with 1,476 observations. Model-fitting yielded a random effects structure which included random intercepts for participants and items (faces) but no by-participant or by-item slopes and no nesting factor (slideshow). Inclusion of the fixed effect factor did not result in a significant improvement of model fit: there was no evidence of any relationship between groove ratings and attractiveness ratings. The participant and item random effects accounted for a substantial portion of the total variance (ICC = 0.41), with items (faces) accounting for 10.9%, and participants 30% of the total. A summary output of the model results is given in Table 4.
| Attractiveness ratings – female participants | ||||
|---|---|---|---|---|
| Predictors | Estimates | CI | t | p |
| (Intercept) | 2.00 | 1.74 – 2.26 | 14.99 | <.001 |
| Groove ratings | 0.01 | -0.03 – 0.04 | 0.37 | .711 |
| Random Effects | ||||
| σ2 | 0.65 | |||
| τ00Participant | 0.33 | |||
| τ00Face | 0.12 | |||
| ICC | 0.41 | |||
| NFace | 18 | |||
| NParticipant | 41 | |||
| Observations | 1476 | |||
| Marginal R2 / Conditional R2 | 0.000 / 0.408 | |||
The male sample comprised 43 participants with 1,548 observations. As with the female sample, model-fitting yielded a random effects structure which included only random intercepts for participants and items (faces). By contrast with the female sample, however, inclusion of the fixed effect factor resulted in a very small (marginal r2 = 0.002) but significant improvement of model fit: there was a significant relationship between groove ratings and attractiveness ratings (t = 2.17, p = 0.03), with each one-point increase in groove ratings leading to a 0.04 point increase in attractiveness ratings. As with the female sample, the participant and item random effects accounted for a substantial portion of the total variance (ICC = 0.53), with items (faces) accounting for 21.3%, and participants 31.5% of the total. A summary output of the model results is given in Table 5.
| Attractiveness ratings – male participants | ||||
|---|---|---|---|---|
| Predictors | Estimates | CI | t | p |
| (Intercept) | 2.21 | 1.88 – 2.53 | 13.46 | <.001 |
| Groove ratings | 0.04 | 0.00 – 0.07 | 2.17 | .030 |
| Random Effects | ||||
| σ2 | 0.60 | |||
| τ00Participant | 0.40 | |||
| τ00Face | 0.27 | |||
| ICC | 0.53 | |||
| NFace | 18 | |||
| NParticipant | 43 | |||
| Observations | 1548 | |||
| Marginal R2 / Conditional R2 | 0.002 / 0.528 | |||
DISCUSSION
In a crossmodal priming experiment simulating a face-to-face dating event, we investigated the effect of groove on sexual attraction, and found evidence in the subsample analyses partially supportive of the arousal hypothesis: male participants' groove ratings of the drum track accompaniments positively predicted their attractiveness ratings of the opposite-sex faces presented in the associated slideshows. The size of the effect (B = 0.04, corresponding to a difference of ~ 0.08 points for the ~ 2-point difference in groove ratings between the highest and lowest rated drum tracks) is comparable to that found by Marin et al. (2017) for the effect of music vs. no music on dating desirability in their final male sample (a difference of 0.12 points, on their 7-point scale). While the effect is tiny on a standardized metric (r = 0.05), it is nevertheless likely to be of some significance if evaluated according to the more concrete criterion of its potential practical consequences (Funder & Ozer, 2019): a recent speed-dating study (Roth, Samara, & Kret, 2021) found substantial effects of increments in visual attractiveness on male propensity to date again, such that even tiny increments of the sort found here might be practically significant (inspection of their Figure 1A suggests that a 0.1-point increase in female visual attractiveness led in their study to a ~ 2.5-point increased probability of wanting another date).
How confidently though can the male participant finding be attributed to an arousal effect? Given the experimental design precautions outlined in the Introduction and the overall pattern of results, it is unlikely to be the result of a courtship display or social bonding effect. Could it be the result of a demand artifact (Orne, 1962)? Participants were informed of the purpose of the experiment (though not the direction of the experimental hypothesis), and nearly all (on the evidence of their groove ratings) were able to differentiate the high-groove and low-groove drum track accompaniments. However the artifact hypothesis faces two difficulties: (i) online experiments appear to be generally robust to artifacts, even when participants are made aware of the researcher hypotheses (Mummolo & Peterson, 2018); (ii) the hypothesis offers no explanation for the absence of an effect with the female participant group. The conclusion is clear: the male finding is unlikely to be the result of an artifact.
The other possibility is that the male finding is a type 1 error. There are two reasons for suspicion: (i) the finding is statistically not very robust; and (ii) it is not corroborated by the whole-sample analyses. However the lack of statistical robustness might be simply a power issue (the experiment was not powered to find an effect smaller than that suggested by the male findings in Marin et al., 2017), while the failure of the whole-sample analyses to corroborate the subsample analyses might be a consequence of the female participants showing a smaller effect than the males, and therefore also an issue of inadequate power (cf. the earlier discussion of analytic strategy in the Data analysis subsection). Hence, if there are good reasons for thinking that the female participants would be likely to show a smaller effect than the males, then that would strengthen the case for thinking that the male finding is genuine and not a type 1 error, and would also explain the null finding in the female subsample analysis.
Are there reasons for thinking that the female participants would be likely to show less of an effect than their male counterparts? One reason might be a less differentiated female arousal response to groove (a smaller increase in arousal in response to high-groove stimuli), as documented by Bowling et al. (2019) on their arousal measures (they unfortunately do not report findings by sex on their groove measure). While no such sex difference was apparent in our groove rating data, the possibility that there was a difference cannot be ruled out in the absence of accompanying arousal data (which we did not collect). A more general reason, however, could be the well-documented difference between males and females in the importance of internal physiological cues to emotion perception: females tend to be more affected by stimulus cues and less by internal cues compared to males (Pennebaker & Roberts, 1992; Roberts & Pennebaker, 1995). Hence, females may be less likely than males to be prompted by a purely physiological change of state such as increased arousal to re-evaluate an unchanged stimulus. While the conjecture is speculative, what limited evidence there is from the only study we are aware of in the misattributed arousal literature, apart from the two music studies discussed here, that reports a breakdown of results by sex of participant, is tentatively supportive: Meston & Frohlich (2003) report what appears to be a numerically greater effect of arousal on their male attractiveness and dating desirability ratings (see their Figures 1 and 2), though they don't report the relevant means and in neither case do the differences yield a statistically reliable main effect or interaction. As regards the two music studies, while Marin et al.'s (2017) findings would of course contradict the conjecture if they are indeed purely the result of misattributed arousal, Chang et al.'s (2021) groove findings would provide further tentative support. Their findings appear to show (see their Figure 1A) a numerically greater effect of high vs. low groove music on male compared to female propensity to meet again, though the difference does not yield a significant interaction.
In short, there are plausible reasons for expecting a smaller female than male groove-induced arousal effect, and hence there is a good case for accepting the male finding here as genuine. The conclusion therefore is that our study provides evidence of an enhancing effect of musical groove on sexual attraction in males that is most plausibly the result of misattributed arousal, while the absence of an effect in our female participant group may be the result of a sex difference in groove response or more generally a sex difference in the evaluation of cues of physiological arousal.
ACKNOWLEDGMENTS
We would like to thank Peter Harrison and Daniel Müllensiefen for advice and help with the statistical analyses and using R, Marcus Pearce and Andrea Halpern for helpful comments on an earlier version of this paper presented at a Queen Mary University of London Music Cognition Lab seminar on July 6 2021, and the two reviewers, Olivier Senn and Manuela Marin, for wide-ranging and helpful criticisms of the originally submitted version of this paper. This article was copyedited by Matthew Moore and layout edited by Diana Kayser.
NOTES
-
Correspondence can be addressed to c.lee31@herts.ac.uk.
Return to Text
REFERENCES
- Bates, D., Mächler, M., Bolker, B., & Walker, S. (2015). Fitting linear mixed-effects models using lme4. Journal of Statistical Software, 67(1), 1 - 48. https://doi.org/10.18637/jss.v067.i01
- Bowling, D. L., Graf Ancochea, P., Hove, M. J., & Fitch, W. T. (2019). Pupillometry of groove: Evidence for noradrenergic arousal in the link between music and movement. Frontiers in Neuroscience, 12, 1039. https://doi.org/10.3389/fnins.2018.01039
- Burnham, K.P., & Anderson D.R. (2002) Model selection and multimodel inference: A practical information-theoretical approach, 2nd edn. New York: Springer.
- Chang, A., Kragness, H. E., Tsou, W., Bosnyak, D. J., Thiede, A., & Trainor, L. J. (2021). Body sway predicts romantic interest in speed dating. Social cognitive and Affective Neuroscience, 16(1-2), 185–192. https://doi.org/10.1093/scan/nsaa093
- Charlton, B. D. (2014). Menstrual cycle phase alters women's sexual preferences for composers of more complex music. Proceedings of the Royal Society B: Biological Sciences, 281(1784), 20140403. https://doi.org/10.1098/rspb.2014.0403
- Conrad, F., Tourangeau, R., Couper, M., & Zhang, C. (2017). Reducing speeding in web surveys by providing immediate feedback. Survey Research Methods, 11(1), 45-61. https://doi.org/10.18148/srm/2017.v11i1.6304
- Darwin C. (1871). The descent of man and selection in relation to sex. London, UK: Murray. https://doi.org/10.5962/bhl.title.121292
- DeBruine, L., & Jones, B. (2017). Face Research Lab London Set (Version 3). https://doi.org/10.6084/m9.figshare.5047666.v3
- de Jong, D., Reis, H., Peters, B., DeHaan, C., & Birnbaum, G. (2019). The role of implicit sexual desire in romantic relationships. Personality and Individual Differences. 149, 46-56. https://doi.org/10.1016/j.paid.2019.05.042
- Dutton, D. G., & Aron, A. P. (1974). Some evidence for heightened sexual attraction under conditions of high anxiety. Journal of Personality and Social Psychology, 30(4), 510–517. https://doi.org/10.1037/h0037031
- Fletcher, G. J., Kerr, P. S., Li, N. P., & Valentine, K. A. (2014). Predicting romantic interest and decisions in the very early stages of mate selection: standards, accuracy, and sex differences. Personality & Social Psychology Bulletin, 40(4), 540–550. https://doi.org/10.1177/0146167213519481
- Funder, D. C., & Ozer, D. J. (2019). Evaluating effect size in psychological research: Sense and nonsense. Advances in Methods and Practices in Psychological Science, 156–168. https://doi.org/10.1177/2515245919847202
- Hoesl, F., & Senn, O. (2018). Modelling perceived syncopation in popular music drum patterns: A preliminary study. Music & Science. https://doi.org/10.1177/2059204318791464
- Kuznetsova, A., Brockhoff, P. B., & Christensen, R. H. B. (2017). lmerTest package: Tests in linear mixed effects models. Journal of Statistical Software, 82(13), 1–26. https://doi.org/10.18637/jss.v082.i13
- Leach, P. (2019, August 21). Watch out Tinder: The singles mixer is back. Glamour. https://www.glamour.com/story/singles-mixers-are-back
- Linardatos, L., & Lydon, J. E. (2011). Relationship-specific identification and spontaneous relationship maintenance processes. Journal of Personality and Social Psychology, 101(4), 737–753. https://doi.org/10.1037/a0023647
- Lüdecke, D. (2018). sjPlot: Data visualization for statistics in social science. R package version, 2(1).
- Madison, G., Holmquist, J., & Vestin, M. (2018). Musical improvisation skill in a prospective partner is associated with mate value and preferences, consistent with sexual selection and parental investment theory: Implications for the origin of music. Evolution and Human Behavior, 39(1), 120–129. https://doi.org/10.1016/j.evolhumbehav.2017.10.005
- Marin, M. M., & Leder, H. (2013). Examining complexity across domains: Relating subjective and objective measures of affective environmental scenes, paintings and music. PloS one, 8(8), e72412. https://doi.org/10.1371/journal.pone.0072412
- Marin, M. M., Schober, R., Gingras, B., & Leder, H. (2017). Misattribution of musical arousal increases sexual attraction towards opposite-sex faces in females. PloS one, 12(9): e0183531. https://doi.org/10.1371/journal.pone.0183531
- Meston, C. M., & Frohlich, P. F. (2003). Love at first fright: Partner salience moderates roller-coaster-induced excitation transfer. Archives of Sexual Behavior. 32(6), 537-44. https://doi.org/10.1023/A:1026037527455
- Miller, G. (2000). Evolution of human music through sexual selection. In N. L. Wallin, B. Merker, & S. Brown (Eds.), The origins of music (pp. 329–360). Cambridge, MA: MIT Press.
- Mummolo, J., & Peterson, E. (2019). Demand effects in survey experiments: An empirical assessment. American Political Science Review, 113(2), 517-529. https://doi.org/10.1017/S0003055418000837
- Nakagawa, S., Johnson, P. C., & Schielzeth, H. (2017). The coefficient of determination R 2 and intra-class correlation coefficient from generalized linear mixed-effects models revisited and expanded. Journal of the Royal Society Interface, 14(134), 20170213. https://doi.org/10.1098/rsif.2017.0213
- Orne, M. T. (1962). On the social psychology of the psychological experiment: With particular reference to demand characteristics and their implications. American Psychologist, 17, 776-783. https://doi.org/10.1037/h0043424
- Pennebaker, J. W., & Roberts, T.-A. (1992). Toward a his and hers theory of emotion: Gender differences in visceral perception. Journal of Social and Clinical Psychology, 11(3), 199–212. https://doi.org/10.1521/jscp.1992.11.3.199
- Primativo, S., Spinelli, D., Zoccolotti, P., De Luca, M., & Martelli, M. (2016). Perceptual and cognitive factors imposing "speed limits" on reading rate: A study with the Rapid Serial Visual Presentation. PloS one, 11(4), e0153786. https://doi.org/10.1371/journal.pone.0153786
- R Core Team (2020). R: A language and environment for statistical computing. R Foundation for Statistical Computing, Vienna, Austria. https://www.R-project.org/.
- Ritter, S. M., Karremans, J. C., & van Schie, H. T. (2010). The role of self-regulation in derogating attractive alternatives. Journal of Experimental Social Psychology, 46(4), 631–637. https://doi.org/10.1016/j.jesp.2010.02.010
- Roberts, T.-A., & Pennebaker, J. W. (1995). Gender differences in perceiving internal state: Toward a his-and-hers model of perceptual cue use. In M. P. Zanna (Ed.), Advances in experimental social psychology, (Vol. 27, pp. 143–175). Academic Press. https://doi.org/10.1016/S0065-2601(08)60405-0
- Rodrigues, D., Lopes, D., & Kumashiro, M. (2017). The "I" in us, or the eye on us? Regulatory focus, commitment and derogation of an attractive alternative person. PLoS one, 12(3), e0174350. https://doi.org/10.1371/journal.pone.0174350
- Roth, T., Samara, I., & Kret, M. (2021). Multimodal mate choice: Exploring the effects of sight, sound, and scent on partner choice in a speed-date paradigm. Evolution and Human Behavior. https://doi.org/10.1016/j.evolhumbehav.2021.04.004
- Schachter, S., & Singer, J. (1962). Cognitive, social and physiological determinants of emotional state. Psychological Review, 69(5), 379-399. https://doi.org/10.1037/h0046234
- Senn, O., Kilchenmann, L., Bechtold, T., & Hoesl, F. (2018). Groove in drum patterns as a function of both rhythmic properties and listeners' attitudes. PloS one, 13(6), e0199604. https://doi.org/10.1371/journal.pone.0199604
- Simon, A. (2022, February 24). This electric singles night promises burlesque shows, cocktails, magic and more. Secret London. https://secretldn.com/inner-circle-singles-night-royal-exchange/
- Simpson, J. A., Gangestad, S. W., & Lerma, M. (1990). Perception of physical attractiveness: Mechanisms involved in the maintenance of romantic relationships. Journal of Personality and Social Psychology, 59(6), 1192–1201. https://doi.org/10.1037/0022-3514.59.6.1192
- Smit, E. A., Dobrowohl, F. A., Schaal, N. K., Milne, A. J., & Herff, S. A. (2020). Perceived emotions of harmonic cadences. Music & Science. https://doi.org/10.1177/2059204320938635
- Spreadbury, D., Finn, B., & Finn, J. (2009). Sibelius 6: Reference. Avid Technology, Incorporated.
- Tarr, B., Launay, J., & Dunbar, R. I. (2014). Music and social bonding: "Self-other" merging and neurohormonal mechanisms. Frontiers in psychology, 5, 1096. https://doi.org/10.3389/fpsyg.2014.01096
- Vuoskoski, J. K., & Eerola, T. (2011). The role of mood and personality in the perception of emotions represented by music. Cortex: A Journal Devoted to the Study of the Nervous System and Behavior, 47(9), 1099–1106. https://doi.org/10.1016/j.cortex.2011.04.011
- White, G.L., Fishbein, S., & Rutstein, J. (1981). Passionate love and the misattribution of arousal. Journal of Personality and Social Psychology, 41(1), 56–62. https://doi.org/10.1037/0022-3514.41.1.56
- Williams, S. (2022, May 17). 10 of the greatest drum breaks of all time and where you can hear them. MusicRadar. https://www.musicradar.com/news/best-drum-breaks-of-all-time
- Witek, M., Clarke, E., Wallentin, M., Kringelbach, M., & Vuust, P. (2014). Syncopation, body-movement and pleasure in groove music. PloS one, 9(4), e94446. https://doi.org/10.1371/journal.pone.0094446
- Zuur, A., Ieno, E.N., Walker, N.J., Saveliev, A. A., & Smith, G.M. (2009). Mixed effects models and extensions in ecology with R. Statistics for Biology and Health. NY: Springer. https://doi.org/10.1007/978-0-387-87458-6
APPENDIX
A. Speeding in online experiments and the minimum completion time criterion
It is well-known that some participants in online experiments take shortcuts when answering questions and thereby provide data that is sub-optimal (see e.g., Conrad, Tourangeau, Cooper, & Zhang, 2017). In order to address the problem, we calculated a minimum completion time for the experiment, based on the assumption that participants should at the very least watch/listen to the entirety of the audiovisual material presented and be able to read the experimental instructions and questions (at a speed of 300 wpm, the likely upper functional reading speed limit; Primativo, Spinelli, Zoccolotti, De Luca, &Martelli, 2017), and we discarded any responses that were produced in less than this time. We excluded the texts in the information and debrief sheets in the calculation, as there were legitimate reasons for not reading them: (i) participants may already have been familiar with the information in the information sheet from recruitment literature; (ii) participants may have been uninterested in the follow-up information provided in the debrief sheet. The minimum completion time was therefore calculated as follows: duration of audiovisual material (428 seconds) + text (55 seconds) = 483 seconds.
B. Faces used in the slideshows
Tables B.1 and B.2 give details of the female and male faces respectively used in the slideshows (slideshow number, plus face id, ethnicity and age of the person depicted in the image, and mean attractiveness rating by opposite-sex heterosexual raters, as given by Debruine& Jones, 2017).
| Slideshow | Face id | Ethnicity | Age | Attractiveness |
|---|---|---|---|---|
| 1 | X002 | White | 24 | 3.72 |
| 1 | X025 | Black | 21 | 2.94 |
| 2 | X003 | White | 38 | 2.98 |
| 2 | X007 | White | 31 | 4.16 |
| 2 | X034 | East-Asian | 24 | 2.97 |
| 3 | X010 | White | 26 | 3.4 |
| 3 | X066 | West-Asian | 22 | 3.68 |
| 3 | X014 | White | 23 | 3.9 |
| 4 | X016 | White | 23 | 3.33 |
| 4 | X087 | East-Asian | 31 | 3.41 |
| 4 | X019 | White | 24 | 3.32 |
| 5 | X126 | Black | 25 | 3.58 |
| 5 | X032 | White | 36 | 3.45 |
| 5 | X081 | White | 25 | 3.21 |
| 6 | X127 | East-Asian | 28 | 3.59 |
| 6 | X083 | White | 21 | 3.79 |
| 6 | X086 | White | 23 | 4.15 |
| Slideshow | Face id | Ethnicity | Age | Attractiveness |
|---|---|---|---|---|
| 1 | X018 | White | 19 | 3.21 |
| 1 | X037 | West-Asian | 37 | 3.17 |
| 2 | X022 | White | 29 | 2.88 |
| 2 | X026 | White | 24 | 2.81 |
| 2 | X042 | East-Asian | 27 | 3.64 |
| 3 | X029 | White | 26 | 3.4 |
| 3 | X045 | East-Asian | 23 | 2.91 |
| 3 | X033 | White | 28 | 4.03 |
| 4 | X041 | White | 23 | 3.67 |
| 4 | X067 | East-Asian | 31 | 2.84 |
| 4 | X063 | White | 24 | 2.86 |
| 5 | X082 | Black | 20 | 3.15 |
| 5 | X101 | White | 37 | 3.94 |
| 5 | X104 | White | 22 | 3.63 |
| 6 | X137 | Black | 21 | 2.97 |
| 6 | X108 | White | 23 | 4.02 |
| 6 | X123 | White | 18 | 3.26 |
C. Drum tracks used in the experiment
The three high-groove drum tracks were taken from the Lucerne Groove Research Library (http://www.grooveresearch.ch), from the top 5 rated for groove in the experiment reported in Senn et al. (2018), as follows (drum track number followed in parentheses by siglum, track name, syncopation level, tempo in bpm, and groove rating): Drum track 1 (ChaD_1, "Baltimore DC", 114, 86bpm, 0.823); Drum track 2 (MarB_4, "Jelly belly", 272, 99bpm, 0.808); Drum track 3 (ThoA_5, "Chicken grease", 29, 91bpm, 0.653). We used three tracks, with low, medium, and high levels of syncopation (on the index calculated according to Hoesl&Senn, 2018), rather than a single track, to try and ensure that participants with potentially varying syncopation level preferences would find at least one highly groove-inducing (on the relationship between syncopation and groove, see Witek et al., 2014).
The low-groove drum tracks were created in Sibelius 6 (Spreadbury et al., 2009) using the drum set sounds in the built-in Sibelius Player (with the expression and rubato performance style options set to "meccanico", and the rhythmic feel option set to "straight"). They were all based on a single pattern (see Fig. C.1): a variant of a moderately low groove-rated drum pattern (drum break 3) in Witek et al. (2014), modified so as to further reduce the syncopation level (from 6 to 3 on Witek et al's index and to 0 on Hoesl&Senn's index) and thereby hypothetically further reduce the level of groove. They were matched in tempo and length (8 bars, plus a final hi-hat, snare and bass drum hit on the downbeat of bar 9) with their high-groove counterparts, exported to audio (wav format), then edited in Audacity to match their overall loudness levels, and finally exported to mp3 format. They can be accessed at the Open Science Framework (https://osf.io/ncvf6/).
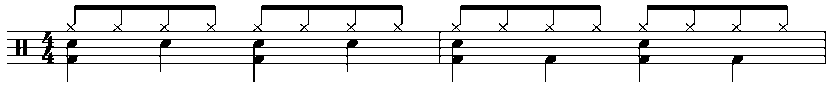
Figure C.1. The pattern used for the low-groove drum tracks (hi hat, snare, and bass drum parts on the top, middle, and bottom lines respectively of the stave).
