
ORCHESTRATION treatises often consistently describe the characteristic timbres of musical instruments (Wallmark, 2019). In treatises as well as in everyday musical discourse, people can (and often do) talk about the timbre of specific instrument types and may comment on one instrumental timbre with respect to another—for example, comparing the timbre of the oboe to the timbre of the trumpet. Yet, it is also widely recognized that musical instruments usually produce not a single timbre, but rather, as McAdams and Goodchild (2017) phrase it, "a constrained universe of timbres" (p.129). Timbre varies not only across instruments, but also within instruments, in relation to many factors including (but not limited to) pitch, register, intensity, articulation, duration, and vibrato. Historically, most literature on timbre does not address this polysemy, though explicitly distinguishing across-instrument vs. within-instrument timbre has become increasingly important as timbre and orchestration research continues to gain traction in recent decades; Siedenburg and McAdams (2017) discuss these issues in relation to their observation that timbre functions on different scales of detail.
There are many sources of within-instrument timbral variation. For example, Traube (2004) examined the effects of elements including plucking position and instrumental gestures on the timbral variability of the classical guitar. Practical considerations, including fingerings, which string a note is played on, mouthpieces, and reeds all have timbral repercussions. In many contexts, professional musicians consider the resulting timbral effects from variation on such parameters to be of critical importance even when differences in tone color are subtle. Other timbral variations can result from the idiosyncratic contributions of an individual's tone quality, the particular instrument brand and specific instrument being played, and the acoustics of the room. In aiming to achieve a certain variation of timbre on an instrument, musicians may intentionally vary aspects of their playing; for example, Bernays and Traube (2014) found some commonalities in how pianists manipulated dynamics and articulation when performing the same excerpt with different timbral intentions, but they also found that pianists exhibited unique profiles for how they approached achieving various timbres. In addition to the plethora of sources of timbral flexibility offered by traditional modes of performance, there is yet another world of timbres offered by extended techniques.
With so many different means of timbral variation available from a single instrument, choosing a starting point for systematic investigation is challenging. In nearly all contexts, music varies in pitch, loudness, articulation, and/or duration in ways that seem to be salient for most listeners, and so these parameters offer a reasonable place to begin investigation into within-instrument timbral variability. The experiment reported in this paper focuses on timbral variability in pitch (register) and intensity (dynamics), with the goal of establishing a methodology by which future studies can extend the scope of such investigations to manipulations of articulation, duration, and other playing parameters.
Relatively few experiments have investigated interactions between pitch and timbre. Some results suggest that pitch differences over an octave make it difficult to extrapolate a common sound source (Handel and Erickson, 2001; Marozeau et al., 2003), though musicians seem to be more successful than nonmusicians at this task (Steele & Williams, 2006). Complications arising from the interaction of pitch and timbre have been reported in speeded classification (Krumhansl & Iverson, 1992). An experiment reported by Allen and Oxenham (2014) observed interference of pitch and timbre, with results suggesting that in particular, pitch height and brightness are tightly related. Several other experiments provide evidence in support of a general link between pitch height and brightness perception (e.g., Marozeau & de Cheveigné, 2007; Cousineau et al., 2014).
Timbral differences across an instrument's range may be observed among registers. Here, "register" is used to refer to the concept of a section of the range of an instrument or voice that often is considered to demonstrate characteristic timbral qualities. Pitch itself is a continuous variable; register is categorical, but registers are also more clearly defined for some instruments than others. Different registers of an instrument or voice are not determined by a fixed interval, but rather are related to the physics of the sound source (Drabkin, 2001). Consequently, as the term is used in this paper, register is defined relative to a single instrument type and is not constant across instruments (e.g., as with orchestral register)—the lowest register of the flute, for example, overlaps with the highest register of the bassoon. Anecdotally, for some instruments more so than others, timbre varies characteristically among registers. The B♭ clarinet provides a standard example of distinct conceptual registers, with its four registers often defined as: the dark, hollow "chalumeau" register from E3 to G4; the "throat" register from G#4 to B♭4; the brighter, sweeter "clarion" register from B4 to C6; and the shrill, "extreme" register above C6 (Page et al., 2001). This "extreme" register is often referred to as the "altissimo" register.
Even for instruments without specific vocabulary for registers, regions of the instruments often have distinct timbral characters. Colloquially, it is often common to refer generally to the low, middle, or high register of an instrument. For example, the Vienna Symphonic Library (n.d.) describes the oboe's registers as lower (B♭3–F4), middle (F#4–B♭5), and upper (B5–G6). Notes above G6 are possible but rare and are described as belonging to the altissimo register (Redgate, 2018). As circumscribed by the Vienna Symphonic Library, the registers of the French horn include the low register (B1–D3), middle register (E♭3–E♭4), and upper register (E4–F5). While the timbral characters of different registers of instruments are familiar to many musicians, and especially familiar for a player of a given instrument, no research has systematically considered timbre semantics in relation to instrument registers.
With natural instrument sounds, the relative contributions of pitch height and register to an instrument's timbre are difficult, if not impossible, to parse perceptually. One study presents evidence that register may contribute uniquely to timbre, apart from variation in pitch: a machine learning model using Linear Discriminant Analysis (LDA) reported in Weihs, et al. (2005) demonstrates highly successful classification of register by spectrum only, that is, when all pitch information has been eliminated. However, in the current experiment, which uses unmanipulated recordings of natural instrument sounds, pitch and register remain conflated for the sake of ecological validity. Because of the way in which this factor is operationalized (see Materials), the term "register" includes differences in both register and pitch height.
Musical observation confirms that greater playing effort and consequently louder dynamics affect timbre significantly. Increased playing effort amplifies the energy at all of the same frequencies present in the original sound, but also, as more and more modes of vibration of the instrument spring into action, the spectrum spreads toward higher frequencies. The results of such changes can include a higher spectral centroid, a greater spectral spread, and a lower spectral slope (McAdams, 2019). However, very few studies have focused on the interactions between timbre and intensity. Pratt and Bowsher (1978), investigating the qualities of trombone timbre, compared one high and one low sound as well as one loud and one soft sound. Most participants rated the higher sound as brighter and less pleasant than the low sound; the louder note was also rated as brighter and less pleasant than the quiet sound. Using synthesized sounds as stimuli, Melara and Marks (1990) observed Garner interference in support of interaction between timbre and intensity as well as between timbre and pitch, which they argue suggests that these three attributes of sound are processed jointly by the perceptual system. Fabiani and Friberg (2011) asked participants to judge dynamics of stimuli varying on pitch, loudness, and timbre; they found that instrumental timbre and loudness influenced judgments of dynamics across all instruments, while pitch generally influenced judgments of dynamics for three out of the five instrument timbres tested.
One likely reason that little research has been done on the semantics related to the timbral flexibility of individual instruments is that the possible combinations of pitch, loudness, articulation, duration, etc. are often multitudinous. Furthermore, due to differences in physical construction, it is probable that instrument sounds do not all vary uniformly, and there are likely interactions among factors affecting timbres—thus, a complete mapping of variations on one type of instrument will likely not be fully applicable to other instruments. The project of mapping out timbral interactions across many instruments is a formidable task and beyond the scope of any individual study. Though some trends may be generally or for the most part shared among certain groups of instruments—for example, a plausible tendency for brightness to increase systematically with pitch—the extent of such commonalities is unknown. Yet, the results of such endeavors to map conceptualizations of within-instrument timbral variations for a wide variety of instruments would be useful in both composition and music analysis. These findings could also be informative for future empirical research in timbre; for example, in providing a measure of semantic distances among stimuli. The primary goal of this exploratory paper is to determine which semantic dimensions may be most pertinent to register and to dynamics in order to make grounded future predictions.
This article reports an experiment that uses the 20-dimensional timbre qualia model reported in Reymore and Huron (2020) to investigate the effects of changes in register and dynamics on the timbres of two instruments, the oboe and the French horn. Reymore and Huron's model, reproduced in Table 1, was derived from a multi-stage study involving interviews and rating tasks and reflects Western musicians' cognitive conceptions of qualia associated with typical instrument sounds through linguistic descriptions.
| Dimension description | Shorthand label |
|---|---|
| 1. rumbling, booming, low, deep, thick, fat, heavy | rumbling/low |
| 2. soft, smooth, singing, voice-like, sweet, gentle, calm | soft/singing |
| 3. watery, fluid | watery/fluid |
| 4. direct, projecting, loud, aggressive, commanding, assertive, powerful | direct/loud |
| 5. nasal, reedy, buzzy, pinched, constrained | nasal/reedy |
| 6. shrill, harsh, noisy | shrill/noisy |
| 7. percussive | percussive |
| 8. pure, clear, precise, clean | pure/clear |
| 9. brassy, metallic | brassy/metallic |
| 10. raspy, guttural, grainy, gravelly | raspy/grainy |
| 11. ringing, long decay | ringing/long decay |
| 12. sparkling, shimmering, brilliant, bright | sparkling/brilliant |
| 13. airy, breathy | airy/breathy |
| 14. resonant, vibrant | resonant/vibrant |
| 15. hollow | hollow |
| 16. woody | woody |
| 17. muted, veiled | muted/veiled |
| 18. sustained, even | sustained/even |
| 19. open | open |
| 20. focused, compact | focused/compact |
Reymore (2021) mapped the semantic characteristics of 34 Western musical instruments using this 20-dimensional model, producing "Timbre Trait Profiles" (TTPs) which summarize how each instrument is conceived to be characterized in this semantic space. Like the study by Reymore and Huron (2020) which built the model in Table 1, these ratings were made using imagined timbres with the goal of understanding instrument timbre prototypes for orchestral instruments. In these previous articles, I made the case that these profiles can be used as tools in timbre semantics and orchestration research. However, without information about timbral variation with respect to commonly manipulated factors, such as register and dynamics, these tools remain limited by their generality.
As described earlier, the project of understanding the relationship between timbre semantics and changes in musical parameters across musical instruments is enormous given the number of available instruments and their timbral flexibility. While some common trends are likely to exist for certain semantic dimensions, instrument families, or some combinations thereof, the complete picture is probably a highly complex one. This complexity is likely reflected in the general dearth of research in orchestration practice and the historical sentiment, as expressed by Rimsky-Korsakov, that orchestration "cannot be taught" (1913). The more trends that can be identified, the easier it will be to understand the complex picture of timbre semantics among orchestral instruments. As reviewed above, some data exist which consider timbre in relation to other musical parameters, but these studies have been primarily grounded in an acoustic, rather than a semantic perspective. Data that explicitly describe how instrumental semantics vary with factors such as pitch and register are needed to construct hypotheses and develop models.
Thus, the in-depth, exploratory studies of two instruments presented here serve four principal purposes. The data are first intended to serve as a foundation for the development of hypotheses that can be tested in future experiments. Second, the study design is offered as a template for easily replicating the methodology with other instruments and/or augmenting it in order to investigate other timbral variations relative to parameters including but not limited to articulation, duration, specific instruments or brands, and acoustic environments. This design could be used both in additional in-depth, exploratory studies, such as this one, or in wider studies intended to test hypotheses and/or models. Third, this study serves as an evaluation of Reymore and Huron's timbre qualia model: although Reymore (2021) offered evidence of the model's reliability across studies, both studies used imagined instrument sounds. Questions remain about whether ratings of recorded timbres are comparable to ratings of imagined timbres. The results of this study provide insight into these questions. Fourth, the detailed data reported in this paper for oboe and horn can be used for timbrally focused music theoretical analyses of solo pieces and may be informative for composition.
METHOD
Participants
Participants (n = 47; 29 F, 18 M) were music majors recruited from the Ohio State University School of Music participant pool. The average age was 19.6 years (range 18–21, SD = 1.6). Participants reported an average of 11.3 years of regular musical practice (range 3–19, SD = 3.6).
Design
Participants listened to two-second recordings of instruments playing sustained notes and were randomly assigned to rate either notes played on the oboe or notes played on the horn. Manipulated variables included pitch, register, and dynamic level; specifically, the stimuli for each instrument included four registers (Low, Middle 1, Middle 2, and High) represented by three chromatically neighboring pitches, and each of these 12 pitches were presented at three different dynamic levels (pianissimo, mezzo mezzo, and fortissimo), for a total of 36 stimuli per instrument. Participants listen to 18 of the 36 recorded notes in a random order and made ratings of the stimuli on 20 semantic scales from Reymore & Huron (2020; see Table 1). A priori, it was decided that for the purposes of analysis, values for each register would be represented by the mean ratings of the three pitches chosen to represent that register.
Materials
Stimuli were recorded by professional musicians for the purpose of the experiment. To address the issue of the tractability of the study, stimuli were limited to a representative sample of pitches and dynamics. One approach would be to sample single pitches from different registers at varying dynamics. However, using a single pitch risks interference due to idiosyncratic timbral variations among pitches. For example, C5 on the oboe is a notoriously difficult-to-control note because it exhibits a timbre that is relatively more unfocused and nasal than any of the other instrument's pitches, a result of the physics of the instrument. While well-designed instruments minimize this timbral difference and professionals can further temper the difference, anecdotally, a timbral uniqueness to C5 is still almost always perceptible to the trained ear and may even be able to aid in absolute pitch identification (Reymore & Hansen, 2020). Were C5 to be chosen as the single pitch representing the middle range of the oboe, it is likely that ratings of dimensions such as focused/compact and nasal/reedy would better characterize this single pitch than the middle range of the register, which is in general much more focused and less nasal than C5. While such note-to-note idiosyncrasies are quite familiar to the players of a given instrument, there is little empirical information about this source of variability, though a systematic report of idiosyncratic intonation tendencies can be found in Snow (2006). Likely, intonation and timbral idiosyncrasies are in many cases related—plausibly, pitches that tend to be sharp are also brighter and/or more nasal. It is probable that timbral idiosyncrasies, like intonational idiosyncrasies, are more prominent in certain instruments than others, most likely as a function of various aspects of the physics and acoustical properties of each instrument.
To mitigate the potential idiosyncratic effects of individual notes, three neighboring chromatic pitches were used to represent each register. The selection of neighboring pitches minimizes the potentially confounding effect of pitch height on timbre but provides a method in which each register is represented by multiple pitches. Pitches were selected through consultation with the professional players who recorded the stimuli. First, we determined the lowest and highest sets of three pitches that are both comfortable to play and are reasonably common in the repertoire. The other two pitch sets for both instruments were derived by dividing up the space between the high and low sets equally. A priori it was determined that these sets could be shifted up or down by half or whole step in order to avoid particularly idiosyncratic notes (like C5 on the oboe); decisions about shifting were made in consultation with the professional musicians. As a result, four sets of three pitches were recorded to represent the high, low, and middle registers of the instruments. See Appendix A for more detail on stimuli selection. Table 2 lists the pitches recorded for the oboe and the horn; these pitch samples are visualized in Figure 1.
| Register | French horn | Oboe |
|---|---|---|
| Low | B♭1, B1, C2 | C4, C#4, D4 |
| Middle 1 | B2, C3, C#3 | A4, B♭4, B4 |
| Middle 2 | B3, C4, C#4 | F5, F#5, G5 |
| High | C5, C#5, D5 | D6, E♭6, E6 |
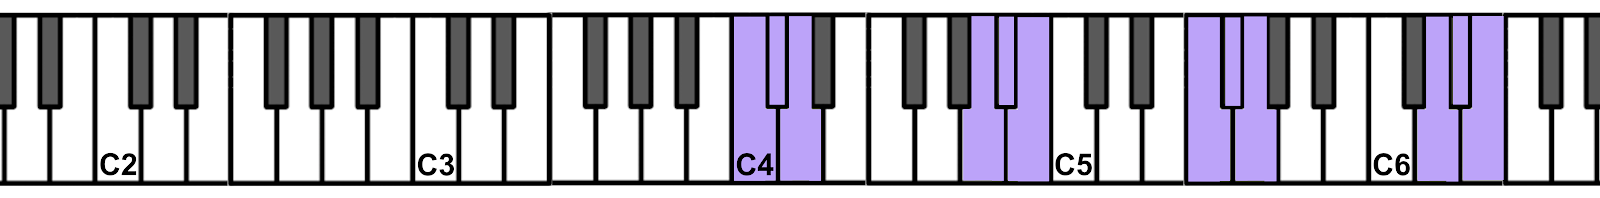
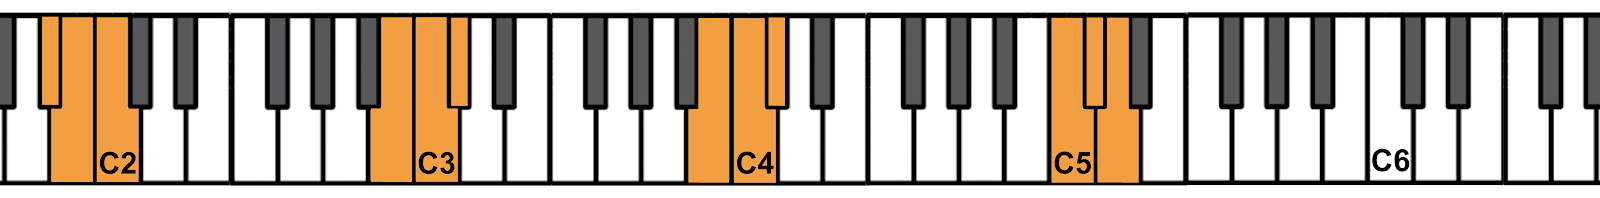
Figure 1. Piano keyboards illustrating pitch stimuli for the oboe (purple, top) and French horn (orange, bottom).
The professional musicians recording the stimuli were instructed to play each of the pitches at three different dynamic levels:
- Pianissimo. Play as piano as possible without sacrificing tone quality or intonation.
- "Mezzo mezzo." Play at a comfortable middle dynamic level for your instrument, between mezzo piano and mezzo forte. 2
- Fortissimo. Play as forte as possible without sacrificing tone quality or intonation.
The musicians recorded 36 notes for each instrument (4 registers * 3 pitches * 3 dynamics). While neither the oboe nor the horn has specifically defined registers in the way that the clarinet does, general descriptions of high, middle, and low registers are applicable; we can consider the lowest set of pitches to represent the instruments' low registers and the highest to represent their highest register. For the purposes of discussion, I refer to the four registers with relative names: Low, Middle 1, Middle 2, and High.
Procedure
The study was implemented as an Internet survey using the Qualtrics platform; participants were tested individually in an Industrial Acoustic Corporation sound attenuation room. Instructions are included in Appendix B. Participants listened to 36 two-second recordings of either the horn or the oboe playing sustained notes. After listening to each stimulus, for each of 20 timbre qualia dimensions, they rated how well the dimension applied to each note on a scale from 1 to 7 where 1 was labeled as "does not describe at all" and 7 was labeled as "describes extremely well." Note that while shorthand terms (Table 1, column 2) are used throughout his paper for ease of discussion, participants were presented with the full semantic descriptions during the experiments (Table 1, column 1). Participants were able to listen to each sound as many times as they felt was necessary. In piloting the experiment, it was determined that rating all 36 pitches for a single instrument took about an hour. As the task is a particularly repetitive one and attention was a concern, the experiment length was reduced so that each participant would rate a subset of 18 pitches for one of the two instruments, which took about a half hour.
RESULTS
With 47 participants each rating one half of the stimuli for a single instrument, 11–12 judgments were collected for each individual stimulus. Because each register is represented by three pitches, each register/dynamic combination is thus represented by 33–36 judgments.
Examining the rating means across dimensions on a note-by-note basis—that is, for each pitch-dynamic combination—reveals some idiosyncratic notes. For example, at times, rating means on a given dimension vary more from pitch to pitch than between registers (see Discussion for more detail), suggesting that the practice of representing registers with multiple notes in order to help mitigate idiosyncrasies and better represent the register as a whole was useful. Individual note means are included in Appendix C.
Here, results are first summarized for the oboe and then the horn: the top descriptors for each register-dynamic combination are reported and trends across dynamics and registers are illustrated with graphs. The underlying structure of the rating data for each instrument is considered separately through Exploratory Factor Analysis (EFA). Next, the data are modeled using both partial proportional odds regression and random forest classifiers. Finally, to address the question of the comparability of semantic judgements of imagined prototypical instrument timbres and recorded tones, results from the current experiment are compared to ratings from Reymore (2021), which were based on imagined timbres.
Oboe
The top-rated dimensions for all pitches at all dynamics on the oboe—comprising its aggregate average profile—are nasal/reedy (4.57), sustained/even (4.42), resonant/vibrant (4.22), focused/compact (4.11), pure/clear (4.07), and open (3.95). Tables 3 summarizes the top six descriptors for each pitch register combination. The dimensions that are not included in the top six descriptors in the instrument's aggregated average profile are bolded in order to highlight which features are relatively unique to certain registers, dynamics, or register-dynamic combinations. For example, oboe notes are perceived as relatively more strongly sparkling/brilliant in the Middle 2 and High registers, while woody only appears in Low and Middle 1 registers as a top descriptor. The soft/singing quale is associated relatively more with softer and middle dynamic notes in middle registers.
| Oboe | |||||
|---|---|---|---|---|---|
| Low (C4, C#4, D4) | |||||
| Pianissimo | Mezzo mezzo | Fortissimo | |||
| woody | 4.44 | sustained/even | 4.87 | nasal/reedy | 4.86 |
| sustained/even | 4.31 | nasal/reedy | 4.46 | sustained/even | 4.84 |
| focused/compact | 4.08 | woody | 4.39 | resonant/vibrant | 4.36 |
| nasal/reedy | 4.07 | focused/compact | 4.24 | direct/loud | 4.35 |
| pure/clear | 3.92 | resonant/vibrant | 4.22 | focused/compact | 4.20 |
| soft/singing | 3.82 | pure/clear | 4.13 | open | 4.20 |
| Middle 1 (A4, B♭4, B4) | |||||
| Pianissimo | Mezzo mezzo | Fortissimo | |||
| soft/singing | 5.08 | soft/singing | 5.00 | resonant/vibrant | 4.88 |
| sustained/even | 4.62 | sustained/even | 4.74 | nasal/reedy | 4.71 |
| resonant/vibrant | 4.42 | resonant/vibrant | 4.73 | sustained/even | 4.43 |
| focused/compact | 4.26 | pure/clear | 4.69 | focused/compact | 4.37 |
| nasal/reedy | 4.04 | open | 4.47 | pure/clear | 4.18 |
| airy/breathy | 4.03 | woody | 4.30 | sparkling/brilliant | 4.14 |
| Middle 2 (F5, F#5, G5) | |||||
| Pianissimo | Mezzo mezzo | Fortissimo | |||
| soft/singing | 5.10 | soft/singing | 4.90 | nasal/reedy | 5.02 |
| airy/breathy | 4.49 | resonant/vibrant | 4.75 | sustained/even | 4.59 |
| sustained/even | 4.34 | pure/clear | 4.64 | pure/clear | 4.51 |
| open | 4.13 | sparkling/brilliant | 4.62 | resonant/vibrant | 4.49 |
| nasal/reedy | 4.04 | open | 4.51 | open | 4.44 |
| sparkling/brilliant | 3.95 | focused/compact | 4.49 | sparkling/brilliant | 4.26 |
| High (D6, E♭6, E6) | |||||
| Pianissimo | Mezzo mezzo | Fortissimo | |||
| airy/breathy | 5.99 | shrill/noisy | 5.50 | shrill/noisy | 5.82 |
| nasal/reedy | 5.78 | nasal/reedy | 5.04 | nasal/reedy | 5.26 |
| shrill/noisy | 4.87 | sparkling/brilliant | 4.90 | sparkling/brilliant | 5.12 |
| hollow | 4.61 | focused/compact | 4.39 | focused/compact | 5.10 |
| sparkling/brilliant | 3.67 | resonant/vibrant | 4.26 | direct/loud | 4.93 |
| raspy/grainy | 3.12 | direct/loud | 4.17 | resonant/vibrant | 4.75 |
Complete visualizations of differences in qualia profile for each register-dynamic combination are visualized in Appendix E, using the radar plot Timbre Trait Profile format from Reymore (2021).
Means on each dimension as grouped by register and dynamics for the oboe are visualized in Figures 2 and 3. In these figures, the reported mean for each register is the average of the means of the three notes in each register set. Error bars illustrate the 95% confidence intervals. Figure 2 reports register on the x-axis, with shape/color of the points indicating dynamics. Figure 3 presents the same data, but with dynamics on the x-axis and register indicated by shape/color. Numerical data related to these figures can be found in Appendix D.
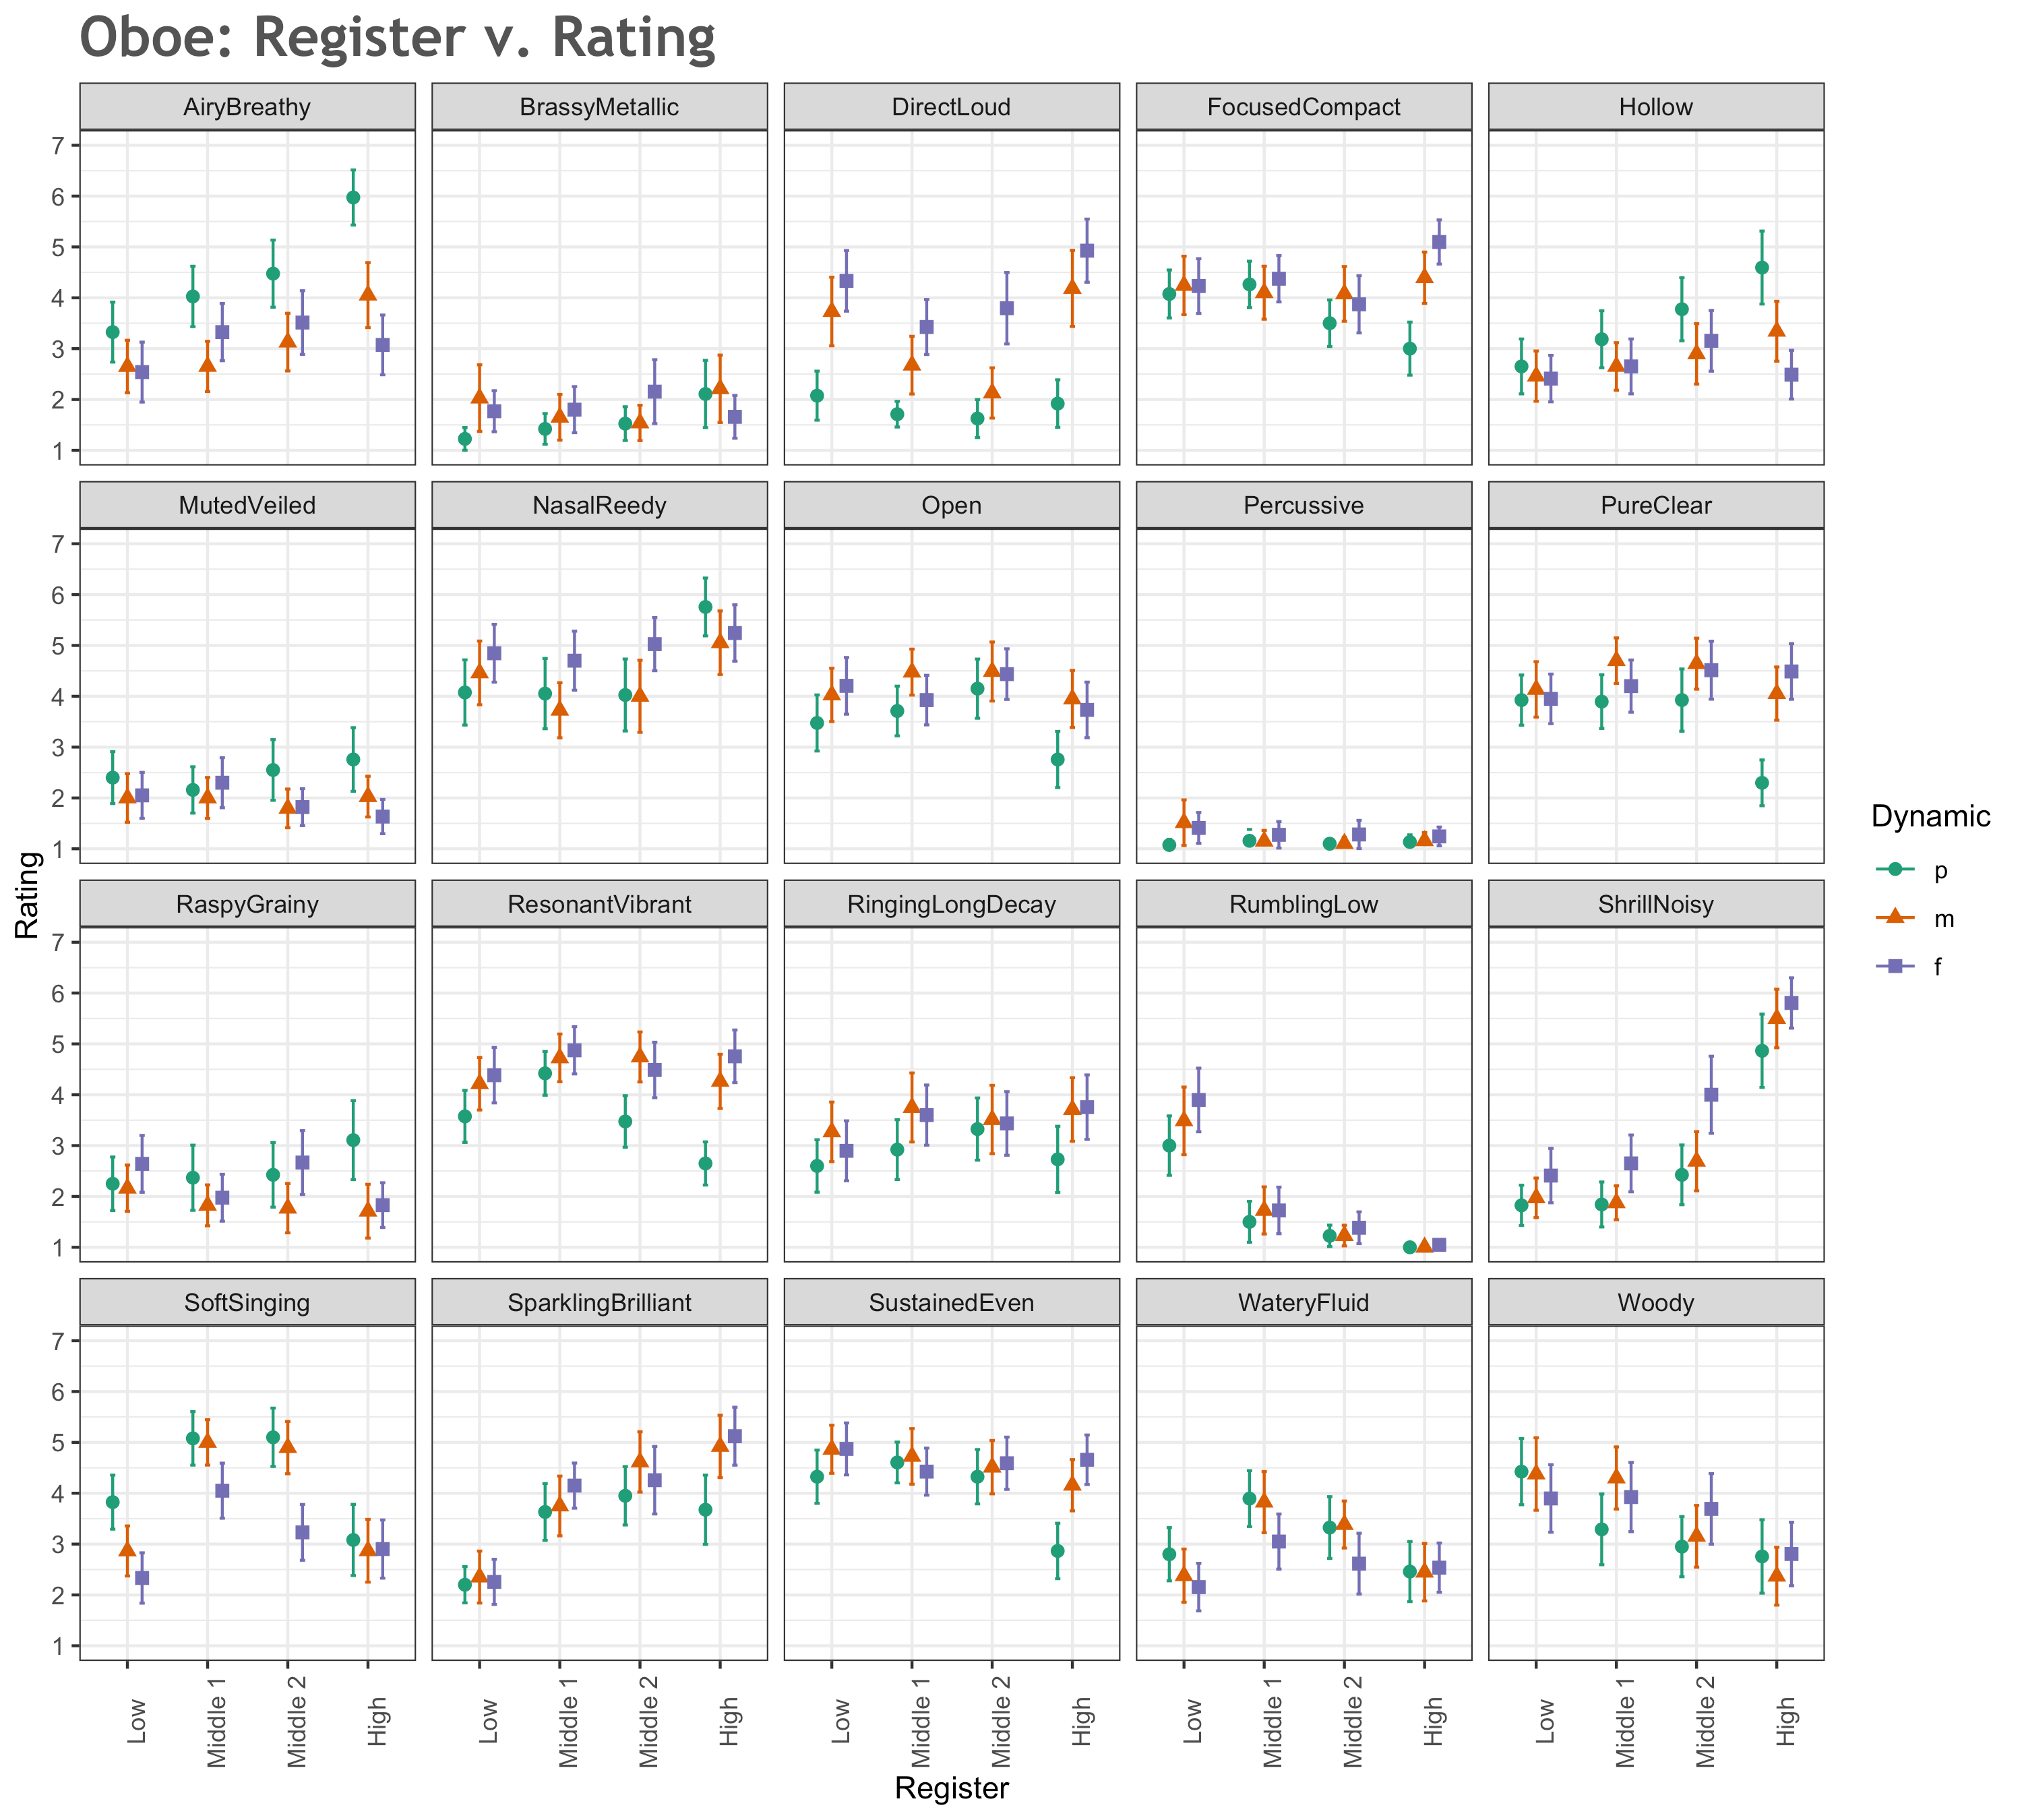
Figure 2. Qualia variation by register, oboe.
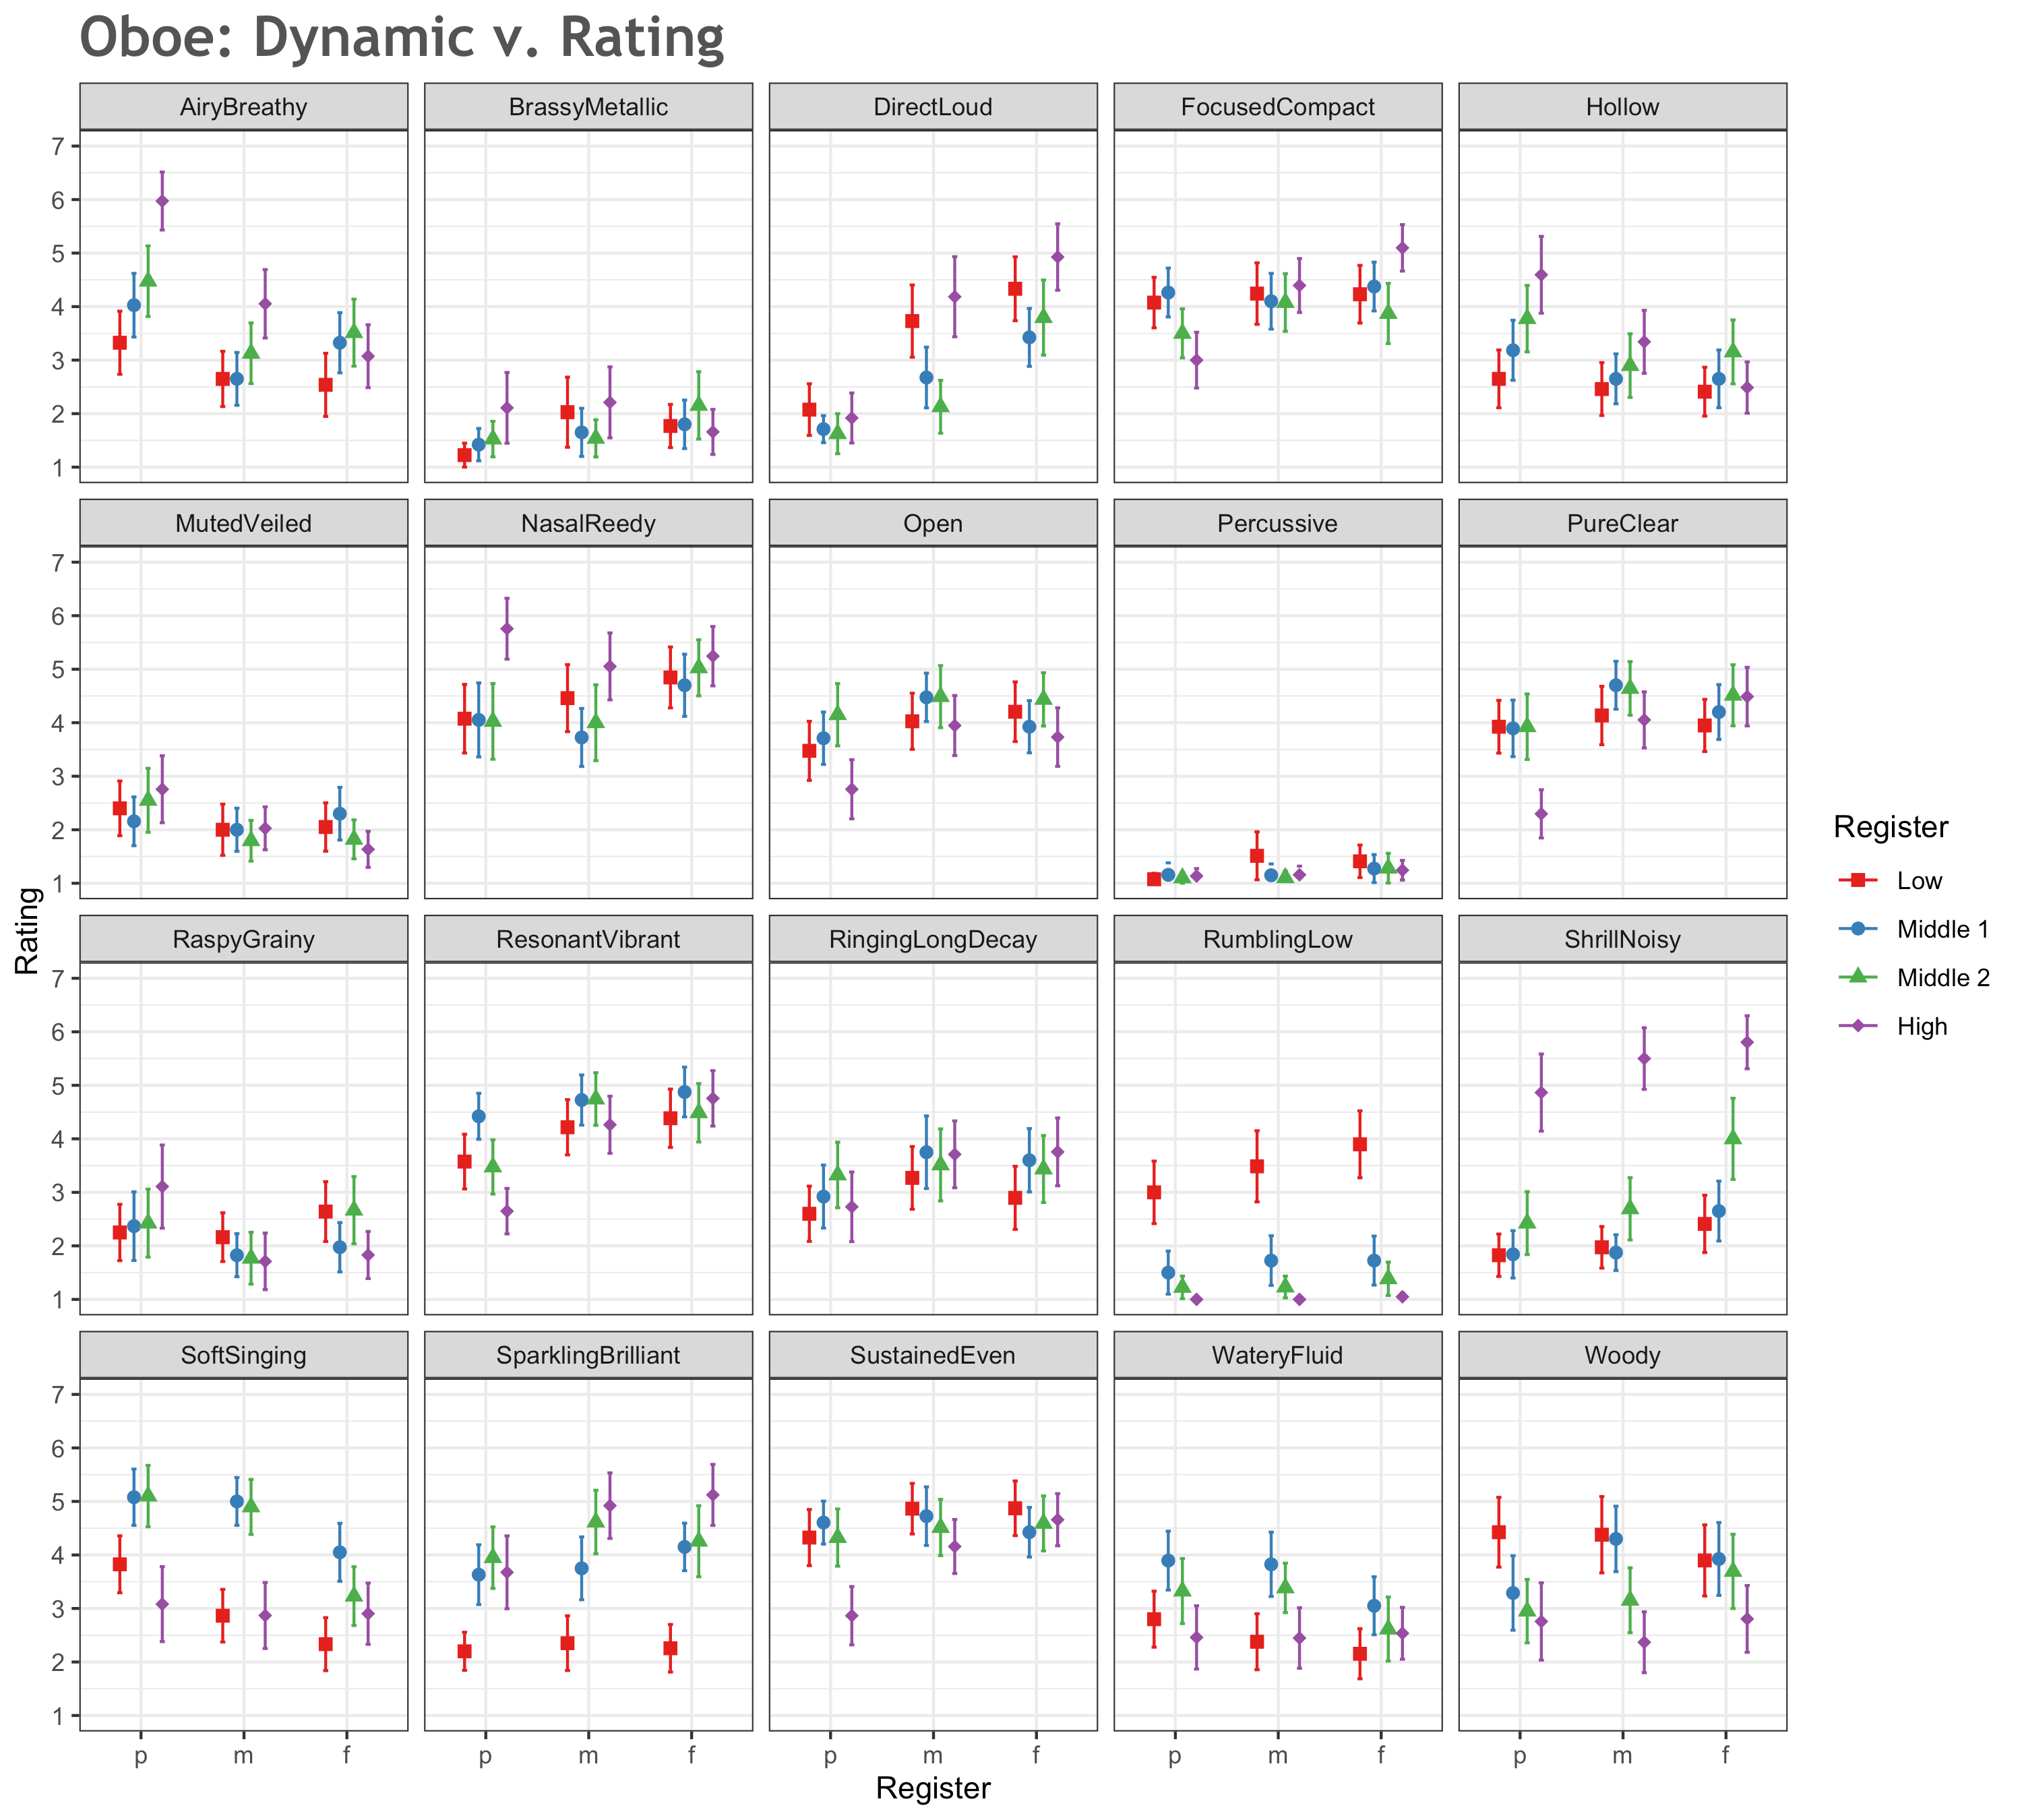
Figure 3. Qualia variation by dynamic, oboe.
Horn
The top-rated dimensions for all pitches at all dynamics on the horn (aggregate average profile) are brassy/metallic (5.21), direct/loud (3.95), rumbling/low (3.81), nasal/reedy (3.76), raspy/grainy (3.65), and sustained/even (3.60). Table 4 summarizes the top six descriptors for each register/dynamic combination. As before, dimensions that are not included in the top six descriptors in the instrument's aggregated average profile are bolded in order to highlight which features are relatively unique to certain registers, dynamics, or register/dynamic combinations. For example, horn notes were rated as relatively more strongly shrill/noisy at a forte dynamic across ranges; this descriptor does not appear in the top six for piano or mezzo dynamics. Pure/clear characterizes the Middle 2 and High registers at piano and mezzo dynamics.
| Horn | |||||
|---|---|---|---|---|---|
| Low (B♭1, B1, C2) | |||||
| Pianissimo | Mezzo mezzo | Fortissimo | |||
| rumbling/low | 6.11 | rumbling/low | 6.40 | rumbling/low | 6.50 |
| brassy/metallic | 4.95 | raspy/grainy | 5.30 | raspy/grainy | 6.04 |
| raspy/grainy | 4.60 | brassy/metallic | 4.68 | brassy/metallic | 5.72 |
| nasal/reedy | 3.61 | direct/loud | 4.07 | direct/loud | 5.71 |
| hollow | 3.37 | hollow | 3.82 | shrill/noisy | 4.03 |
| airy/breathy | 3.37 | nasal/reedy | 3.76 | nasal/reedy | 3.46 |
| Middle 1 (B2, C3, C#3) | |||||
| Pianissimo | Mezzo mezzo | Fortissimo | |||
| brassy/metallic | 4.63 | brassy/metallic | 4.96 | brassy/metallic | 5.92 |
| sustained/even | 3.95 | rumbling/low | 4.51 | rumbling/low | 5.01 |
| resonant/vibrant | 3.76 | nasal/reedy | 3.80 | direct/loud | 4.60 |
| soft/singing | 3.70 | direct/loud | 3.72 | raspy/grainy | 4.27 |
| hollow | 3.67 | raspy/grainy | 3.64 | nasal/reedy | 3.66 |
| muted/veiled | 3.52 | open | 3.52 | shrill/noisy | 3.53 |
| Middle 2 (B3, C4, C#4) | |||||
| Pianissimo | Mezzo mezzo | Fortissimo | |||
| soft/singing | 4.41 | brassy/metallic | 5.03 | brassy/metallic | 6.15 |
| brassy/metallic | 4.08 | sustained/even | 4.88 | direct/loud | 5.84 |
| pure/clear | 4.08 | pure/clear | 4.70 | shrill/noisy | 5.52 |
| ringing/long | 3.95 | focused/compact | 4.27 | nasal/reedy | 5.04 |
| sustained/even | 3.90 | resonant/vibrant | 4.15 | raspy/grainy | 4.44 |
| resonant/vibrant | 3.75 | open | 3.91 | open | 3.72 |
| High (C5, C#5, D5) | |||||
| Pianissimo | Mezzo Mezzo | Fortissimo | |||
| brassy/metallic | 4.48 | brassy/metallic | 5.45 | direct/loud | 6.52 |
| soft/singing | 4.41 | direct/loud | 5.12 | brassy/metallic | 6.48 |
| nasal/reedy | 4.39 | sustained/even | 4.67 | shrill/noisy | 6.17 |
| muted/veiled | 4.16 | pure/clear | 4.39 | nasal/reedy | 5.13 |
| sustained/even | 3.91 | sparkling/brilliant | 4.36 | sparkling/brilliant | 3.84 |
| pure/clear | 3.74 | open | 4.33 | sustained/even | 3.83 |
Each register/dynamic combination is visualized via radar plot in Appendix E.
Figures 4 and 5 demonstrate the rating means on each dimension for the horn. As with the oboe data reported earlier, Figure 4 provides register on the x-axis, while Figure 5 presents the same data with dynamics on the x-axis. Numerical data can be found in Appendix D.
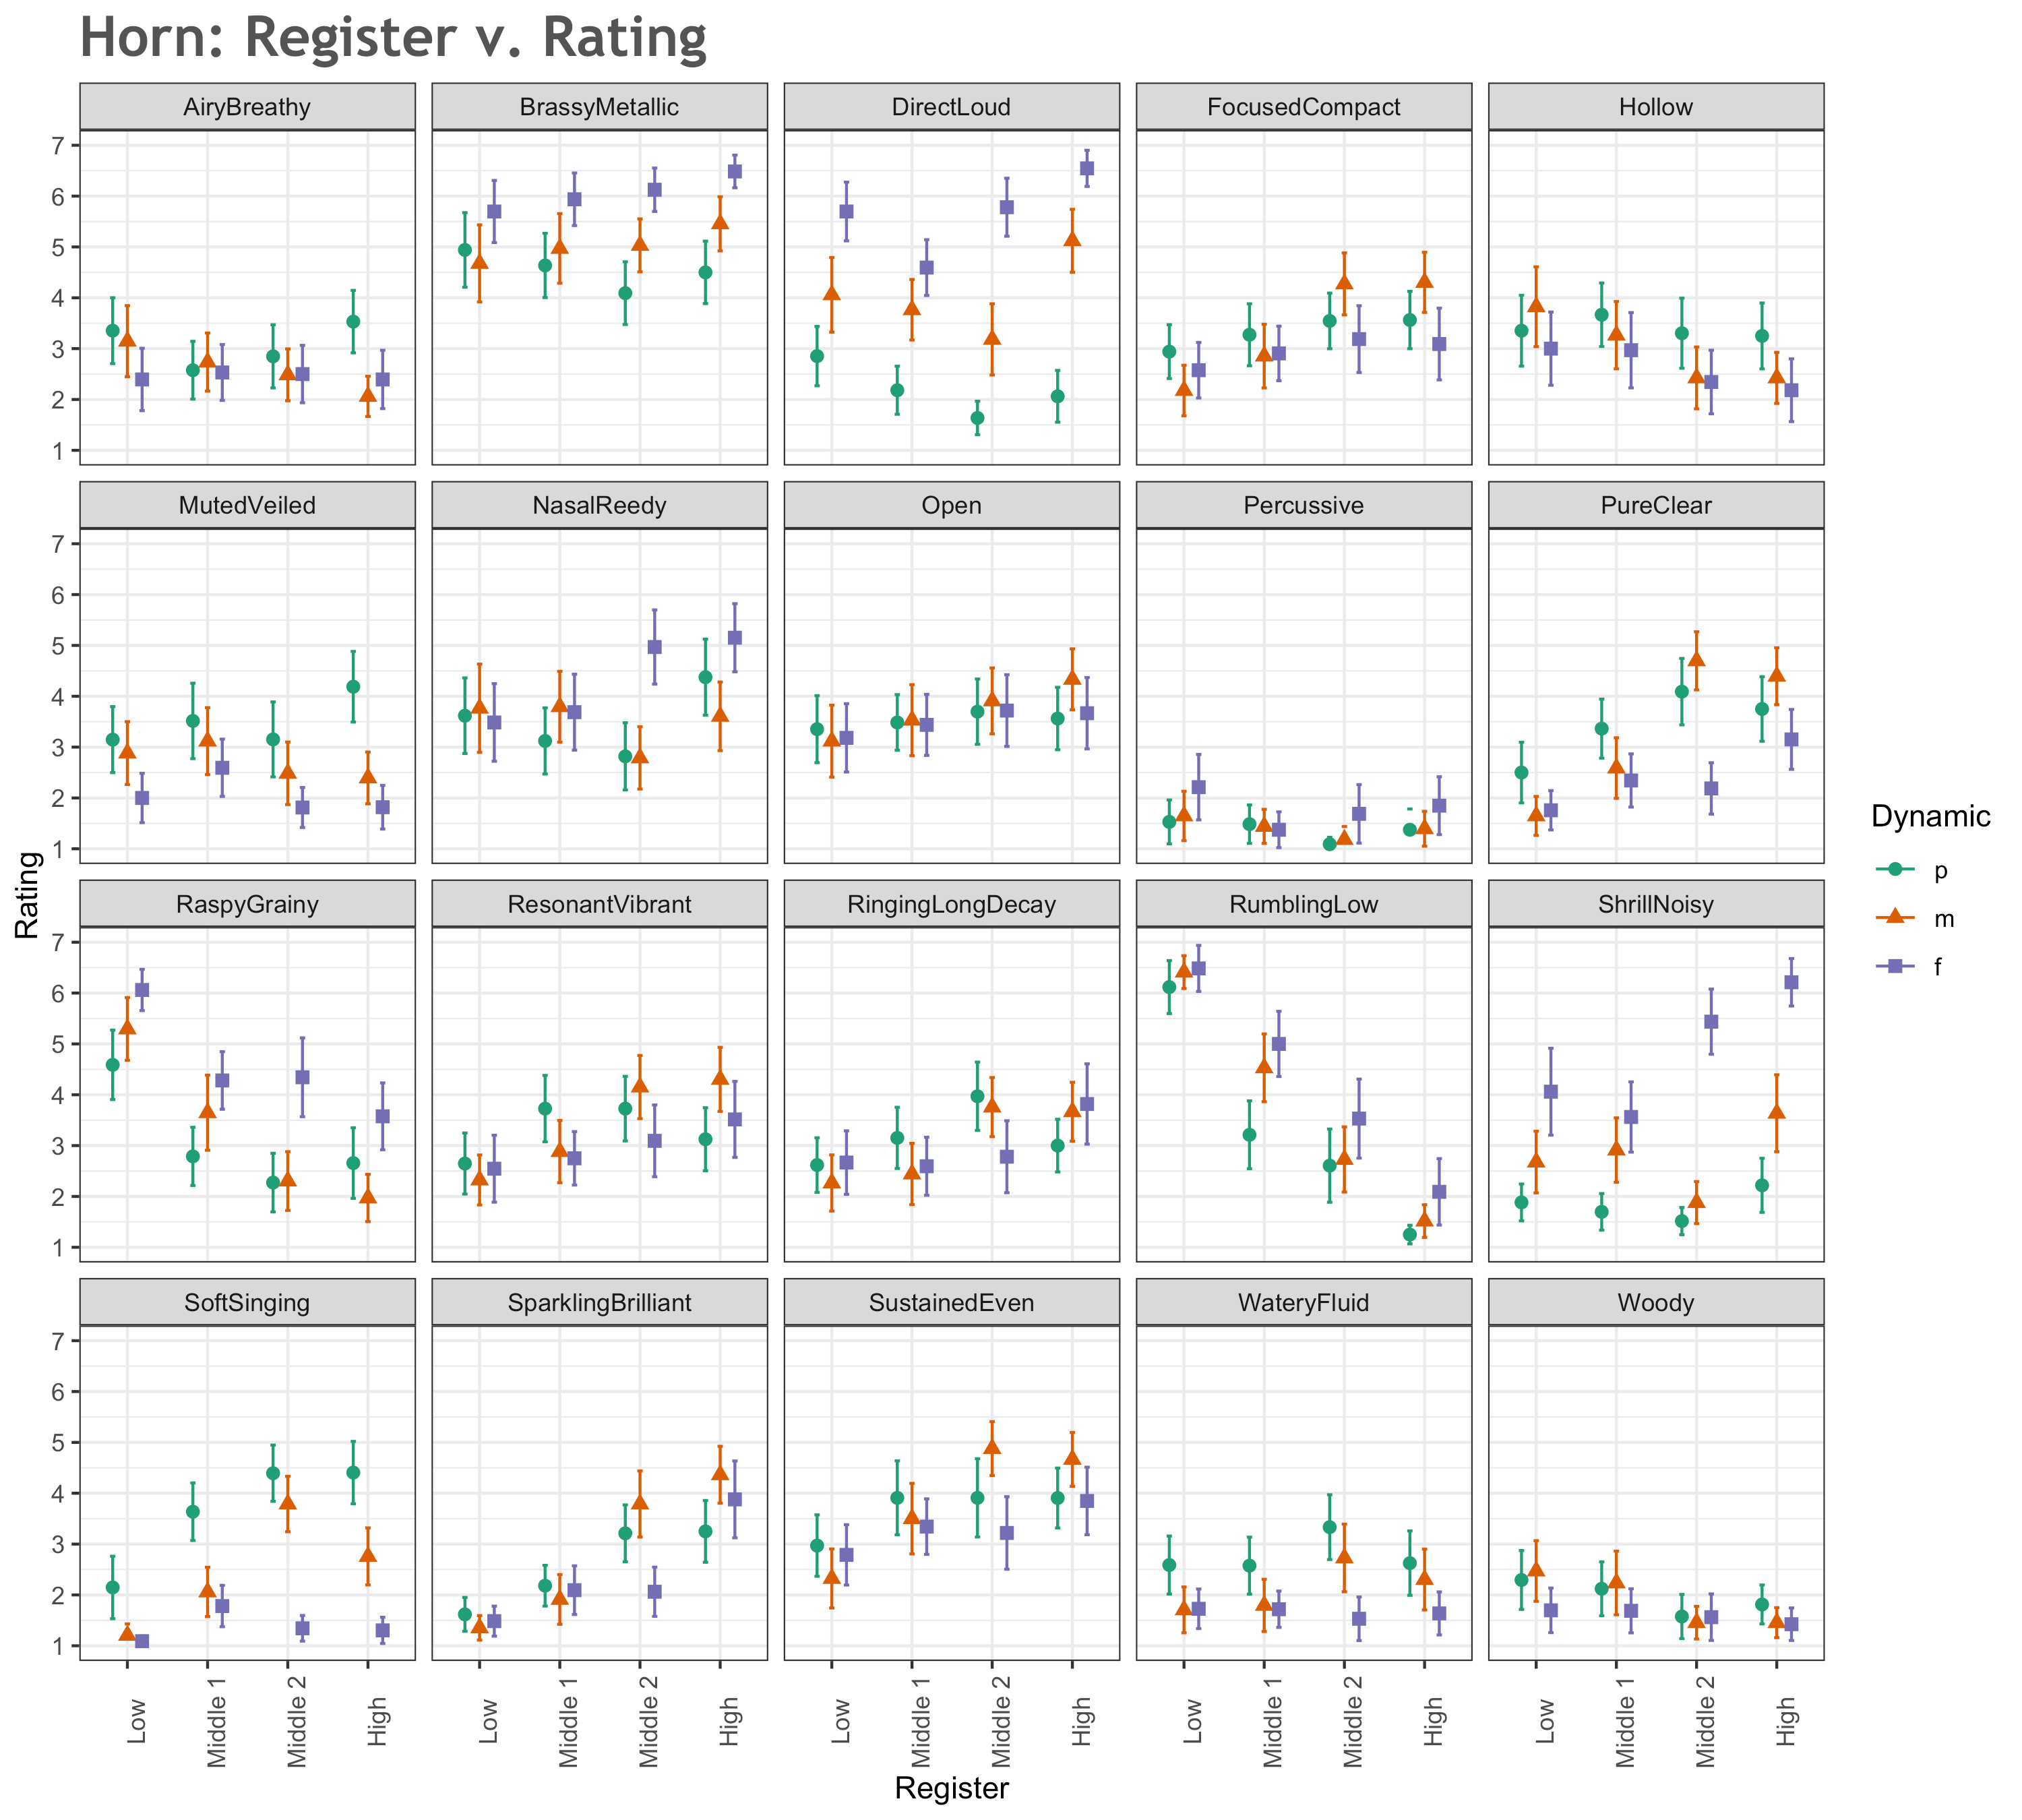
Figure 4. Qualia variation by register, French horn
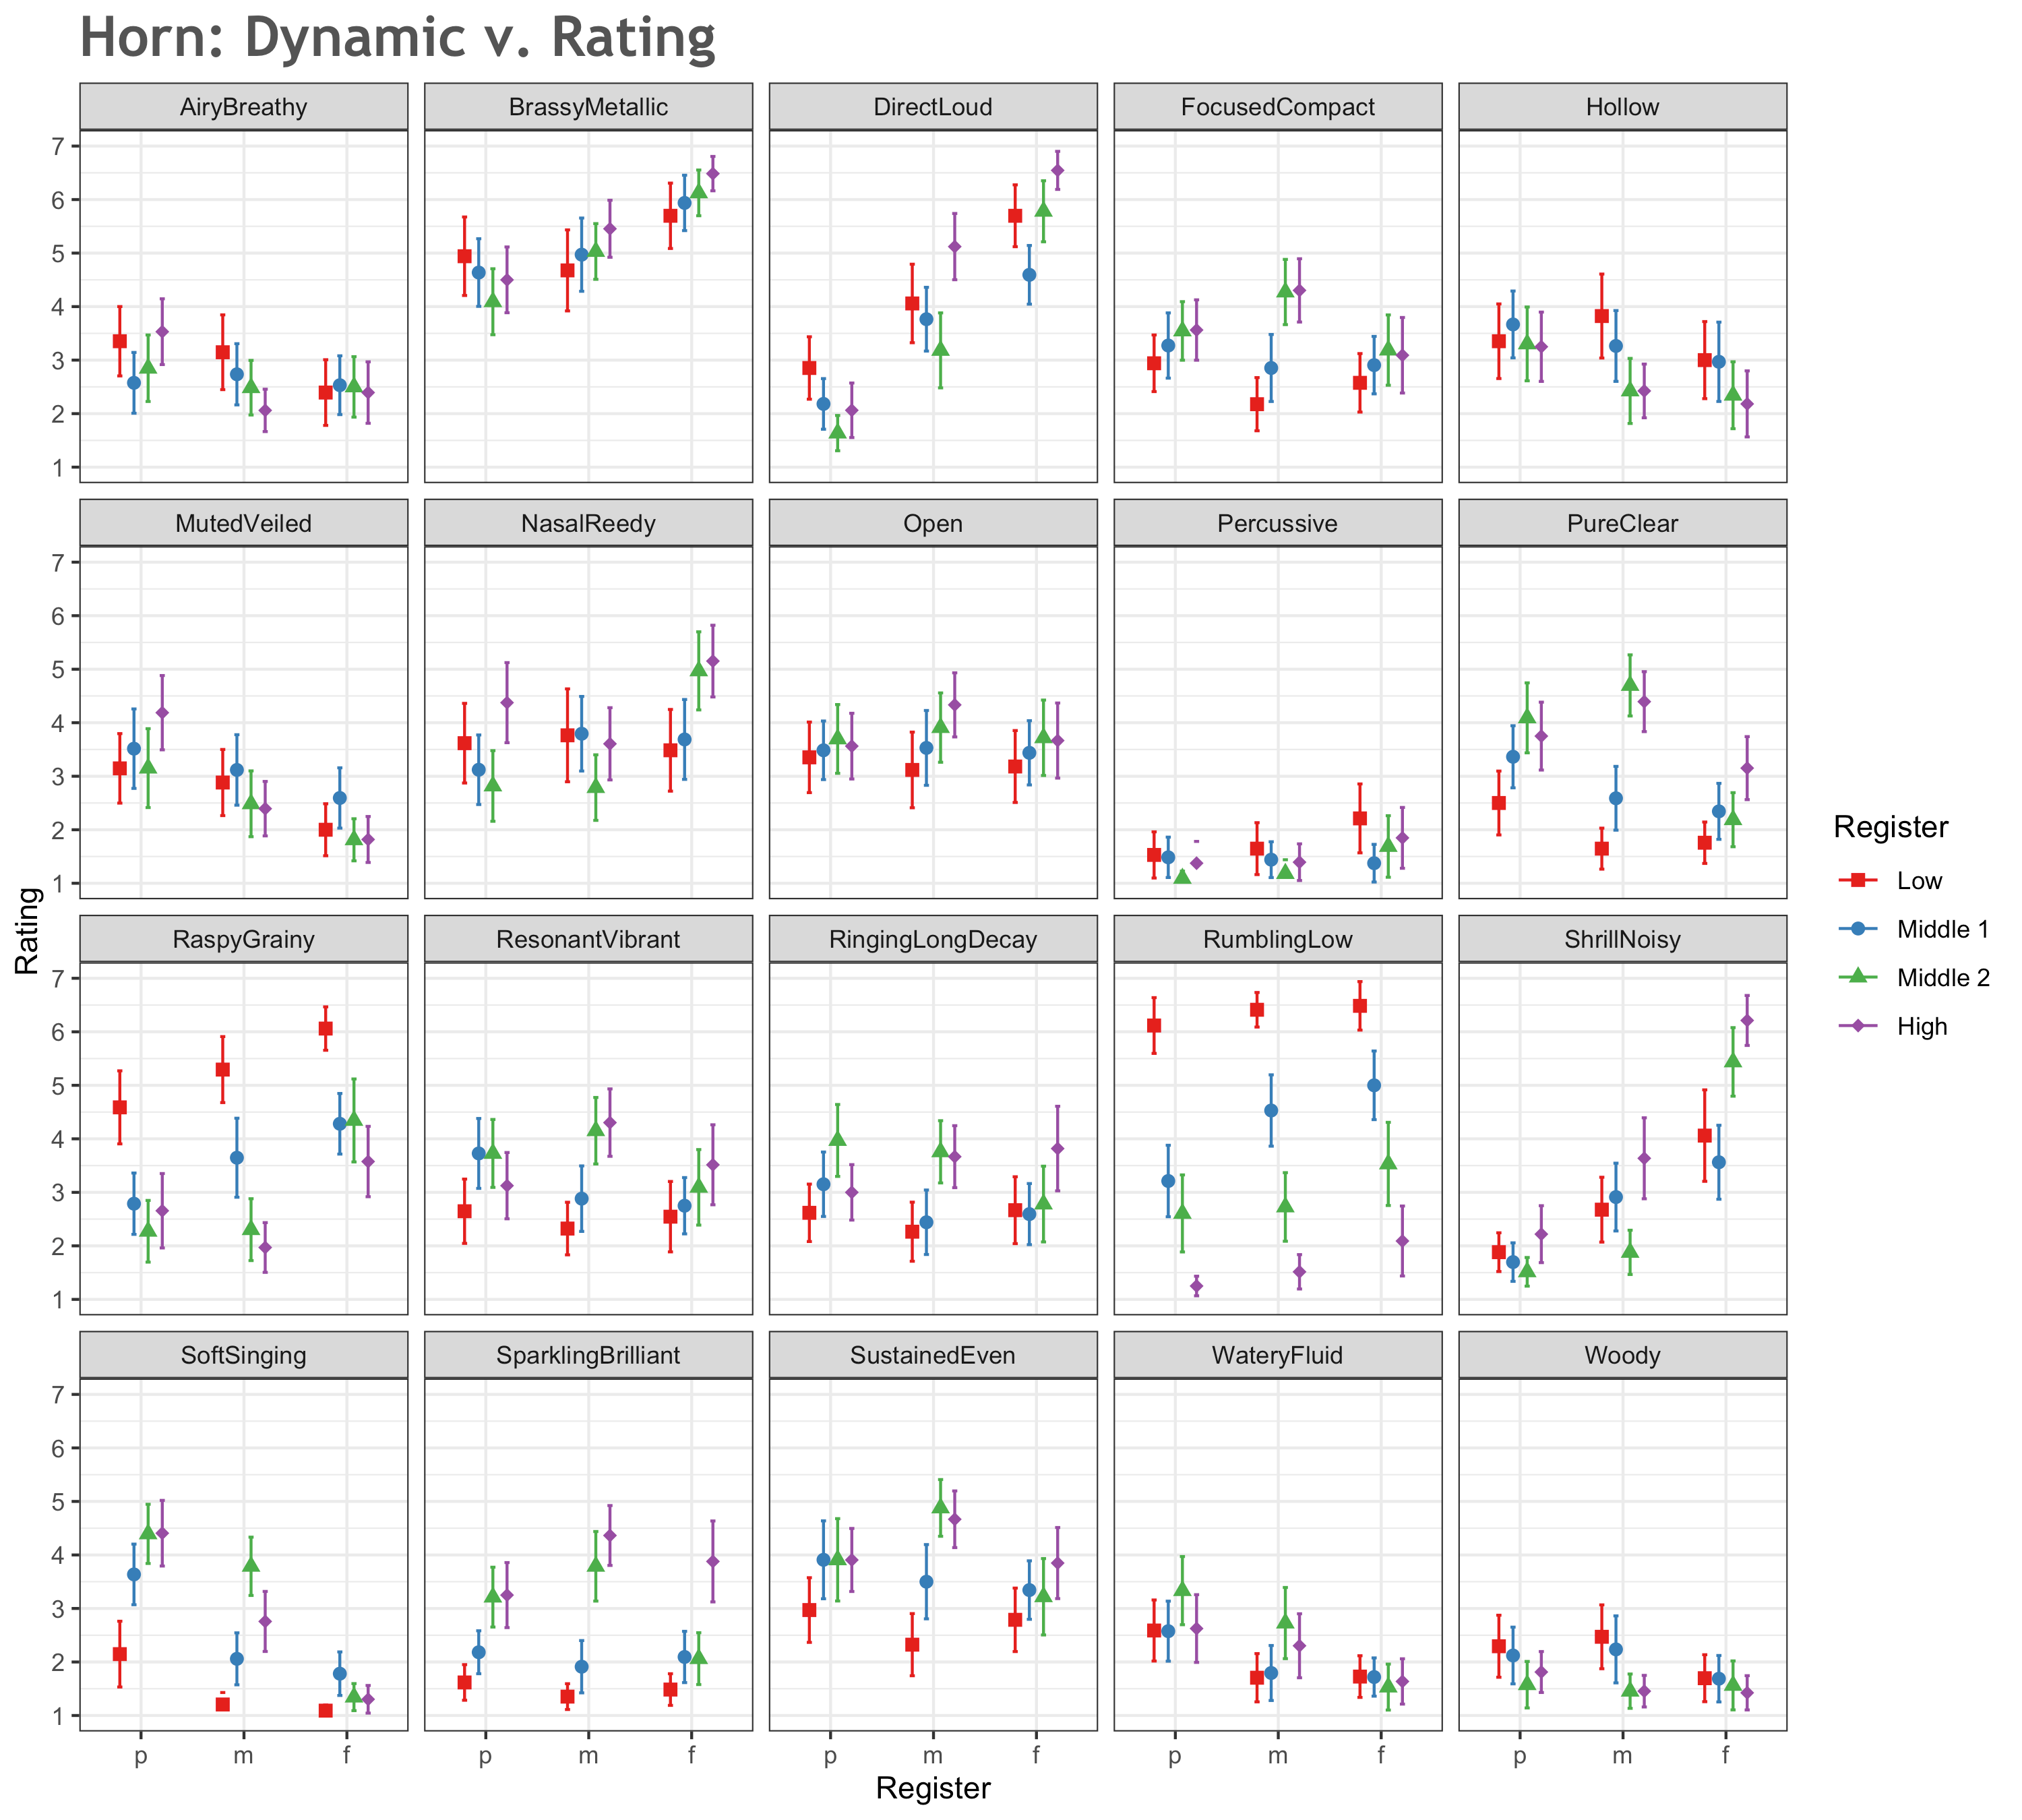
Figure 5. Qualia variation by register, French horn.
ANALYSIS
First, the latent structure of the rating data is explored through Exploratory Factor Analyses (EFA). Secondly, two types of exploratory models are presented in order to determine which semantic dimensions may be significantly related to register and/or dynamics in the oboe and horn and to assess relative importance of semantic dimensions. Finally, results are compared with ratings from Reymore (2021) to assess potential differences in the timbre qualia model's applications to imagined and recorded sounds.
Factor Analyses
Previous work engaging the 20-dimensional timbre qualia model has reported a number of analyses concerning the structure of rating data. Reymore and Huron (2020) originally derived the model using Principal Component Analysis (PCA) and other techniques from ratings on 77 categories. PCA explained 72% of the variance with 20 components, while smaller models with 3–5 components, comparable to the size of models proposed in previous literature, explained only 39–50% of the variance. The data in that study were thoroughly examined for optimal dimension reduction—details about the PCA and the rationale for choosing a 20-dimensional model are included in the paper and its Supplementary Materials. The dimensionality of the model was further assessed in Reymore (2021), using a different rating dataset, in three ways: with respect to the correlation matrix, the relative usefulness of descriptors, and Principal Component Analysis. No recommendations were made for dimension reduction on these bases. This paper also presented analyses suggesting the model to be reliable across studies for generating ratings of imagined musical instrument sounds.
Analyses reported in these papers, along with other unpublished analyses of additional datasets using the model, suggest that the underlying structure of rating data may vary with different sets of rated instruments. That is, while 20 dimensions are needed to capture reasonable variance for the entire set of Western orchestral instruments (as in Reymore, 2021), it may be the case that certain dimensions could be highly correlated among subsets of instruments. Were this the case, we might observe variation in latent structure among ratings for different instrument subsets. By extension, this may also be the case for within-instrument semantic variation, and techniques such as EFA thus may help us to better understand the semantic structure of individual instruments with respect, in this case, to register and dynamics. This possibility was addressed with the current dataset.
For both oboe and horn data, the Kaiser-Meyer-Olkin (KMO) statistic was > .75, and Bartlett's test of sphericity was significant, suggesting that EFA was appropriate. In choosing a number of factors, I considered various rules of thumb, including the eigenvalues, scree plot, and percent of variance explained (Jolliffe, 2002); as in Reymore and Huron (2020), I preferred to err on the side of "too many" rather than "too few" factors and considered the relative interpretability of the potential models. With both sets of data, while the eigenvalue > 1 guideline suggested a 4-factor model, the resulting scree plots did not demonstrate clear elbows, suggesting five, or possibly more, factors. In the case of the oboe ratings, four factors explained 69% of the variance, whereas five factors explained 76%. Within the horn ratings, four factors explained 75% of the variance, while five explained 81%. I determined from a comparative examination of 4- and 5-factor models for both instruments that 5-factor models were substantially more clearly interpretable. Taking into account both the interpretability and the 6–7% increase in variance explained with the addition of a fifth factor, I chose to report the 5-factor models here.
As summarized below in Table 5, factors in both models were named using up to three of the highest loading descriptors greater than .5; in cases where only two descriptors loaded greater than .5, only two descriptors were used to name the factor. The full models with complete loadings are reported in Appendix F.
| Oboe | Horn | |||
|---|---|---|---|---|
| Semantic Description | Loading | Semantic Description | Loading | |
| Factor 1 | sustained/even | .75 | sustained/even | .82 |
| resonant/vibrant | .66 | resonant/vibrant | .80 | |
| pure/clear | .63 | open | .68 | |
| Factor 2 | airy/breathy | .70 | direct/loud | .68 |
| nasal/reedy | .66 | nasal/reedy | .60 | |
| shrill/noisy | .58 | |||
| Factor 3 | soft/singing | .71 | muted/veiled | .76 |
| direct/loud | -.55 | airy/breathy | .68 | |
| watery/fluid | .52 | hollow | .61 | |
| Factor 4 | low/rumbling | .63 | low/rumbling | .77 |
| woody | .54 | raspy/grainy | .52 | |
| Factor 5 | percussive | .82 | woody | .61 |
| brassy | .61 | brassy | -.59 | |
Although the two 5-factor models demonstrate some close similarities, it is evident that the latent structure differs: that is, between the two instruments, relationships among some of the dimensions differ. Factor 1 is highly similar between the two instruments. Factor 4, for both, is primarily driven by rumbling/low, but for the oboe is also influenced by woody, while the horn sees a secondary influence of raspy/grainy. Factor 5 in both models seems motivated by material; however, as one instrument is a woodwind and the other a brass instrument, the dimensions that load onto this factor vary. Factors 2 and 3 also reveal how the structures of the ratings differ from oboe to horn; for example, direct/loud and nasal/reedy load together for the horn, but not for the oboe, and airy/breathy and nasal/reedy load together for the oboe, but not for the horn, suggesting different relationships between these dimensions for each instrument. These differences are further illustrated in the exploratory models reported in the next section.
Exploratory Modeling
In order to understand which descriptors may be significant and most relevant to changes in register and dynamics—and to lay the groundwork for hypothesis testing in future experiments—two approaches were taken toward post hoc exploratory modeling of the data. Partial proportional odds (ordinal) regression models were used to suggest which descriptors may have significant relationships with dynamics and register. Additionally, random forest classifiers were used to obtain a measure of relative variable importance for the descriptors that can be compared across instruments and parameters.
Partial Proportional Odds Regression
Four partial proportional odds regression models (oboe/dynamics, horn/dynamics, oboe/register, and horn/register) were built using the ordinal package (Christensen, 2019) in R (R Core Team, 2020; version 4.0.0). The 20 semantic ratings were used to predict either the dynamic or the register of the stimuli. Note that while the causal relationship clearly runs in the opposite direction, such models allow us to identify which semantic ratings bear significant relations to dynamics/register. Because of the observable differences in results as seen in Figures 2–5 above, two separate models were constructed for oboe and two for horn, predicting register and dynamics from semantic ratings. Given the exploratory nature of the models and relatively small sample size, it was decided a priori not to make corrections for multiple tests.
All variable inflation factors (VIF) were less than 3, which did not suggest issues with multicollinearity. The Brant test (function brant, MASS package; Venables & Ripley, 2002) was used to test the parallel regression assumption. Violations of this assumption were observed in each of the four models among different subsets of descriptors. Consequently, I used the clmm2 function in the ordinal package to build partial proportional odds regression models in which variables satisfying the Brant test were specified as having ordinal effects, while those that did not were specified as having nominal effects. In the case of nominal effects, the function assessed significance between pairs of semantically adjacent levels (e.g., for dynamics, pairs included p-m and m-f). Because each participant rated multiple stimuli (repeated measures), the models also included a random intercept for participant.
For the oboe, significant (p < .05) semantic descriptors predicting dynamics included airy/breathy, direct/loud, hollow, resonant/vibrant, soft/singing, sustained/even, and woody. For horn dynamics, significant descriptors included direct/loud, muted/veiled, shrill/harsh/noisy, soft/singing, and watery/fluid. For the oboe, significant descriptors related to register included muted/veiled, nasal/reedy, open, raspy/grainy, resonant/vibrant, rumbling/low, shrill/harsh/noisy, soft/singing, sparkling/brilliant, and woody. For horn register, significant descriptors for register included direct/loud, nasal/reedy, open, raspy/grainy, resonant/vibrant, rumbling/low, shrill/noisy, sparkling/brilliant, and watery/fluid. Tables 6–9 below summarizes the results of the four models with respect to the significant semantic descriptors. The full models can be found in Appendix G.
Random Forest Classification
The data were also modeled via random forest classifiers using the caret package (Kuhn, 2020). This modeling process produces a measure of relative variable importance that is helpful in assessing the findings. Performance was measured from 5-fold cross-validation, where the data were split into five folds and each fold served in turn as the testing set for the model trained on the other 80% of the data. Thus, accuracy and kappa values reported here are averaged across all five folds of the cross-validation for each of the four types of models. The models were trained using the train function with method set to "rf," where the control parameter included 5-fold cross-validation.
For the dynamics models, where chance classification is at 33.3%, the oboe model's accuracy was 52.8%, κ = .29, while the horn's accuracy was 62.3%, κ = .44. For the register models, where chance classification is at 25%, the oboe model's accuracy was 62.2%, κ = .50, while the horn model's accuracy was 58.3%, κ = .44. The confusion matrices suggest that the middle registers of both instruments were most problematic to identify and were often confused; similarly, the mezzo mezzo dynamic was consistently misclassified more often than the fortissimo or pianissimo dynamics. Relative variable importance is illustrated in Figure 6 and reported quantitatively in Tables 6–9; relative variable importance measures are taken from each model trained on the entire data set using 5-fold cross-validation.
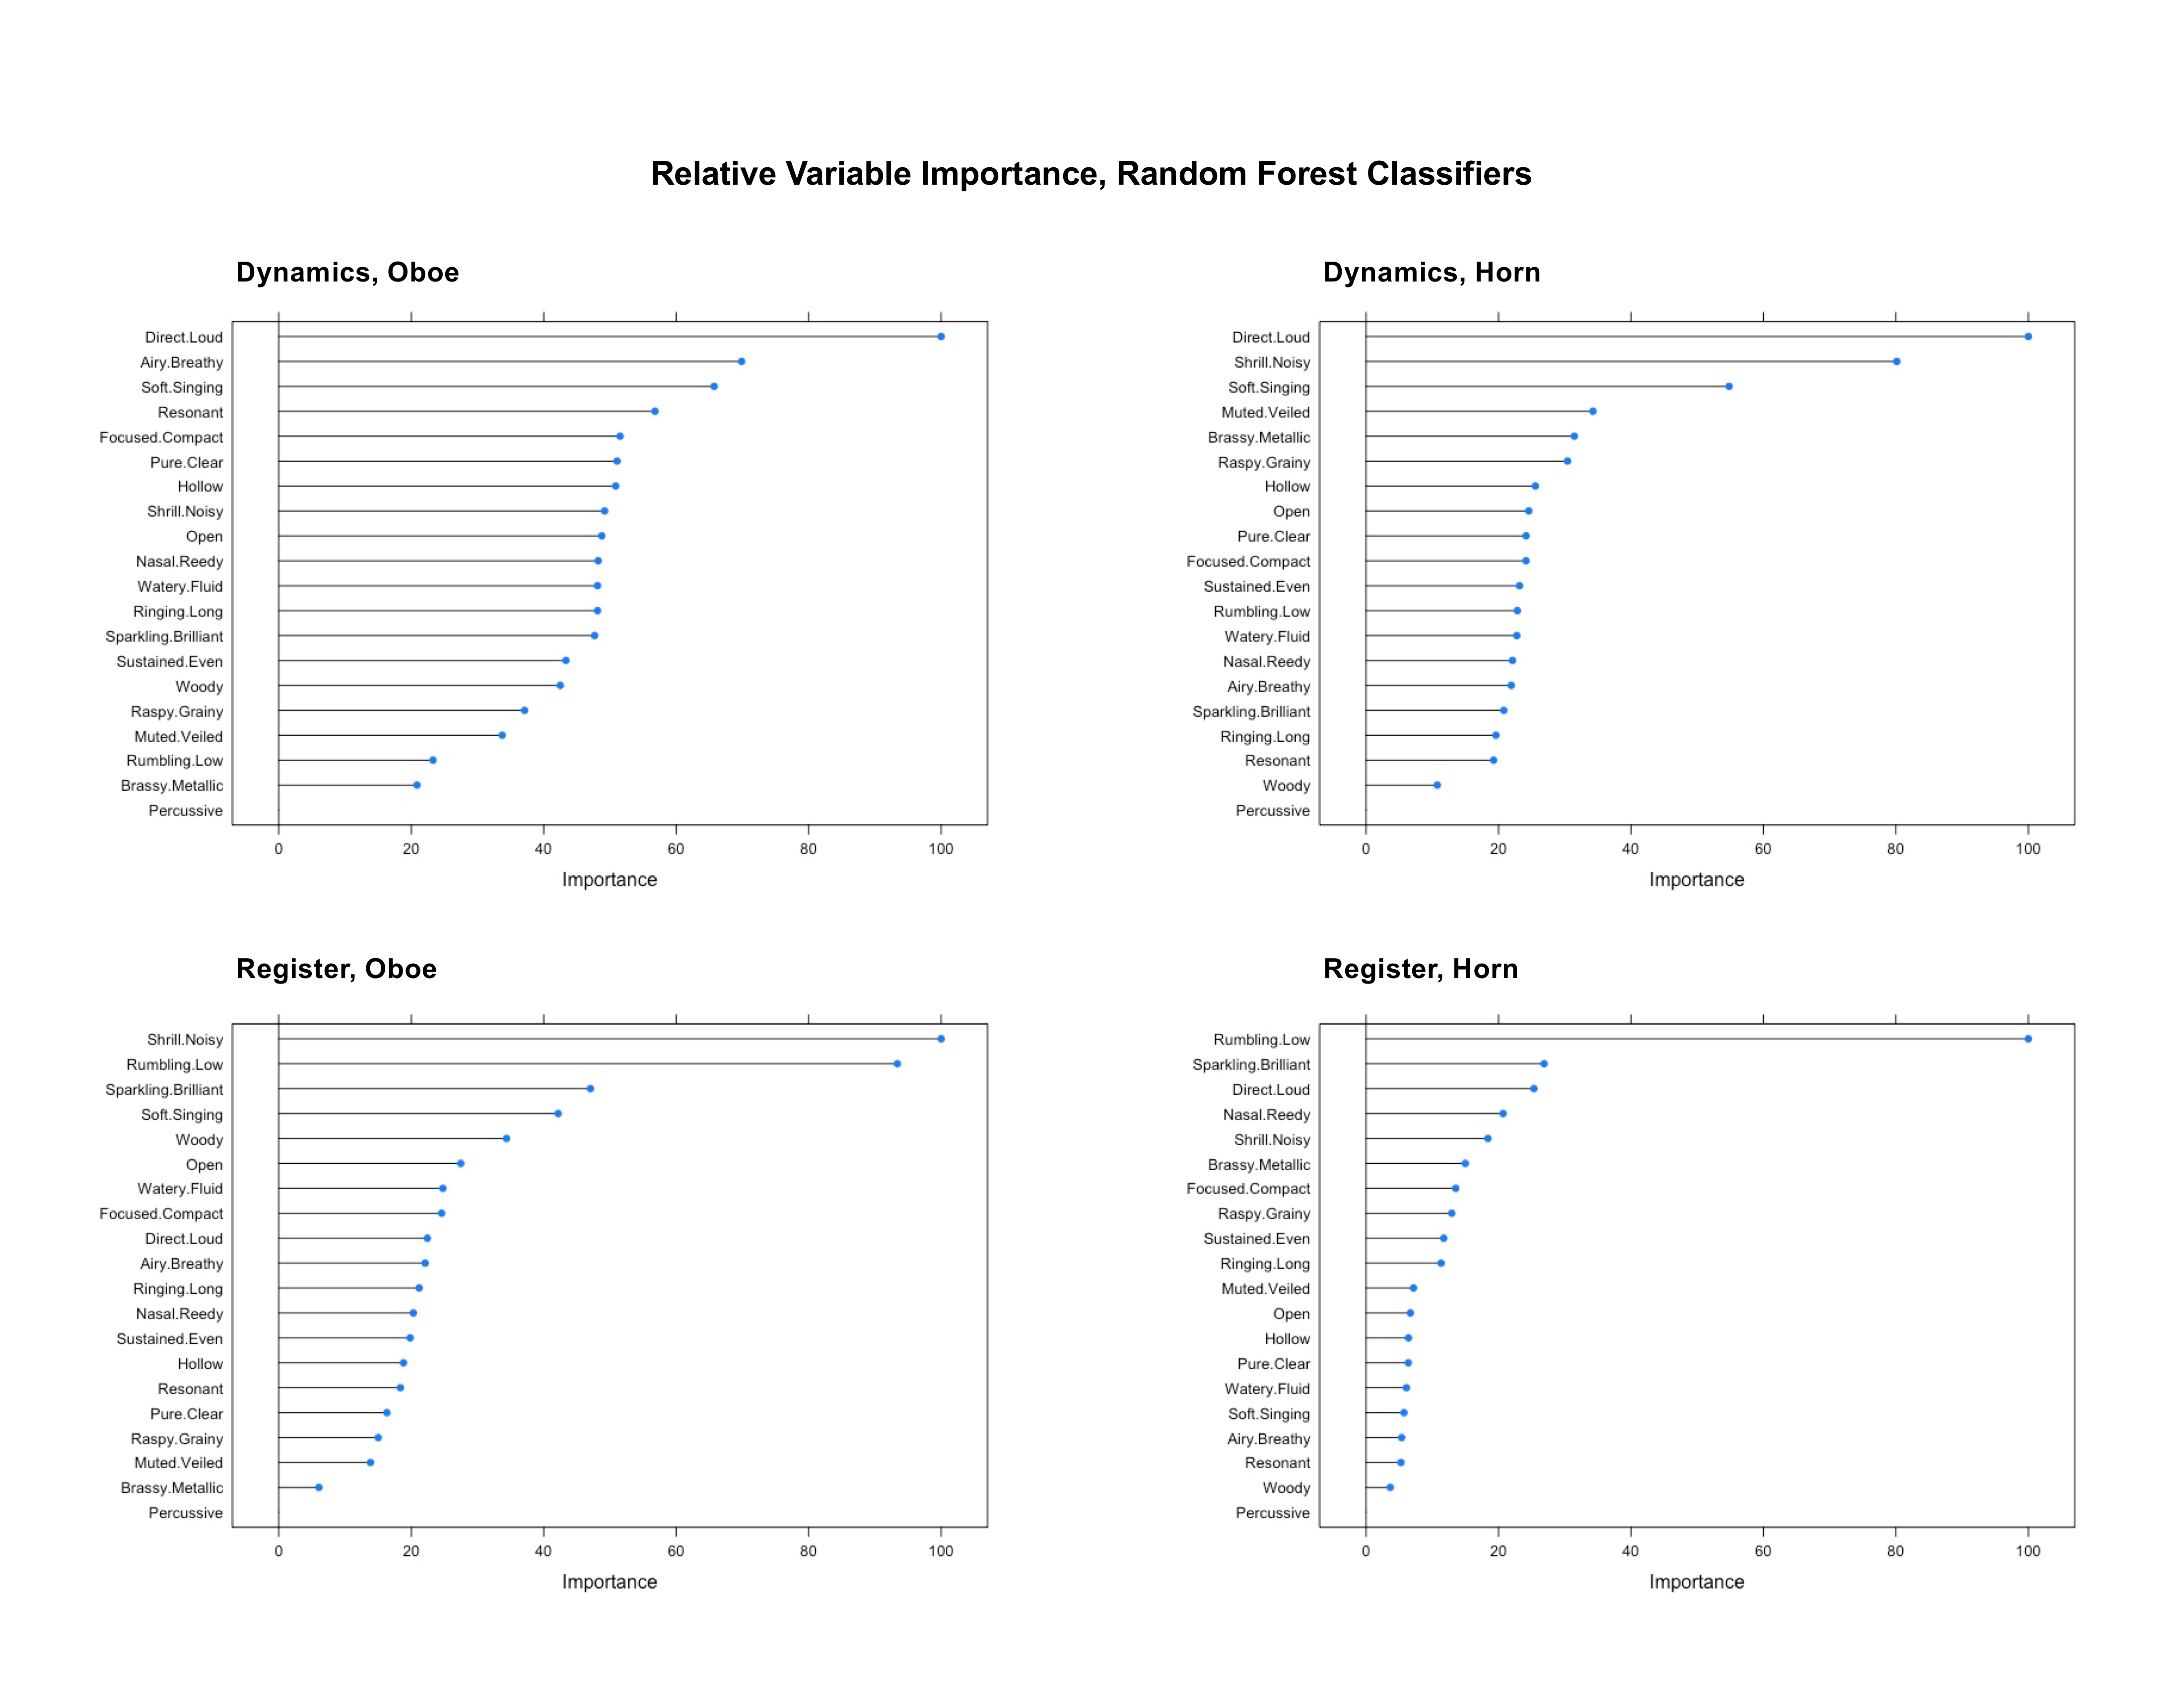
Figure 6. Relative variable importance from random forest classifiers predicting register and dynamics for oboe and horn from semantic rating data.
Tables 6–9. Relative variable importances from the random forest classifiers and significant (p < .05) descriptors in predicting register and dynamics for oboe and for horn from partial proportional odds regressions.
| Random Forest | Partial Proportional Odds Regression | ||
|---|---|---|---|
| Semantic Descriptor | Variable Importance | Significance | Effect Type |
| direct/loud | 100.0 | ✓ | nominal: p|m, m|f |
| airy/breathy | 75.1 | ✓ | nominal: p|m, m|f |
| soft/singing | 67.0 | ✓ | ordinal |
| resonant | 58.7 | ✓ | ordinal |
| ringing/long | 51.4 | ||
| open | 51.2 | ||
| focused/compact | 50.9 | ||
| pure/clear | 50.6 | ||
| hollow | 50.5 | ✓ | ordinal |
| nasal/reedy | 50.4 | ||
| shrill/noisy | 50.4 | ||
| sparkling/brilliant | 50.0 | ||
| watery/fluid | 48.5 | ||
| sustained/even | 47.0 | ✓ | ordinal |
| woody | 43.7 | ✓ | ordinal |
| raspy/grainy | 38.0 | ||
| muted/veiled | 32.7 | ||
| rumbling/low | 22.2 | ||
| brassy/metallic | 21.7 | ||
| percussive | 0.0 | ||
Note. Significance levels for the proportional odds regressions can be found in Appendix G along with the full models.
| Random Forest | Partial Proportional Odds Regression | ||
|---|---|---|---|
| Semantic Descriptor | Variable Importance | Significance | Effect Type |
| direct/loud | 100.0 | ✓ | nominal: p|m, m|f |
| shrill/noisy | 73.5 | ✓ | ordinal |
| soft/singing | 51.6 | ✓ | ordinal |
| muted/veiled | 30.2 | ✓ | ordinal |
| raspy/grainy | 28.8 | ||
| brassy/metallic | 27.6 | ||
| open | 22.6 | ||
| hollow | 22.4 | ||
| focused/compact | 22.2 | ||
| pure/clear | 21.4 | ||
| airy/breathy | 21.3 | ||
| sustained/even | 21.2 | ||
| watery/fluid | 20.1 | ✓ | ordinal |
| nasal/reedy | 19.6 | ||
| rumbling/low | 19.5 | ||
| sparkling/brilliant | 19.3 | ||
| ringing/long | 18.1 | ||
| resonant | 17.6 | ||
| woody | 10.4 | ||
| percussive | 0.0 | ||
| Random Forest | Partial Proportional Odds Regression | ||
|---|---|---|---|
| Semantic Descriptor | Variable Importance | Significance | Effect Type |
| shrill/noisy | 100.0 | ✓ | ordinal |
| rumbling/low | 95.5 | ✓ | ordinal |
| sparkling/brilliant | 52.9 | ✓ | ordinal |
| soft/singing | 49.8 | ✓ | nominal: M2|H |
| woody | 35.9 | ✓ | nominal: M1|M2, M2|H |
| open | 31.8 | ✓ | nominal: M2|H |
| focused/compact | 28.7 | ||
| watery/fluid | 28.5 | ||
| airy/breathy | 28.2 | ||
| direct/loud | 27.2 | ||
| resonant/vibrant | 24.6 | ✓ | nominal: M1|M2 |
| nasal/reedy | 24.4 | ✓ | ordinal |
| ringing/long | 24.1 | ||
| sustained/even | 23.8 | ||
| pure/clear | 21.7 | ||
| hollow | 21.7 | ||
| raspy/grainy | 16.7 | ✓ | ordinal |
| muted/veiled | 16.2 | ✓ | ordinal |
| brassy/metallic | 8.5 | ||
| percussive | 0.0 | ||
| Random Forest | Partial Proportional Odds Regression | ||
|---|---|---|---|
| Semantic Descriptor | Variable Importance | Significance | Effect Type |
| rumbling/low | 100.0 | ✓ | ordinal |
| sparkling/brilliant | 27.7 | ✓ | ordinal |
| direct/loud | 23.6 | ✓ | ordinal |
| nasal/reedy | 21.0 | ✓ | ordinal |
| shrill/noisy | 19.9 | ✓ | ordinal |
| raspy/grainy | 15.3 | ✓ | ordinal |
| focused/compact | 15.0 | ||
| brassy/metallic | 14.2 | ||
| sustained/even | 13.0 | ||
| ringing/long | 12.2 | ||
| muted/veiled | 7.2 | ||
| open | 6.9 | ✓ | ordinal |
| watery/fluid | 6.5 | ✓ | ordinal |
| pure/clear | 6.2 | ||
| soft/singing | 6.0 | ✓ | ordinal |
| hollow | 6.0 | ||
| resonant | 5.0 | ✓ | ordinal |
| airy/breathy | 4.7 | ||
| woody | 2.7 | ||
| percussive | 0.0 | ||
Comparing ratings of recorded stimuli and auditory imagery
Results of the current study can be compared to results from Reymore (2021) in order to explore how semantic characterizations of imagined "typical" instrument sounds compare to characterizations of recorded instrument sounds. To examine this relationship, I compared the aggregate average ratings in the current study (mean of all 36 pitches for a given instrument on each dimension) to values reported in Reymore (2021) for the oboe and horn.
For the majority of the dimensions, the means for the imagined stimuli tend to be slightly higher than those of the recorded stimuli. For the oboe, the average of the absolute values of the differences in mean ratings between the auditory imagery task and recorded stimuli task was 0.69. That is, on average, mean ratings for each of the dimensions using imagined stimuli and using recorded stimuli were less than one point apart relative to a seven-point scale. The maximum absolute difference (i.e., absolute value of the difference) between ratings of auditory imagery and recorded stimuli was 1.52 points and the minimum absolute difference was 0.06 points.
For the horn, the average absolute difference in mean ratings between the auditory imagery task and recorded stimuli task was 1.10, higher than the comparable value for the oboe. The maximum absolute difference was 2.47 points and the minimum was 0.02 points. Dimensions with the highest absolute differences between imagined and recorded stimuli means include soft/singing (2.47), resonant/vibrant (2.28), and sustained/even (1.97).
Notably, the differences between imagined and recorded means for the French horn are on average greater than for the oboe. One factor that might be related to this difference is the variance in timbre-implicated parameters afforded by each instrument. The oboe has a small pitch range in comparison to most orchestral instruments, spanning only about two and a half octaves. The French horn has a relatively large pitch range, spanning more than four octaves. Accordingly, although stimuli were sampled from four nearly equally spaced locations in each instrument's range, the range of pitches sampled for the oboe was two octaves plus three semitones while the range of pitches sampled for the French horn was three octaves plus four semitones. Similarly, the dynamic range of the oboe is very small and is limited by the physics of the instrument and reed, with its incredibly narrow opening, while the dynamic range of the French horn is especially impressive—a horn may play a quiet, pure, golden note or an ear-shattering roar. In Reymore and Huron (2020), participants were asked to imagine a typical sound that an instrument would make rather than an unusual one. Values from the current study represent an average over 12 register/dynamic combinations, and some of the sounds presented to the participants in the current study likely were far from what participants in previous studies deemed to be a typical sound (for example, the lowest ff notes in the horn).
In general, rating differences between imagined and recorded stimuli for both instruments are likely also related to the differences between imagined typical sounds and real instantiations of sounds that come from the recording equipment, recording space, other factors including distance from the mic and the individual tone quality of the musician making the recordings. In particular, while both instruments were recorded with high-quality equipment, the recordings took place in a small room with little resonance, and the musicians were necessarily somewhat close to the mic, given the dimensions of the room. In considering the observed differences in means in light of the recording circumstances, it seems likely that most participants in the initial study imagining the sound of each instrument as they might have heard it live or recorded in a concert hall or other resonant space. Especially if the instrument was not their native instrument, they likely imagined the sound from a distance rather than in close proximity. The close mic in the recordings from this study picked up on slight imprecisions in the sounds that would be otherwise masked in a resonant space; this may have contributed to the lower ratings of pure/clear in the current study on both instruments: the differences in pure/clear between ratings from auditory imagery and recordings were among the highest for both instruments. For the horn, resonant/vibrant and ringing/long decay were both rated particularly low from the recordings as compared to the imagined tones of the previous study, both dimensions that ostensibly are related to the acoustics of the recording space, particularly in conjunction with the big sound of the horn.
Interestingly, the data from imagined stimuli predicted much higher ratings on soft/singing for both instruments than were collected in the current study. Although participants in the initial experiment were asked to imagine a sustained single tone, the qualities included in the soft/singing dimension (soft, smooth, singing, voice-like, sweet, gentle, calm) may have been associated with the instrument not only by virtue of a particular tone that was imagined, but also with their melodic characters and with the types of sweet (oboe) or soaring (horn) melodies that are characteristic of their orchestral personalities. Some dimensions may be a part of an instrument's characteristic or stereotypical timbral qualia but may not manifest in two-second, single note clips. If this is the case, some dimensions (such as soft/singing) may have been apparent with the use of imagined prototype stimuli but not experienced as strongly by participants in the brief recordings. However, despite some of the differences in means between the two studies (the largest was 2.47 points), the overall agreement in the ratings between the imagined and recorded instruments is quite strong, especially for the oboe.
DISCUSSION
Comparative Observations
For the oboe, register appeared to consistently provide the most variance along the timbre qualia dimensions; relatively less variance occurred with dynamic level change on most dimensions. Relative to chance performance, the random forest classifiers were much more successful in predicting register than predicting dynamics, even more so for the oboe than for the horn. In general, dynamic level seems to play a more important role in timbre qualia for the French horn than for the oboe. The differences in average ratings as effects of dynamics are both more consistent and more pronounced with the French horn—that is, there are wider ranges of qualia ratings as products of dynamic change, and several clear trends are apparent across dynamics that are mostly consistent among registers.
Tables 10–11 summarize the results of the partial proportional odds regressions and random forest classifiers. Although the nuances of these results may be very important in some contexts, considering overall trends can help guide future predictions.
Tables 10–11.Overlapping and unique significant predictors for register and dynamics in the oboe and horn; results from exploratory modeling. The third and fourth columns indicate whether or not each significant descriptor from the partial proportional odds regression was among the top six most important variables in the corresponding classifier.
| Partial Proportional Odds | Random Forest, Top 6 RVI | ||
|---|---|---|---|
| Instrument | Significant Descriptors | Oboe | Horn |
| Both instruments | shrill/noisy | X | X |
| rumbling/low | X | X | |
| sparkling/brilliant | X | X | |
| soft/singing | X | ||
| open | X | ||
| nasal/reedy | X | ||
| resonant/vibrant | |||
| raspy/grainy | X | ||
| Oboe only | woody | X | |
| muted/veiled | |||
| Horn only | direct/loud | X | |
| watery/fluid | |||
| Partial Proportional Odds | Random Forest, Top 6 RVI | ||
|---|---|---|---|
| Instrument | Significant Descriptors | Oboe | Horn |
| Both instruments | direct/loud | X | X |
| soft/singing | X | X | |
| Oboe only | airy/breathy | X | |
| hollow | |||
| resonant/vibrant | X | ||
| sustained/even | |||
| woody | |||
| Horn only | muted/veiled | X | |
| shrill/noisy | X | ||
| watery/fluid | |||
Regarding register (Table 7), the two instruments share eight of the same significant predictors while retaining two unique predictors each. However, which descriptors are significant in the dynamics models (Table 8) varies much more in comparison to the register models: the two instruments share only two significant predictors while the horn is associated with an additional three unique predictors and the oboe with an additional five. It is notable that despite the relatively large number of predictors and small sample size, each model still contained 5–11 significant predictors, suggesting that changes in timbre qualia in response to both register and dynamic are somewhat complex: these parameters appear to motivate multidimensional semantic change in a variety of directions and strengths. Furthermore, because the models for register contained ratings of pitches at various dynamic levels, and vice versa, they provide an overall picture of each parameter individually and do not describe potential significant interactions (for example, the mean ratings for shrill/noisy in the horn as function of register behave differently at each of the three dynamic levels).
While there are some differences in the results of the two modeling approaches, there is a significant amount of overlap in that the top 4–6 descriptors in relative variable importance for the random forest classifiers are also significant in the corresponding partial proportional odds regression (see Tables 6–9). These shared descriptors can guide future experiments; the predictive descriptors that are unique to each instrument suggest that it may be the most obvious candidates (e.g., direct/loud and soft/singing for dynamics; rumbling/low, shrill/noisy, and sparkling/brilliant for register) that have similar effects across instruments. However, the unique descriptors are arguably the most interesting from acoustical, compositional, and music analytical perspectives.
Future experiments can use these findings as the basis for hypotheses related to semantics and register and/or dynamics, suggesting which semantic dimensions to focus predictions on. Examining a reduced set of descriptors based on these results increases the tractability of rating tasks through reduced experiment length and/or rating additional stimuli. When testing hypotheses about individual descriptors, reducing the number of descriptors also reduces the necessary number of multiple tests on the same dataset.
Another consideration in future experimental design relates to the inclusion of words in the descriptors which are clearly semantically related to pitch height and loudness, including "shrill" in shrill, harsh, noisy; "low" in rumbling, booming, low, deep, thick, fat, heavy; "loud" in direct, projecting, loud, aggressive, commanding, assertive, powerful; and "soft" in soft, smooth, singing, voice-like, sweet, gentle, calm. One option would be to remove these four words in order to determine the extent to which they are explicitly driving associations.
Note-to-note Idiosyncrasies
Average ratings on individual notes from within the same register sometimes varied significantly (see Appendix C). This is likely due in part to timbral idiosyncrasies that are inherent to the instruments. It is possible that some variability could be attributed to the particular instantiation of the note that was played during the recording. The musicians were permitted to re-record each note as many times as they wanted and were encouraged to do so if they were not happy with the quality of a note. Even so, one particular recording of a note might be slightly louder than the other notes in its register set or vary on another factor, such as articulation or vibrato, which could affect timbre qualia judgments. In future studies, providing several versions of each stimulus note, with one version presented at random to each participant, may help reduce the variability introduced by using a single, instantiation of a note; however, note-to-note variations will likely still be present. Given the idiosyncrasies observed in these results, the procedure of averaging three notes to represent a register, rather than one, was a productive one, illuminating several trends among the interactions of timbre qualia dimensions with register and dynamics, and is recommended in future research.
Within-instrument timbral variability
The level of detail to which the timbre qualia of an instrument might be mapped out is potentially enormous when considering all the parameters that can affect timbre. At some point, the resources and time invested in further refinement may yield diminishing returns, depending on the purpose of the research. Even at the level of detail under consideration here, we can see that while some dimensions can vary somewhat widely within a single instrument, other dimensions remain fairly consistent. For example, in the French horn, the largest range of mean ratings for each register-dynamic combination is 5.24, on the rumbling/low dimension. Specifically, of the 12 conditions (4 registers * 3 dynamics), ff in the low register was rated the highest on rumbling/low at 6.50 and pp in the high range was rated the lowest at 1.25. With this wide range of levels for rumbling/low, the nuanced representation of this dimension resulting from this study could add important information to musical analysis, both orchestrally and in solo or chamber settings. At the other extreme, the smallest range of mean ratings observed here is in the oboe on the dimension percussive, with a difference between the maximum rating (1.52 for mm in the low range) and the minimum rating (1.08 for pp in the low range) of only 0.44. Such a difference is unlikely to be especially useful or relevant to analysis involving the oboe. Further support for this interpretation comes from the observation that percussive was not significant in any of the regression models and was consistently ranked lowest in all random forest models in terms of relative variable importance. While the dimension of percussive might prove crucial in later assessments of timbral differences resulting from variation in articulation styles, it would not be germane to an analysis accounting for timbral interactions with register and/or dynamics.
These considerations lead to the question of what constitutes a meaningful difference in variability on a given dimension for a given instrument. Thus, it is informative to look at which dimensions exhibit the highest within-instrument variability for both instruments. The five dimensions for each instrument with the highest differences between maximum and minimum means are listed below in Table 8a–b. However, while the table below and results from the exploratory modeling can provide some kind of objective criteria for answering the question of meaningful variability in general, for music analysis, meaningful variability can only be assessed in the context of a particular piece of music. Consider a piece or orchestral solo for French horn that took place entirely in the middle register of the instrument; variation on rumbling/low would not prove as relevant here as it would for a piece that made use of all registers of the instrument.
Table 12–13. Highest within-instrument variabilities for the oboe and horn.
| Dimension | Condition, maximum mean |
Max mean | Condition, minimum mean |
Min mean | Range |
|---|---|---|---|---|---|
| shrill/noisy | high, ff | 5.82 | low, pp | 1.83 | 3.99 |
| airy/breathy | high, pp | 5.99 | low, ff | 2.54 | 3.45 |
| direct/loud | low, ff | 4.35 | high, pp | 1.92 | 3.28 |
| sparkling/brilliant | high, ff | 5.12 | low, pp | 2.20 | 2.92 |
| rumbling/low | low, ff | 3.91 | high, pp | 1.00 | 2.91 |
| Dimension | Condition, maximum mean |
Max mean | Condition, minimum mean |
Min mean | Range |
|---|---|---|---|---|---|
| rumbling/low | low, ff | 6.50 | high, pp | 1.25 | 5.25 |
| direct/loud | high, ff | 6.52 | middle 2, pp | 1.65 | 4.87 |
| shrill/noisy | high, ff | 6.17 | middle 2, pp | 1.52 | 4.65 |
| raspy/grainy | low, ff | 6.04 | high, mm | 1.97 | 4.07 |
| soft/singing | low, ff | 4.42 | high, pp | 1.09 | 3.32 |
Based on the ratings results reported here, we might frame the dimensions in Tables 12 and 13 as those for which each instrument has the most timbral flexibility, at least in relation to pitch and dynamics with stimuli played in a traditional manner (that is, excluding extended techniques). Both oboe and French horn shared three out of their five highest within-instrument variabilities: direct/loud, shrill/noisy, and rumbling/low. As these dimensions are semantically intertwined with dynamics and pitch, it would be reasonable to extrapolate these trends and predict that all instruments that can vary in intensity would show at least some variance on direct/loud while all instruments that vary in pitch would show at least some variance on shrill/noisy and/or rumbling/low. In general, the results suggest that the French horn has a higher capacity for timbral flexibility as generated through pitch and dynamics than does the oboe, a conclusion that accords with casual observation. The main source of timbral flexibility for the oboe may be generated through the manipulation of other variables not assessed here and their interactions. For example, a primary source of timbral flexibility for the oboe may involve vibrato, which is typically not a source of timbral variation for traditional horn sounds and was not manipulated for either instrument in this experiment.
CONCLUSIONS
This paper reported the results of an experiment in which participants rated two instruments on 12 combinations of register and dynamics using the 20-dimensional timbre qualia model from Reymore and Huron (2020). Although trends emerged across both dynamics and registers, the results illustrate the complexity of within-instrument timbral variability. While some trends were approximately linear, others were nonlinear, often where the highest and lowest registers stood apart from the middle registers. Some timbre qualia dimensions display interactions between register and dynamics—an example is that pp notes on the oboe often diverged from notes played at mm and ff, particularly in the high register. Finally, while some trends appeared similar between the oboe and horn, others seem to be unique to each instrument. Further research is needed to determine to what extent these individual trends may generalize to other instruments in the same family (woodwind or more specifically double reed for oboe, and brass for horn).
Summary, Register
Based on exploratory modeling, the most clearly relevant dimensions for register in both instruments include rumbling/low, shrill/noisy, and sparkling/brilliant, though several other descriptors are implicated through either the regressions, random forest classifiers, or both (see Tables 6–9). Uniquely for the oboe (that is, not for the horn), significant relationships between register and woody and muted/veiled were demonstrated. In the horn, the nominal effect for muted/veiled between the Middle 2 and High registers was close to significance (p = .054), suggesting that this possibly may be a subtle effect that could be detected in a larger sample. Uniquely for the horn, direct/loud and watery/fluid were related to register.
Summary, Dynamics
The most clearly relevant dimensions for dynamics include direct/loud and soft/singing; intriguingly, the differences between effects of dynamics on semantic dimensions appear to be greater than for the effects of register. That is, more dimensions were related uniquely to either the oboe or horn and were not shared results. In the oboe, airy/breathy and resonant/vibrant were both significant and ranked highly in relative importance, while for the horn, this was true of muted/veiled and shrill/noisy. While watery/fluid was significant for the horn, it did not rank highly in variable importance. For the oboe, watery/fluid neither was significant nor ranked highly, though it did near significance (p = .08), suggesting again that a general relationship may hold in a larger sample, albeit a weak one.
Recommendations for Future Research
The results recommend several suggestions for consideration in future timbre semantics research, particularly in regard to research which aims to understand timbre semantic variability in response to changing musical parameters. In sum:
- In relation to timbre semantics, dynamics may interact with register. For example, for the oboe, airy/breathy increases from the Middle 2 to the High registers at a piano dynamic but decreases at a forte dynamic. Brant tests during exploratory analysis confirmed that while some descriptors can be treated as ordinal, others should be considered nominal.
- Trends between musical parameters and semantic ratings may be non-linear. Future studies will need to account for this in relation to hypothesis testing and model building.
- The range of semantic affordances may vary from instrument to instrument in relation to a given parameter—here, the horn demonstrated greater semantic flexibility for both register and dynamic as compared to the oboe. The oboe demonstrated relatively limited flexibility in response to dynamics.
- Note-to-note idiosyncrasies in timbre may significantly impact semantic judgements. This should be considered when selecting stimuli, particularly when seeking to represent register.
- The type of relationship between a given semantic descriptor and either register or dynamics may vary from instrument to instrument.
- Similarly, the latent structure of rating data may vary from instrument to instrument.
These exploratory results mark an initial step forward in understanding within-instrument timbral flexibility, an issue that has not been previously addressed in a systematic way. This question is relevant to understanding how within-instrument timbres contribute to musical expression and meaning. For example, results of this study could be applied in analysis of unaccompanied works for oboe or horn. Sandell and Chronopoulos (1996) proposed the term "macrotimbre" to describe the formal unity of timbres associated with a single source, inclusive, for example, of variation in timbre across an instrument's range. The results illustrate the timbral possibilities afforded by these instruments as a result of manipulating dynamics and register, adding dimensionality to our understanding of their macrotimbres as presented in Reymore (2021).
Future research that maps additional instruments and manipulates different parameters would deepen our understanding of timbral similarities across instruments. Soden (2020) introduces the term "metatimbre," for the purpose of describing any collection of related timbres. Definitions of metatimbre include—but are not limited to—those produced by a single instrument, so that one could speak of, for example, the metatimbre of the clarinet, a concept that overlaps with Sandell and Chronopoulos' concept of macrotimbre. However, Soden's concept of metatimbre also includes collections of timbres across instruments with similar perceptual qualities or qualia, which seeks to qualify relationships among timbres of different instruments. For example, Rimsky-Korsakov noted timbral similarities among the viola, the middle register of the bassoon, and the low register of the clarinet as well as between the bassoon and horn when played piano or mezzo-forte (as cited in Soden, 2020). The current work provides a method for quantifying timbral similarities such as these that are specific to register-dynamic combinations. For example, upon collecting data for the viola, bassoon, and clarinet, we would expect to see more similarity among the registers specified by Rimsky-Korsakov than among other registers of these instruments or of other instruments, such as the oboe. Techniques such as hierarchical clustering or rank-ordering Euclidean distances would be appropriate for mapping metatimbral spaces across instruments. It is possible that this type of information may be able to predict perceptual effects of orchestration, such as blend between instruments (as described in McAdams, Goodchild, & Soden, 2022). Such results would also likely be useful in pedagogy of orchestration and composition and may have applications in music-theoretical analysis.
Future research using these methodologies might also examine the effect of musical experience on the cognitive linguistics of timbre by collecting ratings from both musicians and non-musicians or from participants from non-Western cultures. The original model (Reymore & Huron, 2020) was derived from studies involving Western, classically trained musicians. By asking people with different types of musical experience to apply the terms of the model to instrument sounds, we can begin to develop a sense of which linguistic concepts are more or less common across groups or are culturally constrained.
The subtle timbre nuances, tendencies, and idiosyncrasies of a given musical instrument are critical to the experience of a musician who has expertise with that instrument and as evidenced by the results of this study, are often apparent to listeners. Yet, the timbral affordances of musical instruments, even in response to basic parameters such as dynamics and register, are rarely discussed. The study reported here demonstrates that not only is within-instrument timbral variability based on dynamic and register apparent to listeners, such variability may be quite complex, and interactions among parameters may play an important role. Results can inform predictions for future work addressing which dimensions of timbre qualia are unique to specific instruments or groups of instruments and which are common across many instruments as well as the types of relationships, both linear and non-linear, between timbre qualia and playing techniques.
ACKNOWLEDGEMENTS
Many thanks to musicians Leland Greene and Benjamin Hottensmith for recording the stimuli and to Marcel Montrey for his statistical advice.
NOTES
- This work is part of the author’s published dissertation. The author is now at the School of Music, Dance and Theater, Arizona State University. Correspondence concerning this article should be addressed to School of Music, Dance and Theater, Arizona State University, 50 E Gammage Pkwy, Tempe, AZ 85251.
Return to Text - "Mezzo mezzo," while not a standard dynamic term, is sometimes used colloquially by musicians to communicate that the dynamic level should be as middle-of-the-road as possible. This description, with its definition, should be accessible even to musicians who have not previously heard or used the term. Performers recording the stimuli were encouraged to ask for clarification about any of the instructions.
Return to Text
REFERENCES
- Allen, E. J., & Oxenham, A. J. (2014). Symmetric interactions and interference between pitch and timbre. The Journal of the Acoustical Society of America, 135(3), 1371–1379. https://doi.org/10.1121/1.4863269
- Bernays, M., & Traube, C. (2014). Investigating pianists' individuality in the performance of five timbral nuances through patterns of articulation, touch, dynamics, and pedaling. Frontiers in Psychology, 5:157. https://doi.org/10.3389/fpsyg.2014.00157
- Christensen, R. H. B. (2019). ordinal - Regression Models for Ordinal Data. R package version 2019.12-10. https://CRAN.R-project.org/package=ordinal.
- Cousineau, M., Carcagno, S., Demany, L., & Pressnitzer, D. (2014). What is a melody? On the relationship between pitch and brightness of timbre. Frontiers in Systems Neuroscience, 7:127. https://doi.org/10.3389/fnsys.2013.00127
- Drabkin, W. (2001). Register. In Grove Music Online. https://doi.org/10.1093/gmo/9781561592630.article.23072
- Fabiani, M., & Friberg, A. (2011). Influence of pitch, loudness, and timbre on the perception of instrument dynamics. The Journal of the Acoustical Society of America, 130(4), EL193–EL199. https://doi.org/10.1121/1.3633687
- Handel, S., & Erickson, M. L. (2001). A rule of thumb: The bandwidth for timbre invariance is one octave. Music Perception: An Interdisciplinary Journal, 19(1), 121–126. https://doi.org/10.1525/mp.2001.19.1.121
- Jolliffe, I. T. (2002). Principal components analysis (2nd ed.). Springer.
- Krumhansl, C. L., & Iverson, P. (1992). Perceptual interactions between musical pitch and timbre. Journal of Experimental Psychology: Human Perception and Performance, 18(3), 739–751. https://doi.org/10.1037/0096-1523.18.3.739
- Max Kuhn (2020). caret: Classification and Regression Training. R package version 6.0-86. https://CRAN.R-project.org/package=caret
- Marozeau, J., & de Cheveigné, A. (2007). The effect of fundamental frequency on the brightness dimension of timbre. The Journal of the Acoustical Society of America, 121(1), 383–387. https://doi.org/10.1121/1.2384910
- Marozeau, J., de Cheveigné, A., McAdams, S., & Winsberg, S. (2003). The dependency of timbre on fundamental frequency. The Journal of the Acoustical Society of America, 114, 2946. https://doi.org/10.1121/1.1618239
- McAdams, S. (2019). Timbre as a Structuring Force in Music. In Siedenburg, K., Saitis, C., McAdams, S., Popper, A.N., Fay, R.R. (eds.), Timbre: Acoustics, Perception, Cognition (pp. 211–243). Springer International Publishing. https://doi.org/10.1007/978-3-030-14832-4_8
- McAdams, S., & Goodchild, M. (2017). Musical Structure: Sound and Timbre. In Ashley, R. & Timmers, R. (eds.), The Routledge Companion to Music Cognition (pp. 129–139). Routledge. https://doi.org/10.4324/9781315194738-11
- McAdams, S., Goodchild, M., & Soden, K. (2022). A taxonomy of orchestral grouping effects derived from principles of auditory perception. Music Theory Online, 28(3).
- Melara, R. D., & Marks, L. E. (1990). Interaction among auditory dimensions: Timbre, pitch, and loudness. Perception & psychophysics, 48(2), 169–178. https://doi.org/10.3758/BF03207084
- Page, J.K., Gourlay, K.A., Blench, R. & Shackleton, N. (2001). Clarinet. Grove Music Online. https://doi.org/10.1093/gmo/9781561592630.article.52768
- Pratt, R. L., & Bowsher, J. M. (1978). The subjective assessment of trombone quality. Journal of Sound and Vibration, 57(3), 425–435. https://doi.org/10.1016/0022-460X(78)90321-8
- R Core Team (2020). R: A language and environment for statistical computing. R Foundation for Statistical Computing, Vienna, Austria. URL https://www.R-project.org/.
- Redgate, C. (2018). Composing Using the Altissimo Range of the Oboe. (accessed November 11, 2020)
- Reymore, L. (2021). Characterizing prototypical musical instrument timbres with Timbre Trait Profiles. Musicae Scientiae, 26(3), 648-674. https://doi.org/10.1177%2F10298649211001523
- Reymore, L., & Hansen, N.C. (2020). A theory of instrument-specific absolute pitch. Frontiers in Psychology, 11:560877. https://doi.org/10.3389/fpsyg.2020.560877
- Reymore, L. & Huron, D. (2020). Using auditory imagery tasks to map the cognitive linguistic dimensions of musical instrument timbre qualia. Psychomusicology, 30(3), 124–144. https://doi.org/10.1037/pmu0000263
- Rimsky-Korsakov, N. (1913). Principles of orchestration, with musical examples drawn from his own works. (M. Shteĭnberg, Ed., E. Agate, Trans.). New York, NY: Dover Publications.
- Sandell, G. J., & Chronopoulos, M. (1996). Identifying musical instruments from multiple versus single notes. The Journal of the Acoustical Society of America, 100, 2752. https://doi.org/10.1121/1.416900
- Siedenburg, K., & McAdams, S. (2017). Four distinctions for the auditory "wastebasket" of timbre. Frontiers in Psychology, 8:1747. https://doi.org/10.3389/fpsyg.2017.01747
- Snow, D. B. (2006). A Conductor's Guide to Wind Instrument Deficiencies: A Practical Addendum to the Undergraduate Conducting Text. [DMA dissertation, The University of Southern Mississippi].
- Soden, K. (2020). Orchestrational combinations and transformations in operatic and symphonic music. [Doctoral dissertation, McGill University].
- Steele, K. M., & Williams, A. K. (2006). Is the bandwidth for timbre invariance only one octave? Music Perception, 23(3), 215–220. https://doi.org/10.1525/mp.2006.23.3.215
- Traube, C. (2004). An interdisciplinary study of the timbre of the classical guitar. [Doctoral dissertation, McGill University].
- Venables, W. N. & Ripley, B. D. (2002) Modern Applied Statistics with S. Fourth Edition. Springer, New York. ISBN 0-387-95457-0. https://doi.org/10.1007/978-0-387-21706-2
- Vienna Symphonic Library. (n.d.) "Oboe – Sound Characteristics." https://www.vsl.co.at/en/Oboe/Sound_Characteristics
- Wallmark, Z. (2019). A corpus analysis of timbre semantics in orchestration treatises. Psychology of Music, 47(4), 585–605. https://doi.org/10.1177/0305735618768102
- Weihs, C., Reuter, C., & Ligges, U. (2005). Register classification by timbre. In Classification—the Ubiquitous Challenge (pp. 624–631). Springer, Berlin, Heidelberg. https://doi.org/10.1007/3-540-28084-7_74
APPENDICES
Appendix A, Stimuli Selection
At the finest possible level of detail, participant judgments would be collected at every combination of pitch and loudness on an instrument. However, this would result in an intractable number of ratings for a given instrument. As an example, the range of the B♭ clarinet is from concert D3 to B♭6: the clarinet is able to play 45 different chromatic pitches. Dynamics are on a continuous spectrum; however, it is conventional to conceptualize dynamic levels as categorical. The commonly used dynamic levels include pianissimo (pp), piano (p), mezzo piano (mp), mezzo forte (mf), forte (f), and fortissimo (ff). Additional p's and f's are occasionally added to the pianissimo and fortissimo, respectively, in order for the composer to communicate the call for extreme dynamics to the players. Movement between these categorical levels can be executed as a quantum leap or as a gradual increase (crescendo) or decrease (descrescendo) in loudness. Even using only standard categorical dynamic levels, a complete rating task would include six levels of loudness. Given the 45 notes of the clarinet and the six levels of loudness, a complete mapping would require 270 stimuli (45 notes for each of the six levels). For each stimulus, participants must make 20 ratings; 270 stimuli would require 5,400 ratings. This would make for an extremely long study, and the results would map only a single instrument.
Appendix B, Rating Task Instructions
"For each question, you will be given a sound clip. You will be asked to listen to the sound clip. Then, you will be asked to rate how well each of the descriptions listed below describes the sound you just heard. You may listen to the sound clip as many times as you'd like while rating the sound. A rating of 1 indicates that the word or group of words is not at all appropriate to describe the sound of the instrument, while a rating of 7 indicates that at least one of the presented words is very appropriate.
In this experiment, you will rate the sounds of various musical instruments according to several descriptive categories. Most of these categories contain multiple terms. When rating an instrument on a category containing multiple terms, base your rating on the term you think best describes that instrument. You may feel that other terms in the category do not apply strongly to the sound in question, but this should not be factored into your rating.
For example, one of the categories is "brassy, metallic." There may be an instrument that you consider to be exceptionally metallic, but not particularly brassy. This instrument should still receive a high rating in this category, based on your perception of how metallic-sounding it is. Do not lower your rating because you do not consider the instrument to be brassy. Similarly, an instrument you would consider to be very brassy but not metallic should also receive a high rating in the "brassy, metallic" category, based on its brassiness.
Appendix C, Mean Ratings by Stimulus (per note)
| Pitch | Dynamic | airy/breathy | brassy/metallic | direct/loud | focused/compact | hollow | muted/veiled | nasal/reedy | open | percussive | pure/clear |
|---|---|---|---|---|---|---|---|---|---|---|---|
| C4 | pp | 2.85 | 1.15 | 2.69 | 4.08 | 2.85 | 2.46 | 4.54 | 3.92 | 1.00 | 4.00 |
| C4 | mm | 2.25 | 2.42 | 4.42 | 4.58 | 2.33 | 1.75 | 5.00 | 4.00 | 1.75 | 4.25 |
| C4 | ff | 2.93 | 1.86 | 3.86 | 4.79 | 2.71 | 2.29 | 4.71 | 4.29 | 1.29 | 3.71 |
| C#4 | pp | 3.54 | 1.31 | 1.46 | 4.23 | 2.85 | 2.54 | 3.54 | 2.85 | 1.23 | 3.77 |
| C#4 | mm | 2.75 | 2.17 | 3.17 | 3.67 | 2.58 | 2.00 | 4.00 | 4.08 | 1.42 | 3.75 |
| C#4 | ff | 1.69 | 1.46 | 4.62 | 4.23 | 1.77 | 1.77 | 4.62 | 4.23 | 1.23 | 4.38 |
| D4 | pp | 3.57 | 1.21 | 2.07 | 3.93 | 2.29 | 2.21 | 4.14 | 3.64 | 1.00 | 4.00 |
| D4 | mm | 2.92 | 1.54 | 3.62 | 4.46 | 2.46 | 2.23 | 4.38 | 4.00 | 1.38 | 4.38 |
| D4 | ff | 3.00 | 2.00 | 4.58 | 3.58 | 2.75 | 2.08 | 5.25 | 4.08 | 1.75 | 3.75 |
| A4 | pp | 4.69 | 1.69 | 1.69 | 4.46 | 3.46 | 2.23 | 4.85 | 3.77 | 1.46 | 3.08 |
| A4 | mm | 2.50 | 1.14 | 2.86 | 3.57 | 2.71 | 1.64 | 3.64 | 4.50 | 1.00 | 5.00 |
| A4 | ff | 3.31 | 2.08 | 4.23 | 4.15 | 2.77 | 2.46 | 5.54 | 4.23 | 1.38 | 4.15 |
| Bb4 | pp | 3.31 | 1.31 | 1.85 | 4.15 | 2.77 | 2.23 | 3.69 | 3.38 | 1.00 | 4.38 |
| Bb4 | mm | 3.00 | 1.69 | 2.00 | 4.15 | 2.38 | 1.85 | 3.69 | 4.23 | 1.08 | 4.00 |
| Bb4 | ff | 3.46 | 1.85 | 3.54 | 4.54 | 2.77 | 2.46 | 4.38 | 4.00 | 1.15 | 3.69 |
| B4 | pp | 4.08 | 1.25 | 1.58 | 4.17 | 3.33 | 2.00 | 3.58 | 4.00 | 1.00 | 4.25 |
| B4 | mm | 2.46 | 2.15 | 3.15 | 4.62 | 2.85 | 2.54 | 3.85 | 4.69 | 1.38 | 5.08 |
| B4 | ff | 3.21 | 1.50 | 2.57 | 4.43 | 2.43 | 2.00 | 4.21 | 3.57 | 1.29 | 4.71 |
| F5 | pp | 4.57 | 1.57 | 1.50 | 3.79 | 3.86 | 2.86 | 4.00 | 4.43 | 1.14 | 3.71 |
| F5 | mm | 3.08 | 1.38 | 1.62 | 3.85 | 2.77 | 1.69 | 3.69 | 4.46 | 1.00 | 4.62 |
| F5 | ff | 3.38 | 1.54 | 3.46 | 4.08 | 2.69 | 1.77 | 4.38 | 5.23 | 1.00 | 5.00 |
| F#5 | pp | 4.75 | 1.50 | 2.33 | 3.58 | 3.67 | 2.25 | 4.25 | 3.67 | 1.08 | 3.50 |
| F#5 | mm | 2.85 | 1.46 | 2.15 | 4.23 | 3.00 | 2.00 | 4.23 | 5.08 | 1.08 | 4.31 |
| F#5 | ff | 3.92 | 1.77 | 3.08 | 4.15 | 3.54 | 2.15 | 4.92 | 4.00 | 1.31 | 3.69 |
| G5 | pp | 4.14 | 1.50 | 1.14 | 3.14 | 3.79 | 2.50 | 3.86 | 4.29 | 1.07 | 4.50 |
| G5 | mm | 3.46 | 1.77 | 2.62 | 4.15 | 2.92 | 1.69 | 4.08 | 3.92 | 1.23 | 5.00 |
| G5 | ff | 3.23 | 3.15 | 4.85 | 3.38 | 3.23 | 1.54 | 5.77 | 4.08 | 1.54 | 4.85 |
| D6 | pp | 6.25 | 2.67 | 1.75 | 2.83 | 5.00 | 2.67 | 6.33 | 2.50 | 1.08 | 2.42 |
| D6 | mm | 3.75 | 2.33 | 3.75 | 4.67 | 2.92 | 2.25 | 4.17 | 4.17 | 1.00 | 4.08 |
| D6 | ff | 3.07 | 1.64 | 4.71 | 5.07 | 2.43 | 1.71 | 4.57 | 4.07 | 1.21 | 4.57 |
| Eb6 | pp | 5.46 | 1.77 | 2.08 | 3.15 | 4.00 | 2.31 | 4.92 | 3.69 | 1.23 | 2.85 |
| Eb6 | mm | 4.25 | 2.17 | 4.42 | 4.00 | 3.67 | 2.00 | 5.58 | 3.75 | 1.33 | 4.75 |
| Eb6 | ff | 3.46 | 1.69 | 5.23 | 5.31 | 2.69 | 1.46 | 5.85 | 3.92 | 1.38 | 4.31 |
| E6 | pp | 6.25 | 1.92 | 1.92 | 3.00 | 4.83 | 3.33 | 6.08 | 2.00 | 1.08 | 1.58 |
| E6 | mm | 4.14 | 2.14 | 4.36 | 4.50 | 3.43 | 1.86 | 5.36 | 3.93 | 1.14 | 3.43 |
| E6 | ff | 2.71 | 1.64 | 4.86 | 4.93 | 2.36 | 1.71 | 5.36 | 3.21 | 1.14 | 4.57 |
| Pitch | Dynamic | raspy/grainy | resonant/vibrant | ringing/long decay | rumbling/low | shrill/noisy | soft/singing | sparkling/brilliant | sustained/even | watery/fluid | woody |
|---|---|---|---|---|---|---|---|---|---|---|---|
| C4 | pp | 2.00 | 3.85 | 3.00 | 3.54 | 1.85 | 3.77 | 2.38 | 4.23 | 2.62 | 4.85 |
| C4 | mm | 2.42 | 3.92 | 3.75 | 4.42 | 1.83 | 2.42 | 2.33 | 5.00 | 2.42 | 4.75 |
| C4 | ff | 2.57 | 4.86 | 3.14 | 3.50 | 1.86 | 2.50 | 2.43 | 5.36 | 2.93 | 3.57 |
| C#4 | pp | 3.15 | 3.62 | 2.15 | 3.69 | 1.85 | 3.62 | 2.08 | 4.00 | 3.15 | 4.46 |
| C#4 | mm | 1.83 | 4.42 | 3.08 | 3.50 | 1.92 | 3.33 | 1.92 | 4.83 | 2.58 | 4.33 |
| C#4 | ff | 2.38 | 4.15 | 2.92 | 4.31 | 2.54 | 2.46 | 2.23 | 4.92 | 1.38 | 3.85 |
| D4 | pp | 1.64 | 3.29 | 2.64 | 1.86 | 1.79 | 4.07 | 2.14 | 4.71 | 2.64 | 4.00 |
| D4 | mm | 2.23 | 4.31 | 3.00 | 2.62 | 2.15 | 2.85 | 2.77 | 4.77 | 2.15 | 4.08 |
| D4 | ff | 3.00 | 4.08 | 2.58 | 3.92 | 2.92 | 2.00 | 2.08 | 4.25 | 2.08 | 4.33 |
| A4 | pp | 2.92 | 4.23 | 2.54 | 1.31 | 1.85 | 4.77 | 3.38 | 4.23 | 3.69 | 3.54 |
| A4 | mm | 1.64 | 4.57 | 3.57 | 1.57 | 2.21 | 4.93 | 3.64 | 4.21 | 3.64 | 4.21 |
| A4 | ff | 2.15 | 5.38 | 4.23 | 1.38 | 3.00 | 3.46 | 4.00 | 4.85 | 3.08 | 4.15 |
| Bb4 | pp | 2.31 | 4.46 | 3.46 | 1.46 | 2.15 | 5.38 | 4.00 | 4.54 | 3.77 | 3.15 |
| Bb4 | mm | 2.15 | 4.92 | 3.46 | 1.92 | 1.62 | 4.62 | 3.00 | 4.77 | 3.77 | 4.54 |
| Bb4 | ff | 2.00 | 4.62 | 2.92 | 2.31 | 2.54 | 3.69 | 4.00 | 4.31 | 3.15 | 4.00 |
| B4 | pp | 1.83 | 4.58 | 2.75 | 1.75 | 1.50 | 5.08 | 3.50 | 5.08 | 4.25 | 3.17 |
| B4 | mm | 1.69 | 4.69 | 4.23 | 1.69 | 1.77 | 5.46 | 4.62 | 5.23 | 4.08 | 4.15 |
| B4 | ff | 1.79 | 4.64 | 3.64 | 1.50 | 2.43 | 4.93 | 4.43 | 4.14 | 2.93 | 3.64 |
| F5 | pp | 2.79 | 3.57 | 3.71 | 1.43 | 2.43 | 6.00 | 4.21 | 4.14 | 4.00 | 3.00 |
| F5 | mm | 1.46 | 5.08 | 4.08 | 1.08 | 2.31 | 5.31 | 4.62 | 4.62 | 3.38 | 2.92 |
| F5 | ff | 2.23 | 5.62 | 4.00 | 1.38 | 3.38 | 4.15 | 4.85 | 5.00 | 3.54 | 3.54 |
| F#5 | pp | 2.50 | 3.33 | 3.00 | 1.17 | 2.33 | 5.08 | 3.92 | 4.58 | 3.08 | 2.75 |
| F#5 | mm | 2.31 | 4.31 | 2.54 | 1.15 | 2.46 | 4.77 | 3.92 | 4.00 | 3.62 | 3.54 |
| F#5 | ff | 2.77 | 3.77 | 3.15 | 1.31 | 3.15 | 2.85 | 3.31 | 4.46 | 2.31 | 4.15 |
| G5 | pp | 2.00 | 3.50 | 3.21 | 1.07 | 2.50 | 4.21 | 3.71 | 4.29 | 2.86 | 3.07 |
| G5 | mm | 1.54 | 4.85 | 3.92 | 1.46 | 3.31 | 4.62 | 5.31 | 4.92 | 3.15 | 3.00 |
| G5 | ff | 3.00 | 4.08 | 3.15 | 1.46 | 5.46 | 2.69 | 4.62 | 4.31 | 2.00 | 3.38 |
| D6 | pp | 3.42 | 2.67 | 2.50 | 1.00 | 4.83 | 3.67 | 3.92 | 3.08 | 2.33 | 2.50 |
| D6 | mm | 1.50 | 4.00 | 3.33 | 1.00 | 5.25 | 3.58 | 4.58 | 4.33 | 3.42 | 2.50 |
| D6 | ff | 1.93 | 5.14 | 4.07 | 1.14 | 5.57 | 4.00 | 5.36 | 4.71 | 3.00 | 2.71 |
| Eb6 | pp | 2.62 | 2.92 | 3.15 | 1.00 | 4.46 | 3.23 | 4.08 | 3.31 | 2.23 | 2.85 |
| Eb6 | mm | 2.67 | 4.42 | 3.83 | 1.00 | 5.75 | 2.50 | 4.92 | 4.33 | 2.17 | 2.25 |
| Eb6 | ff | 1.69 | 4.46 | 3.77 | 1.00 | 6.46 | 2.31 | 4.85 | 4.92 | 2.23 | 3.15 |
| E6 | pp | 3.33 | 2.33 | 2.50 | 1.00 | 5.33 | 2.33 | 3.00 | 2.17 | 2.83 | 2.92 |
| E6 | mm | 1.07 | 4.36 | 3.93 | 1.00 | 5.50 | 2.57 | 5.21 | 3.86 | 1.86 | 2.36 |
| E6 | ff | 1.86 | 4.64 | 3.43 | 1.00 | 5.43 | 2.36 | 5.14 | 4.36 | 2.36 | 2.57 |
| Pitch | Dynamic | airy/breathy | brassy/metallic | direct/loud | focused/compact | hollow | muted/veiled | nasal/reedy | open | percussive | pure/clear |
|---|---|---|---|---|---|---|---|---|---|---|---|
| Bb1 | pp | 2.83 | 4.83 | 2.17 | 3.08 | 2.75 | 2.67 | 3.92 | 4.17 | 1.83 | 3.42 |
| Bb1 | mm | 3.50 | 4.42 | 3.67 | 2.17 | 4.08 | 3.08 | 4.08 | 3.42 | 1.75 | 1.42 |
| Bb1 | ff | 2.30 | 6.10 | 6.20 | 2.10 | 2.20 | 1.90 | 3.40 | 3.90 | 2.70 | 1.80 |
| B1 | pp | 3.55 | 4.91 | 3.36 | 2.82 | 3.36 | 2.55 | 3.27 | 2.73 | 1.45 | 2.09 |
| B1 | mm | 3.00 | 5.45 | 4.55 | 2.36 | 3.18 | 2.64 | 3.36 | 2.36 | 1.45 | 1.64 |
| B1 | ff | 2.64 | 5.73 | 5.18 | 2.73 | 3.45 | 2.27 | 2.64 | 2.82 | 1.82 | 2.00 |
| C2 | pp | 3.73 | 5.09 | 3.09 | 2.91 | 4.00 | 4.27 | 3.64 | 3.09 | 1.27 | 1.91 |
| C2 | mm | 2.91 | 4.18 | 4.00 | 2.00 | 4.18 | 2.91 | 3.82 | 3.55 | 1.73 | 1.91 |
| C2 | ff | 2.25 | 5.33 | 5.75 | 2.83 | 3.25 | 1.83 | 4.33 | 2.92 | 2.17 | 1.50 |
| B2 | pp | 3.00 | 4.67 | 2.33 | 3.00 | 3.75 | 3.75 | 4.00 | 3.08 | 1.83 | 2.67 |
| B2 | mm | 3.27 | 4.73 | 3.82 | 2.09 | 3.45 | 3.55 | 5.09 | 2.45 | 1.55 | 1.64 |
| B2 | ff | 2.36 | 6.00 | 4.09 | 2.45 | 3.36 | 2.82 | 4.36 | 2.55 | 1.27 | 1.55 |
| C3 | pp | 2.45 | 4.82 | 2.00 | 3.18 | 3.36 | 3.00 | 2.45 | 3.55 | 1.45 | 3.36 |
| C3 | mm | 2.36 | 5.00 | 2.64 | 3.45 | 3.73 | 3.00 | 2.64 | 4.18 | 1.45 | 3.64 |
| C3 | ff | 2.30 | 5.50 | 4.70 | 2.80 | 2.80 | 2.50 | 2.70 | 3.90 | 1.40 | 2.90 |
| C#3 | pp | 2.20 | 4.40 | 2.20 | 3.70 | 3.90 | 3.80 | 2.80 | 3.90 | 1.10 | 4.20 |
| C#3 | mm | 2.58 | 5.17 | 4.75 | 3.00 | 2.67 | 2.83 | 3.67 | 3.92 | 1.33 | 2.50 |
| C#3 | ff | 2.91 | 6.27 | 5.00 | 3.45 | 2.73 | 2.45 | 3.91 | 3.91 | 1.45 | 2.64 |
| B3 | pp | 2.83 | 4.25 | 1.50 | 3.75 | 3.25 | 3.42 | 2.83 | 3.75 | 1.08 | 4.58 |
| B3 | mm | 2.36 | 5.18 | 4.09 | 3.36 | 2.18 | 2.00 | 3.27 | 3.45 | 1.36 | 4.09 |
| B3 | ff | 3.30 | 6.70 | 6.80 | 2.40 | 1.80 | 1.50 | 5.60 | 3.70 | 1.70 | 1.50 |
| C4 | pp | 2.64 | 4.00 | 1.45 | 3.73 | 3.27 | 2.82 | 2.91 | 3.36 | 1.18 | 3.45 |
| C4 | mm | 2.64 | 5.27 | 2.64 | 4.55 | 3.00 | 2.82 | 2.73 | 4.09 | 1.09 | 4.73 |
| C4 | ff | 2.25 | 5.75 | 4.92 | 3.92 | 2.50 | 2.08 | 3.92 | 3.67 | 1.67 | 3.08 |
| C#4 | pp | 3.10 | 4.00 | 2.00 | 3.10 | 3.40 | 3.20 | 2.70 | 4.00 | 1.00 | 4.20 |
| C#4 | mm | 2.45 | 4.64 | 2.82 | 4.91 | 2.09 | 2.64 | 2.36 | 4.18 | 1.09 | 5.27 |
| C#4 | ff | 2.00 | 6.00 | 5.80 | 3.10 | 2.70 | 1.80 | 5.60 | 3.80 | 1.70 | 1.80 |
| C5 | pp | 3.00 | 3.90 | 1.30 | 3.70 | 3.50 | 3.80 | 4.80 | 3.20 | 1.60 | 3.30 |
| C5 | mm | 2.45 | 5.73 | 5.09 | 3.73 | 1.91 | 2.27 | 3.09 | 4.27 | 1.18 | 4.27 |
| C5 | ff | 2.00 | 6.20 | 5.90 | 3.00 | 1.60 | 1.50 | 4.80 | 3.10 | 1.80 | 2.80 |
| C#5 | pp | 4.36 | 4.91 | 2.27 | 3.55 | 3.73 | 4.91 | 5.09 | 3.45 | 1.27 | 3.55 |
| C#5 | mm | 1.73 | 4.91 | 4.64 | 4.91 | 2.55 | 2.27 | 4.18 | 3.91 | 1.45 | 4.27 |
| C#5 | ff | 2.42 | 6.33 | 6.83 | 3.58 | 2.92 | 2.17 | 5.50 | 4.00 | 1.67 | 3.50 |
| D5 | pp | 3.18 | 4.64 | 2.55 | 3.45 | 2.55 | 3.82 | 3.27 | 4.00 | 1.27 | 4.36 |
| D5 | mm | 2.00 | 5.73 | 5.64 | 4.27 | 2.82 | 2.64 | 3.55 | 4.82 | 1.55 | 4.64 |
| D5 | ff | 2.73 | 6.91 | 6.82 | 2.64 | 1.91 | 1.73 | 5.09 | 3.82 | 2.09 | 3.09 |
| Pitch | Dynamic | raspy/grainy | resonant/vibrant | ringing/long decay | rumbling/low | shrill/noisy | soft/singing | sparkling/brilliant | sustained/even | watery/fluid | woody |
|---|---|---|---|---|---|---|---|---|---|---|---|
| Bb1 | pp | 4.33 | 3.58 | 2.92 | 6.25 | 1.83 | 2.50 | 1.67 | 3.50 | 2.67 | 2.50 |
| Bb1 | mm | 5.00 | 1.92 | 2.17 | 6.75 | 2.42 | 1.25 | 1.17 | 2.00 | 1.33 | 2.67 |
| Bb1 | ff | 5.90 | 3.10 | 2.70 | 6.90 | 4.10 | 1.10 | 1.70 | 3.00 | 1.50 | 1.40 |
| B1 | pp | 4.55 | 2.18 | 2.73 | 5.91 | 1.64 | 1.91 | 1.73 | 2.64 | 2.64 | 2.36 |
| B1 | mm | 5.82 | 2.64 | 2.82 | 6.18 | 2.91 | 1.00 | 1.45 | 2.55 | 1.91 | 2.00 |
| B1 | ff | 5.64 | 2.64 | 2.55 | 6.18 | 3.00 | 1.18 | 1.55 | 2.82 | 2.27 | 1.64 |
| C2 | pp | 4.91 | 2.09 | 2.18 | 6.18 | 2.18 | 2.00 | 1.45 | 2.73 | 2.45 | 2.00 |
| C2 | mm | 5.09 | 2.45 | 1.82 | 6.27 | 2.73 | 1.36 | 1.45 | 2.45 | 1.91 | 2.73 |
| C2 | ff | 6.58 | 2.00 | 2.75 | 6.42 | 5.00 | 1.00 | 1.25 | 2.58 | 1.42 | 2.00 |
| B2 | pp | 3.33 | 3.17 | 3.25 | 3.75 | 2.17 | 2.75 | 2.08 | 3.17 | 2.50 | 2.17 |
| B2 | mm | 4.45 | 2.27 | 2.00 | 4.00 | 3.18 | 1.45 | 1.45 | 2.00 | 1.73 | 2.27 |
| B2 | ff | 4.36 | 2.18 | 2.55 | 4.73 | 3.18 | 1.73 | 1.64 | 2.45 | 1.64 | 1.73 |
| C3 | pp | 2.27 | 3.91 | 2.91 | 3.00 | 1.64 | 3.64 | 2.45 | 4.27 | 3.18 | 1.64 |
| C3 | mm | 2.73 | 3.36 | 2.82 | 4.45 | 2.09 | 3.27 | 2.45 | 4.45 | 2.18 | 2.00 |
| C3 | ff | 3.80 | 3.20 | 2.60 | 5.30 | 2.60 | 2.00 | 1.90 | 4.20 | 1.90 | 1.60 |
| C#3 | pp | 2.70 | 4.20 | 3.30 | 2.80 | 1.20 | 4.70 | 2.00 | 4.40 | 2.00 | 2.60 |
| C#3 | mm | 3.75 | 3.00 | 2.50 | 5.08 | 3.42 | 1.50 | 1.83 | 4.00 | 1.50 | 2.42 |
| C#3 | ff | 4.64 | 2.91 | 2.64 | 5.00 | 4.82 | 1.64 | 2.73 | 3.45 | 1.64 | 1.73 |
| B3 | pp | 2.25 | 3.67 | 4.50 | 2.58 | 1.42 | 4.25 | 3.50 | 4.25 | 2.83 | 2.33 |
| B3 | mm | 2.55 | 4.00 | 3.45 | 2.91 | 2.09 | 3.27 | 3.55 | 4.45 | 2.00 | 1.64 |
| B3 | ff | 5.90 | 3.30 | 3.40 | 4.60 | 6.60 | 1.20 | 2.40 | 2.90 | 1.70 | 1.40 |
| C4 | pp | 2.36 | 3.18 | 3.55 | 2.73 | 1.55 | 4.27 | 2.64 | 3.36 | 3.27 | 1.27 |
| C4 | mm | 2.55 | 4.45 | 4.00 | 2.45 | 1.64 | 3.82 | 4.09 | 5.00 | 2.82 | 1.36 |
| C4 | ff | 2.92 | 3.25 | 2.92 | 2.67 | 4.25 | 1.58 | 2.33 | 4.00 | 1.42 | 1.58 |
| C#4 | pp | 2.20 | 4.40 | 3.80 | 2.50 | 1.60 | 4.70 | 3.50 | 4.10 | 4.00 | 1.00 |
| C#4 | mm | 1.82 | 4.00 | 3.82 | 2.82 | 1.91 | 4.27 | 3.73 | 5.18 | 3.36 | 1.36 |
| C#4 | ff | 4.50 | 2.70 | 2.00 | 3.50 | 5.70 | 1.20 | 1.40 | 2.60 | 1.50 | 1.70 |
| C5 | pp | 2.60 | 3.00 | 3.00 | 1.30 | 1.50 | 4.70 | 2.70 | 3.90 | 2.60 | 2.10 |
| C5 | mm | 1.64 | 4.82 | 3.18 | 1.36 | 2.64 | 3.09 | 4.00 | 4.36 | 2.64 | 1.27 |
| C5 | ff | 3.70 | 2.70 | 3.50 | 2.20 | 5.20 | 1.30 | 3.20 | 3.30 | 1.30 | 1.30 |
| C#5 | pp | 3.64 | 2.91 | 2.82 | 1.09 | 3.00 | 4.45 | 3.73 | 3.64 | 2.73 | 1.73 |
| C#5 | mm | 2.00 | 3.45 | 3.73 | 1.45 | 4.00 | 2.73 | 4.27 | 4.64 | 2.00 | 1.45 |
| C#5 | ff | 3.83 | 4.08 | 3.83 | 2.08 | 6.58 | 1.42 | 4.42 | 3.92 | 2.08 | 1.67 |
| D5 | pp | 1.73 | 3.45 | 3.18 | 1.36 | 2.09 | 4.09 | 3.27 | 4.18 | 2.55 | 1.64 |
| D5 | mm | 2.27 | 4.64 | 4.09 | 1.73 | 4.27 | 2.45 | 4.82 | 5.00 | 2.27 | 1.64 |
| D5 | ff | 3.18 | 3.64 | 4.09 | 2.00 | 6.73 | 1.18 | 3.91 | 4.27 | 1.45 | 1.27 |
Appendix D, Rating means by register and dynamic
| Register | Low | Middle 1 | Middle 2 | High | Low | Middle 1 | Middle 2 | High | Low | Middle 1 | Middle 2 | High |
|---|---|---|---|---|---|---|---|---|---|---|---|---|
| Dynamic | pp | pp | pp | pp | mm | mm | mm | mm | ff | ff | ff | ff |
| airy/breathy | 3.32 | 4.03 | 4.49 | 5.99 | 2.64 | 2.65 | 3.13 | 4.05 | 2.54 | 3.33 | 3.51 | 3.08 |
| brassy/metallic | 1.22 | 1.42 | 1.52 | 2.12 | 2.04 | 1.66 | 1.54 | 2.21 | 1.77 | 1.81 | 2.15 | 1.66 |
| direct/loud | 2.07 | 1.71 | 1.66 | 1.92 | 3.74 | 2.67 | 2.13 | 4.18 | 4.35 | 3.45 | 3.80 | 4.93 |
| focused/compact | 4.08 | 4.26 | 3.50 | 2.99 | 4.24 | 4.11 | 4.08 | 4.39 | 4.20 | 4.37 | 3.87 | 5.10 |
| hollow | 2.66 | 3.19 | 3.77 | 4.61 | 2.46 | 2.65 | 2.90 | 3.34 | 2.41 | 2.66 | 3.15 | 2.49 |
| muted/veiled | 2.40 | 2.15 | 2.54 | 2.77 | 1.99 | 2.01 | 1.79 | 2.04 | 2.05 | 2.31 | 1.82 | 1.63 |
| nasal/reedy | 4.07 | 4.04 | 4.04 | 5.78 | 4.46 | 3.73 | 4.00 | 5.04 | 4.86 | 4.71 | 5.02 | 5.26 |
| open | 3.47 | 3.72 | 4.13 | 2.73 | 4.03 | 4.47 | 4.49 | 3.95 | 4.20 | 3.93 | 4.44 | 3.73 |
| percussive | 1.08 | 1.15 | 1.10 | 1.13 | 1.52 | 1.15 | 1.10 | 1.16 | 1.42 | 1.27 | 1.28 | 1.24 |
| pure/clear | 3.92 | 3.90 | 3.90 | 2.28 | 4.13 | 4.69 | 4.64 | 4.09 | 3.95 | 4.18 | 4.51 | 4.48 |
| raspy/grainy | 2.26 | 2.35 | 2.43 | 3.12 | 2.16 | 1.83 | 1.77 | 1.75 | 2.65 | 1.98 | 2.67 | 1.83 |
| resonant/vibrant | 3.59 | 4.42 | 3.47 | 2.64 | 4.22 | 4.73 | 4.75 | 4.26 | 4.36 | 4.88 | 4.49 | 4.75 |
| ringing/long decay | 2.60 | 2.92 | 3.31 | 2.72 | 3.28 | 3.75 | 3.51 | 3.70 | 2.88 | 3.60 | 3.43 | 3.76 |
| rumbling/low | 3.03 | 1.51 | 1.22 | 1.00 | 3.51 | 1.73 | 1.23 | 1.00 | 3.91 | 1.73 | 1.38 | 1.05 |
| shrill/noisy | 1.83 | 1.83 | 2.42 | 4.87 | 1.97 | 1.87 | 2.69 | 5.50 | 2.44 | 2.66 | 4.00 | 5.82 |
| soft/singing | 3.82 | 5.08 | 5.10 | 3.08 | 2.87 | 5.00 | 4.90 | 2.88 | 2.32 | 4.03 | 3.23 | 2.89 |
| sparkling/brilliant | 2.20 | 3.63 | 3.95 | 3.67 | 2.34 | 3.75 | 4.62 | 4.90 | 2.25 | 4.14 | 4.26 | 5.12 |
| sustained/even | 4.31 | 4.62 | 4.34 | 2.85 | 4.87 | 4.74 | 4.51 | 4.17 | 4.84 | 4.43 | 4.59 | 4.66 |
| watery/fluid | 2.80 | 3.90 | 3.31 | 2.46 | 2.38 | 3.83 | 3.38 | 2.48 | 2.13 | 3.05 | 2.62 | 2.53 |
| woody | 4.44 | 3.29 | 2.94 | 2.76 | 4.39 | 4.30 | 3.15 | 2.37 | 3.92 | 3.93 | 3.69 | 2.81 |
| Register | Low | Middle 1 | Middle 2 | High | Low | Middle 1 | Middle 2 | High | Low | Middle 1 | Middle 2 | High |
|---|---|---|---|---|---|---|---|---|---|---|---|---|
| Dynamic | pp | pp | pp | pp | mm | mm | mm | mm | ff | ff | ff | ff |
| airy/breathy | 3.37 | 2.55 | 2.86 | 3.52 | 3.14 | 2.74 | 2.48 | 2.06 | 2.40 | 2.52 | 2.52 | 2.38 |
| brassy/metallic | 4.94 | 4.63 | 4.08 | 4.48 | 4.68 | 4.96 | 5.03 | 5.45 | 5.72 | 5.92 | 6.15 | 6.48 |
| direct/loud | 2.87 | 2.18 | 1.65 | 2.04 | 4.07 | 3.73 | 3.18 | 5.12 | 5.71 | 4.60 | 5.84 | 6.52 |
| focused/compact | 2.94 | 3.29 | 3.53 | 3.57 | 2.18 | 2.85 | 4.27 | 4.30 | 2.55 | 2.90 | 3.14 | 3.07 |
| hollow | 3.37 | 3.67 | 3.31 | 3.26 | 3.82 | 3.28 | 2.42 | 2.42 | 2.97 | 2.96 | 2.33 | 2.14 |
| muted/veiled | 3.16 | 3.52 | 3.14 | 4.18 | 2.88 | 3.13 | 2.48 | 2.39 | 2.00 | 2.59 | 1.79 | 1.80 |
| nasal/reedy | 3.61 | 3.08 | 2.81 | 4.39 | 3.76 | 3.80 | 2.79 | 3.61 | 3.46 | 3.66 | 5.04 | 5.13 |
| open | 3.33 | 3.51 | 3.70 | 3.55 | 3.11 | 3.52 | 3.91 | 4.33 | 3.21 | 3.45 | 3.72 | 3.64 |
| percussive | 1.52 | 1.46 | 1.09 | 1.38 | 1.64 | 1.44 | 1.18 | 1.39 | 2.23 | 1.38 | 1.69 | 1.85 |
| pure/clear | 2.47 | 3.41 | 4.08 | 3.74 | 1.65 | 2.59 | 4.70 | 4.39 | 1.77 | 2.36 | 2.13 | 3.13 |
| raspy/grainy | 4.60 | 2.77 | 2.27 | 2.65 | 5.30 | 3.64 | 2.30 | 1.97 | 6.04 | 4.27 | 4.44 | 3.57 |
| resonant/vibrant | 2.62 | 3.76 | 3.75 | 3.12 | 2.34 | 2.88 | 4.15 | 4.30 | 2.58 | 2.76 | 3.08 | 3.47 |
| ringing/long decay | 2.61 | 3.15 | 3.95 | 3.00 | 2.27 | 2.44 | 3.76 | 3.67 | 2.67 | 2.59 | 2.77 | 3.81 |
| rumbling/low | 6.11 | 3.18 | 2.60 | 1.25 | 6.40 | 4.51 | 2.73 | 1.52 | 6.50 | 5.01 | 3.59 | 2.09 |
| shrill/noisy | 1.88 | 1.67 | 1.52 | 2.20 | 2.68 | 2.90 | 1.88 | 3.64 | 4.03 | 3.53 | 5.52 | 6.17 |
| soft/singing | 2.14 | 3.70 | 4.41 | 4.42 | 1.20 | 2.08 | 3.79 | 2.76 | 1.09 | 1.79 | 1.33 | 1.30 |
| sparkling/brilliant | 1.62 | 2.18 | 3.21 | 3.23 | 1.36 | 1.91 | 3.79 | 4.36 | 1.50 | 2.09 | 2.04 | 3.84 |
| sustained/even | 2.95 | 3.95 | 3.90 | 3.91 | 2.33 | 3.48 | 4.88 | 4.67 | 2.80 | 3.37 | 3.17 | 3.83 |
| watery/fluid | 2.59 | 2.56 | 3.37 | 2.62 | 1.72 | 1.80 | 2.73 | 2.30 | 1.73 | 1.72 | 1.54 | 1.61 |
| woody | 2.29 | 2.13 | 1.54 | 1.82 | 2.46 | 2.23 | 1.45 | 1.45 | 1.68 | 1.68 | 1.56 | 1.41 |
Appendix E, Radar plots by instrument and register-dynamic combination
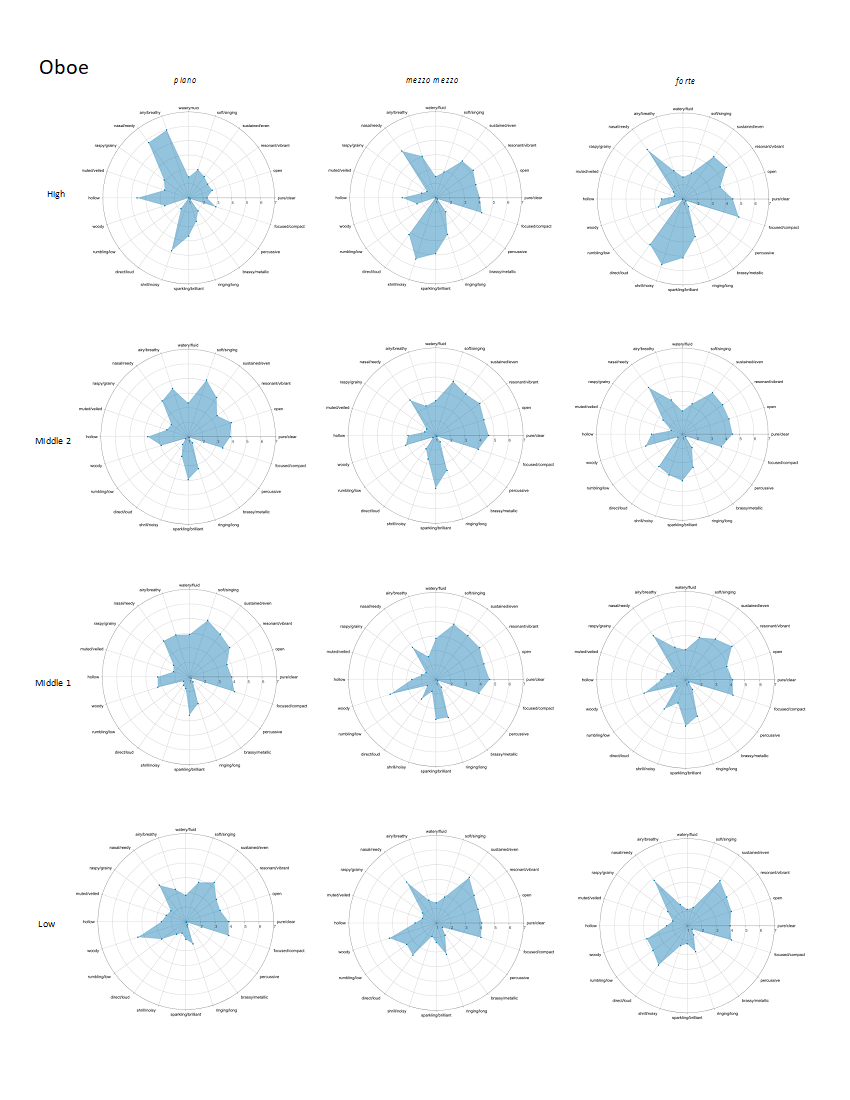

Appendix F, Exploratory Factor Analyses
| Factor 1 | Factor 2 | Factor 3 | Factor 4 | Factor 5 | |
|---|---|---|---|---|---|
| Airy/Breathy | -0.23 | 0.70* | 0.13 | -0.06 | -0.04 |
| Brassy/Metallic | -0.05 | 0.11 | -0.05 | 0.00 | 0.61* |
| Direct/Loud | 0.50* | 0.11 | -0.55* | 0.09 | 0.06 |
| Focused/Compact | 0.43 | -0.07 | -0.05 | 0.05 | -0.02 |
| Hollow | -0.12 | 0.56* | 0.09 | 0.05 | 0.02 |
| Muted/Veiled | -0.13 | 0.21 | 0.20 | 0.22 | -0.03 |
| Nasal/Reedy | 0.08 | 0.66* | -0.37 | 0.07 | -0.19 |
| Open | 0.55* | 0.02 | 0.11 | 0.12 | -0.04 |
| Percussive | -0.11 | -0.19 | 0.00 | 0.10 | 0.82* |
| Pure/Clear | 0.63* | -0.23 | 0.11 | 0.00 | -0.06 |
| Raspy/Grainy | -0.09 | 0.47 | -0.09 | 0.25 | 0.09 |
| Resonant | 0.66* | -0.17 | 0.09 | -0.07 | 0.02 |
| Ringing/Long | 0.41 | 0.20 | 0.15 | -0.02 | 0.19 |
| Rumbling/Low | 0.26 | -0.11 | -0.12 | 0.63* | 0.21 |
| Shrill/Noisy | 0.07 | 0.58* | -0.41 | -0.29 | 0.02 |
| Soft/Singing | 0.22 | -0.10 | 0.71* | -0.20 | 0.01 |
| Sparkling/Brilliant | 0.44 | 0.33 | 0.17 | -0.48 | 0.04 |
| Sustained/Even | 0.75* | -0.20 | 0.01 | 0.14 | -0.16 |
| Watery/Fluid | 0.32 | 0.08 | 0.52* | 0.07 | -0.03 |
| Woody | 0.11 | 0.30 | 0.00 | 0.54* | -0.07 |
| Factor 1 | Factor 2 | Factor 3 | Factor 4 | Factor 5 | |
|---|---|---|---|---|---|
| Airy/Breathy | -0.04 | 0.04 | 0.68* | -0.01 | 0.07 |
| Brassy/Metallic | 0.26 | 0.40 | 0.05 | 0.32 | -0.59* |
| Direct/Loud | 0.18 | 0.68* | -0.21 | 0.19 | -0.01 |
| Focused/Compact | 0.48 | 0.07 | 0.12 | -0.12 | -0.09 |
| Hollow | -0.05 | -0.13 | 0.61* | 0.21 | 0.05 |
| Muted/Veiled | 0.18 | -0.13 | 0.76* | 0.11 | -0.03 |
| Nasal/Reedy | -0.22 | 0.60* | 0.34 | -0.18 | 0.06 |
| Open | 0.68* | -0.07 | -0.12 | 0.24 | 0.17 |
| Percussive | 0.12 | 0.24 | -0.06 | 0.05 | 0.38 |
| Pure/Clear | 0.63* | -0.14 | -0.09 | -0.27 | 0.01 |
| Raspy/Grainy | -0.13 | 0.28 | 0.36 | 0.52* | 0.03 |
| Resonant | 0.80* | 0.01 | -0.13 | 0.03 | 0.08 |
| Ringing/Long | 0.61 | 0.14 | 0.18 | -0.02 | -0.02 |
| Rumbling/Low | 0.03 | -0.08 | 0.14 | 0.77* | 0.01 |
| Shrill/Noisy | 0.00 | 0.94* | -0.13 | -0.21 | 0.11 |
| Soft/Singing | 0.24 | -0.39 | 0.18 | -0.37 | -0.02 |
| Sparkling/Brilliant | 0.47 | 0.28 | -0.03 | -0.47 | -0.05 |
| Sustained/Even | 0.82* | -0.13 | -0.10 | 0.11 | -0.03 |
| Watery/Fluid | 0.38 | -0.12 | 0.23 | -0.13 | 0.07 |
| Woody | 0.03 | -0.02 | 0.23 | 0.08 | 0.61* |
Appendix G, Partial Proportional Odds Regression Models
| Descriptor | Estimate | std.error | z value | p value | Significance |
|---|---|---|---|---|---|
| brassy/metallic | -0.06 | 0.09 | -0.65 | 0.52 | |
| focused/compact | 0.15 | 0.08 | 1.96 | 0.05 | |
| hollow | -0.17 | 0.07 | -2.28 | 0.02 | * |
| muted/veiled | 0.03 | 0.09 | 0.31 | 0.76 | |
| nasal/reedy | 0.04 | 0.07 | 0.56 | 0.57 | |
| open | 0.01 | 0.07 | 0.12 | 0.90 | |
| percussive | 0.13 | 0.18 | 0.72 | 0.47 | |
| pure/clear | 0.07 | 0.08 | 0.85 | 0.39 | |
| resonant/vibrant | 0.35 | 0.09 | 4.06 | 0.00 | *** |
| ringing/long decay | 0.01 | 0.07 | 0.20 | 0.84 | |
| rumbling/low | -0.15 | 0.08 | -1.79 | 0.07 | |
| shrill/noisy | 0.09 | 0.07 | 1.32 | 0.19 | |
| soft/singing | -0.21 | 0.07 | -2.86 | 0.00 | ** |
| sparkling/brilliant | 0.05 | 0.07 | 0.70 | 0.48 | |
| sustained/even | -0.20 | 0.09 | -2.23 | 0.03 | * |
| watery/fluid | -0.13 | 0.07 | -1.75 | 0.08 | |
| woody | 0.16 | 0.06 | 2.61 | 0.01 | ** |
| p|m (Intercept) | 0.02 | 0.75 | 0.02 | 0.98 | |
| m|f (Intercept) | 2.46 | 0.76 | 3.23 | 0.00 | ** |
| p|m direct/loud | -0.54 | 0.10 | -5.51 | 0.00 | *** |
| m|f direct/loud | -0.36 | 0.08 | -4.41 | 0.00 | *** |
| p|m airy/breathy | 0.37 | 0.09 | 4.27 | 0.00 | *** |
| m|f airy/breathy | 0.20 | 0.08 | 2.48 | 0.01 | * |
| p|m raspy/grainy | 0.06 | 0.09 | 0.62 | 0.53 | |
| m|f raspy/grainy | -0.11 | 0.09 | -1.26 | 0.21 |
| Descriptor | Estimate | std.error | z value | p value | Significance |
|---|---|---|---|---|---|
| airy/breathy | 0.051 | 0.092 | 0.549 | 0.583 | |
| focused/compact | -0.035 | 0.084 | -0.411 | 0.681 | |
| hollow | -0.029 | 0.080 | -0.362 | 0.718 | |
| muted/veiled | -0.295 | 0.088 | -3.360 | 0.001 | *** |
| nasal/reedy | -0.142 | 0.073 | -1.936 | 0.053 | |
| open | -0.024 | 0.091 | -0.269 | 0.788 | |
| percussive | 0.016 | 0.113 | 0.145 | 0.884 | |
| pure/clear | -0.035 | 0.108 | -0.329 | 0.742 | |
| raspy/grainy | 0.160 | 0.086 | 1.863 | 0.062 | |
| resonant | -0.075 | 0.102 | -0.734 | 0.463 | |
| ringing/long decay | -0.004 | 0.085 | -0.048 | 0.962 | |
| rumbling/low | -0.101 | 0.070 | -1.453 | 0.146 | |
| shrill/noisy | 0.346 | 0.083 | 4.197 | 0.000 | *** |
| soft/singing | -0.287 | 0.103 | -2.789 | 0.005 | ** |
| sparkling/brilliant | 0.053 | 0.103 | 0.518 | 0.605 | |
| sustained/even | 0.092 | 0.103 | 0.891 | 0.373 | |
| watery/fluid | -0.201 | 0.100 | -2.010 | 0.044 | * |
| woody | 0.069 | 0.107 | 0.644 | 0.520 | |
| p|m (Intercept) | -0.666 | 0.727 | -0.917 | 0.359 | |
| m|f (Intercept) | 2.367 | 0.854 | 2.773 | 0.006 | ** |
| p|m direct/loud | -0.570 | 0.097 | -5.860 | 0.000 | *** |
| m|f direct/loud | -0.325 | 0.089 | -3.653 | 0.000 | *** |
| p|m brassy/metallic | 0.071 | 0.101 | 0.706 | 0.480 | |
| m|f brassy/metallic | -0.180 | 0.115 | -1.565 | 0.118 |
| Descriptor | Estimate | std.error | z value | p value | Significance |
|---|---|---|---|---|---|
| airy/breathy | 0.164 | 0.084 | 1.954 | 0.051 | |
| brassy/metallic | -0.129 | 0.105 | -1.229 | 0.219 | |
| direct/loud | -0.070 | 0.079 | -0.885 | 0.376 | |
| focused/compact | 0.022 | 0.085 | 0.254 | 0.800 | |
| hollow | 0.045 | 0.081 | 0.560 | 0.576 | |
| muted/veiled | 0.204 | 0.098 | 2.076 | 0.038 | * |
| nasal/reedy | -0.183 | 0.080 | -2.279 | 0.023 | * |
| percussive | 0.231 | 0.229 | 1.011 | 0.312 | |
| pure/clear | 0.056 | 0.091 | 0.610 | 0.542 | |
| raspy/grainy | -0.301 | 0.095 | -3.181 | 0.001 | *** |
| ringing/long decay | 0.079 | 0.081 | 0.972 | 0.331 | |
| rumbling/low | -1.020 | 0.122 | -8.346 | 0.000 | *** |
| shrill/noisy | 0.859 | 0.092 | 9.364 | 0.000 | *** |
| sparkling/brilliant | 0.374 | 0.082 | 4.542 | 0.000 | *** |
| sustained/even | -0.151 | 0.098 | -1.532 | 0.125 | |
| watery/fluid | 0.107 | 0.080 | 1.326 | 0.185 | |
| low|middle1 (Intercept) | 1.516 | 0.968 | 1.566 | 0.117 | |
| middle1|middle2 (Intercept) | -0.106 | 0.932 | -0.113 | 0.910 | |
| middle2|high (Intercept) | -0.012 | 0.972 | -0.013 | 0.990 | |
| low|middle1 soft/singing | -0.353 | 0.107 | -3.312 | 0.001 | |
| middle1|middle2 soft/singing | 0.039 | 0.095 | 0.411 | 0.681 | |
| middle2|high soft/singing | 0.278 | 0.101 | 2.764 | 0.006 | ** |
| low|middle1 woody | 0.103 | 0.093 | 1.111 | 0.267 | |
| middle1|middle2 woody | 0.329 | 0.085 | 3.852 | 0.000 | *** |
| middle2|high woody | 0.462 | 0.100 | 4.624 | 0.000 | *** |
| low|middle1 resonant/vibrant | -0.205 | 0.137 | -1.502 | 0.133 | |
| middle1|middle2 resonant/vibrant | 0.265 | 0.121 | 2.190 | 0.029 | * |
| middle2|high resonant/vibrant | 0.153 | 0.126 | 1.212 | 0.225 | |
| low|middle1 open | 0.004 | 0.121 | 0.036 | 0.972 | |
| middle1|middle2 open | -0.061 | 0.107 | -0.567 | 0.571 | |
| middle2|high open | 0.352 | 0.117 | 2.995 | 0.003 | ** |
| Descriptor | Estimate | std.error | z value | p value | Significance |
|---|---|---|---|---|---|
| airy/breathy | -0.104 | 0.092 | -1.136 | 0.256 | |
| direct/loud | 0.360 | 0.089 | 4.041 | 0.000 | *** |
| focused/compact | 0.093 | 0.082 | 1.132 | 0.258 | |
| hollow | -0.023 | 0.082 | -0.276 | 0.782 | |
| nasal/reedy | 0.259 | 0.074 | 3.498 | 0.000 | *** |
| open | 0.212 | 0.094 | 2.258 | 0.024 | * |
| percussive | -0.150 | 0.125 | -1.202 | 0.230 | |
| pure/clear | 0.038 | 0.104 | 0.362 | 0.717 | |
| raspy/grainy | -0.348 | 0.090 | -3.885 | 0.000 | *** |
| resonant/vibrant | -0.301 | 0.102 | -2.950 | 0.003 | ** |
| ringing/long decay | 0.068 | 0.084 | 0.816 | 0.414 | |
| rumbling/low | -0.890 | 0.091 | -9.745 | 0.000 | *** |
| shrill/noisy | 0.251 | 0.088 | 2.840 | 0.005 | ** |
| soft/singing | 0.272 | 0.104 | 2.606 | 0.009 | ** |
| sparkling/brilliant | 0.454 | 0.104 | 4.373 | 0.000 | *** |
| sustained/even | -0.034 | 0.103 | -0.332 | 0.740 | |
| watery/fluid | -0.220 | 0.101 | -2.189 | 0.029 | * |
| woody | -0.002 | 0.111 | -0.018 | 0.985 | |
| low|middle1 (Intercept) | -2.167 | 0.974 | -2.224 | 0.026 | * |
| middle1|middle2 (Intercept) | 0.011 | 0.885 | 0.012 | 0.990 | |
| middle2|high (Intercept) | 3.177 | 0.991 | 3.204 | 0.001 | ** |
| low|middle1. brassy/metallic | -0.110 | 0.123 | -0.894 | 0.371 | |
| middle1|middle2 brassy/metallic | -0.114 | 0.114 | -0.997 | 0.319 | |
| middle2|high brassy/metallic | -0.059 | 0.127 | -0.467 | 0.641 | |
| low|middle1 muted/veiled | -0.099 | 0.121 | -0.817 | 0.414 | |
| middle1|middle2 muted/veiled | 0.058 | 0.104 | 0.555 | 0.579 | |
| middle2|high muted/veiled | -0.220 | 0.114 | -1.924 | 0.054 |
