
WHEN music and language occur simultaneously, music seems to affect language-processing in a contradictory way that resembles the way stylistic features are known to affect language-processing. The use of these features (e.g., rhyme, meter, imagery), which is called foregrounding, disturbs language-processing but accentuates specific words, with several positive effects (Miall & Kuiken, 1994, among others), dependent on the extent to which the reader is able to overcome the disturbances (Hakemulder, 2004; Shen, 2007). The Musical Foregrounding Hypothesis (MFH, Schotanus, 2015) states that singing is also a kind of foregrounding. This 'musical foregrounding' simultaneously disturbs the processing of the text and draws attention to it, and subsequently enhances lyric appreciation, comprehension, and recall, dependent on the extent to which the listener is able to overcome this disturbance. Several sub-hypotheses, derived from the MFH, are at stake in the current study.
There are, of course, important differences between stylistic rhetorical features and music. For example, stylistic features cannot facilitate prosodic processing without hampering ease of semantic comprehension (Menninghaus et al., 2015), but music can do so, because adding music does not involve a change in word choice or word order. On the other hand, music is something far more complex than a rhetorical feature, so adding music might still hamper linguistic processing in other ways, if only because music-listening is a demanding process of anticipating upcoming musical events (Huron, 2006). Several processes, both positive and negative, may be taking place.
Mapping and understanding all these processes is of interest to education, advertising, music therapy, poetics, and several fields of science. The main aims of this study are to show that MF, unlike other interactions between music-processing and language-processing (Patel, 2011, 2014), does not require multiple exposure to show beneficial effects, and to distinguish between the effects of singing and accompaniment compared to speech.
An important difference between a-cappella and accompanied songs is the amount of silence. In a-cappella singing, silences are unavoidable. However, brief, music-embedded silences can cause an increased amount of brain activity and a high attention level (Ladinig, Honing, Hááden, and Winkler, 2009; Sridharan, Levitin, Chafe, Berger and Menon, 2007; Winkler, Háden, Ladinig, Sziller and Honing, 2009), which may cause MF. Such silences can also be extra demanding if they occur in the middle of a linguistic phrase and if longer silences hamper the perception of the song as one sound stream (Huron, 2016). Finally, if there are too many silences, beat induction may be impaired, and subsequently dynamic attending (Jones, 1976) may be impaired too.
If an accompaniment fills in the gaps, it reduces the MF caused by the silences in the vocal part, but at the same time it increases MF as it increases the number of distracting events. It can enhance beat induction, induce arousal, and make the song feel more energetic (Thompson, Schellenberg, & Husain, 2001), which simultaneously distracts from and draws attention to the lyrics, not only during voiceless intervals, but also during long notes or phrases that are sung softly.
An accompaniment can also reduce MF because it can convey a full harmony sound, whereas a single voice can only produce one tone at a time. As Western tonal melodies imply harmonies (Kim, 2013; Kim et al., 2018), music-processing will be hampered in a-cappella songs, especially in the case of a relatively complex modulating melody (cf. Poulin-Charronnat, Bigand, Madurell, & Peereman, 2005). This will cause MF, and it will make the singing sound less in tune, and the voice less at ease.
Finally, an accompaniment can accentuate linguistic prosody, and add or strengthen musical meaning. Therefore, one would expect the perceived meaning of an isolated accompaniment to be traceable in the overall meaning of the complete song. Whether such an instrumental piece of music can convey a specific meaning, intended by the composer, has often been disputed (Antović, Stamenković, and Figar, 2016; Hanslick, 1854; Kivy, 2002). According to these authors semantic and emotional associations are highly personal and therefore irrelevant. However, a growing body of evidence shows that music can at least express emotional meaning in a less arbitrary way (e.g. Andrade, Vanzella, Andrade, & Schellenberg, 2017; Cespedes-Guevara & Eerola, 2018; Fritz et al., 2009; Huovinen & Kaila, 2015; Juslin, 2013; Juslin and Laukka, 2003; Koelsch, 2011; Schubert, 2013 Straehley & Loebach, 2014; Swaminathan & Schellenberg, 2015; Tiemann & Huron, 2011). In addition, there is evidence of semantic meaning in music (e.g., Brodsky, 2011, HaCohen & Wagner, 1997; Huovinen & Kaila, 2015; Koelsch et al., 2004; Margulis, 2016, 2017; Noble & McAdams, 2018), and of musical humour (Huron, 2004; Goeth, 2016).
Little is known, however, about how music and lyrics interact in this process. A few studies show significant correlations between the emotional content of song lyrics and the perceived emotional meaning in the music they are combined with (e.g., Hansen, 2018; Sun & Cuthbert, 2018; Tiemann & Huron, 2011). Interactions between lyrics and music are shown by Ziv (2017), indicating that music can increase the emotional effect of a song's lyrics, dependent on the participant's political background. Other researchers have found evidence that lyrics, even happy lyrics, diminish happiness in happy music, but that sad lyrics enhance feelings of sadness in sad music (e.g. Ali & Peynircyoǧlu, 2006; Brattico et al., 2011; Sousou, 1997; Stratton & Zalanowski, 1994), except when the music is atonal (Coffman, Gfeller, & Eckert, 1995). This can be explained by the fact that relatively predictable music activates the reward system and evokes positive feelings (Menon & Levitin, 2005), whereas atonal music evokes physical reactions associated with fear and stress (Proverbio et al., 2015). The alternative theory that people simply expect their music to be happy and their poetry to be sad (Margulis, Levine, Simchy-Gross, & Kroger, 2017) cannot account for the deviant effect of atonal music, nor for Galizio and Hendrick's (1972) finding that song versions with music were rated as both more positive (for example 'elated') and more negative (i.e., sad and serious), probably as a result of enhanced positive feelings towards the sad content of the songs (all protest songs, addressing serious issues). According to Ali and Peynircyoǧlu (2006), these studies also show that the emotions conveyed by 'the melody' are more powerful than those conveyed by the lyrics. However, except for Coffman and colleagues (1995), and Galizio and Hendrick (1972), these studies involve too few song versions to substantiate such a claim.
In order to measure the effects discussed above, participants will be asked to listen to several songs, and to complete a questionnaire after each one. The questionnaires will address various topics.
Ratings of perceived emotion are hypothesized to show that melody and accompaniment add meaning to a song in such a way that it is in line with its intended purport.
Perceived intelligibility ratings will be higher in sung versions. Singing enhances several aspects of auditory processing (Patel, 2011, 2014), and song form enhances the predictability of words (Manin, 2013; Rubin, 1995). Therefore, relatively long song parts in relatively intelligible genres such as jazz or theatre (Condit-Schulz & Huron, 2015) will be relatively intelligible compared to speech, especially in distracting circumstances, although singing often impairs intelligibility (Behrendt, 2017; Collister & Huron, 2008; Johnson, Huron, & Collister, 2014). Even accompanied singing may sometimes be more intelligible than speech, although an accompaniment can drown out the singer's voice or interfere with it (Byrne, 2012).
As regards interpretability, the MFH predicts that well-aligned music enhances comprehension by providing prosodic cues or helpful emotional content (Lai, Willems & Hagoort, 2015). In general, accompaniments will strengthen this effect. However, as MF will be stronger in a-cappella versions, sometimes text focus is optimal when listening to them.
Similarly, with regard to aesthetic value, most listeners will appreciate the accompanied versions most, although a considerable minority may be able to overcome the MF in an a-cappella version and will appreciate that one.
As regards rhyming perception, one would expect rhyme to be detected better in sung conditions. Singing is thought to accentuate vocals (Patel, 2014), and both dynamic expectation (Huron, 2006) and dynamic attending (Jones, 1976) may further accentuate rhyme, especially in singing conditions (Schotanus, 2015).
A few items will concern repetition. Because verbatim repetition is less accepted in speech than in music (Margulis, 2014), verbatim repetition of words or phrases will also be more accepted in sung conditions. Furthermore, a repetition of words embedded in music may change the meaning of repeated words.
Finally, recall will be assessed. It will be relatively high after sung versions, even when they are played only once. Although most studies suggest otherwise (e.g., Medina, 1994; Moussard, Bigand, Belleville, & Peretz, 2014; Patel, 2011, 2014), multiple exposure is not always necessary (Bullerjahn, 2009). Sustained attention, enhanced comprehension, and increased emotional meaning probably result in better retention. An accompaniment may therefore also support recall. However, the evidence available is scarce and contradicting (Galizio & Hendrick, 1972; Schwartzberg & Silverman, 2012; Silverman & Schwartzberg, 2014).
Hypotheses
The discussion above results in three hypotheses to be tested in the current study:
- Presenting verbal information sung instead of spoken can help language-processing, even when this is done once only (provided that the melody is prosodically well aligned, and the song is performed properly).
- An accompaniment can ease the processing of the music, and subsequently further support the processing of the lyrics.
- Listeners will attach different meanings to different versions of a song, including non-verbal versions such as an isolated accompaniment, and the meaning of these non-verbal versions will be traceable in the overall meaning of the complete song.
In addition, there are several sub-hypotheses:
- 1.1 Singing can enhance the intelligibility of words, particularly in stimuli involving long texts in a relatively intelligible genre;
- 1.2 Sung texts are better understood than spoken ones;
- 1.3 Sung lyrics are more appreciated than spoken ones;
- 1.4 Singing supports rhyming perception;
- 1.5 Recall is enhanced in song versions with music, even after the first exposure;
- 1.6 Verbatim repetitions of words are perceived as both more acceptable and more meaningful in sung texts compared to spoken ones;
- 1.7 Hypothesis 1 applies in particular in a distracting setting such as a classroom.
- 2.1 A supporting accompaniment can further enhance intelligibility, interpretation, appreciation, rhyming perception, and recall, and will further enhance the meaningfulness of verbatim repetitions.
-
- 2.1.1 As a supporting accompaniment functions as both a foregrounding and a backgrounding device, MF may be stronger in a-cappella versions. Hence, if the listener is able to overcome the obstruction caused by MF, understanding, appreciation and recall of the lyrics will sometimes be enhanced more clearly in a-cappella versions than in accompanied ones, whereas processing fluency will always be enhanced more clearly in (supportively) accompanied versions.
- 2.2 Supportively accompanied versions will be rated as more energetic and easier to focus on.
- 2.3 Instrumental interludes between sung phrases in an accompanied song will be rated as less distracting than the silences that replace them in an a-cappella version;
- 2.4 When singing a complex melody, an unaccompanied voice sounds less at ease and less in tune than an accompanied one, even when the exact same recording is used.
SHs (Sub-hypotheses) 2.3 and 2.4 are meant as indicators of the validity of the MFH and as an explanation for SHs 2.1. and 2.2. They do not measure enhanced processing of song lyrics. These hypotheses will be tested in both a classroom and a laboratory situation, with measures of musical sophistication as covariates. The classroom experiment will be reported on in Study 1, and the laboratory experiment in Study 2; it was reported on already in Schotanus, Eekhof and Willems (2018), but within that paper, parts of the data, relevant for the comparison with the classroom experiment, were left unanlyzed. These two settings were chosen in order to combine the ecological validity of the classroom study with the enhanced randomization of the laboratory study, to test sub-hypothesis 1.7, and to test whether songs can helpfully be used in classes in which a song is presented only once (for example History or Literature classes). This would be in line with several authors who have advocated the use of song in the classroom because of its positive effects on attention, arousal and motivation (Cohen, 2005; Goering & Burenheide, 2010; Sitomer, 2008; Thompson et al., 2001; Wolfe & Noguchi, 2009).
STUDY 1
Method
PARTICIPANTS
A total of 271 students of secondary schools in Rozendaal (NL, n = 254) and Nijmegen (NL, n = 18) participated, 134 girls, 130 boys, seven did not mention their gender, all grade ten pupils of Dutch higher general or pre-University education (i.e., 4HAVO or 4VWO). Average age was 15.7 years old (SD = 0.9). 127 participated in June 2015, 23 in August 2015, and the rest in February and March 2016. Thirteen vetoed the use of their data or were excluded because they had obviously not taken the trial seriously, they gave nonsensical anwers to open questions, sometimes including foul language, and rated large sequences of Likert-scale items in the same way (for example '1'). Participants were spread over twelve pre-existing groups (i.e., their Dutch Language and Literature classes) (see Table 1). Groups 1 and 6 consisted of roughly the same pupils. They participated twice because of technical errors (the wrong tracks had been selected) the first time. Both sets of trials were included, as Kruskal-Wallis tests revealed that this group's ratings for each song version did not differ significantly from other ratings for the same song version.
On the basis of three questions, a scale was created to guage the participants' musical experience. Had they chosen music in their curriculum (if so, 1 point was assigned to them)? Did they play an instrument, or sing on a regular basis and did they practise musical pieces (if so, 1 point)? And for how many years had they undertaken music education (1-3 years: 1 point; more years: 2 points)? All participants were assumed to be familiar with Western tonal music and to have learned its conventions. In 2016 the participants were actually asked whether they had grown up with Western music or not, and five, indeed, reported that they had not. However, they did not show deviant ratings, so we included them as part of the full sample.
STIMULI
Twenty-four different tracks were used as stimuli, i.e, four different songs, played in full length, in six different conditions: spoken; vocalized (entire melody sung a cappella on lala); a cappella with lyrics; accompaniment only; complete, and accompanied speech. The conditions a cappella, accompaniment only, and complete were based on the same recording. The conditions spoken and vocalized were performed with the accompaniment-only version on the headphones. For accompanied speech the accompaniment and the spoken version were combined. Therefore, timing was very much the same across conditions.
A disadvantage of the 'spoken' version is that the diction is unusually slow and the words are interrupted by unusual silences, as the onsets of phrases are aligned to a musical beat. This may confound the findings. The low speech rate can support recall (Kilgour, Jacobson & Cuddy, 2000; Ludke, Ferreira & Overy, 2014), as can the silences (MacGregor, Corley & Donaldson, 2010), and the fact that phrase onsets are timed along with the musical beat can support dynamic attending (Jones, 1976). Furthermore, in a lengthy song, slow speech, interrupted by silences, can impair concentration, and induce perceived sadness. However, natural speech would confound the results too, because effects of the higher speech rate and smaller stimulus length could easily be misattributed as effects of not singing.
All tracks, and the lead sheets of the complete versions, can be found on the internet (Schotanus, 2017). They were sung or recited by the author (a male baritone), and accompanied and recorded by Christan Grotenbreg, in his studio. He played a keyboard connected to ProTools 10 (Desktop recording). The voice was recorded using a Neumann TLM 103 microphone, and an Avalon VT 737 SM amplifier. Digital conversions were conducted using Apogee Rosetta. To avoid a situation in which actual impurity of singing would affect the purity ratings, voice-treatment software was used: Waves Tune, Renaissance Vox compression, and Oxford Eq.
The songs were all pre-existing but seldom-played cabaret songs in Dutch, composed by the author. Using his own songs, it was relatively easy for him to meet all the conditions concerning intelligibility, complexity, and alignment, and to create different conditions for four songs, all with the same voice and a similar accompaniment. They constituted ecologically valid but unfamiliar stimuli in the native language of nearly all the participants, and belonged to a text-centred genre (theatre) where the lyrics are usually highly intelligible (Condit-Schulz & Huron, 2015).
To be able to test whether the accompaniment could really make a difference in music-processing, the songs had to be relatively complex. Therefore, songs were chosen with melodies containing out-of-key notes, tonal shifts, major-minor changes, and voiceless intervals that would occur as on-beat silences in a-cappella versions. Whether or not the four melodies were indeed all relatively complex could not be unambiguously determined; however, Simonton's (1984) measure of complexity (see also Eerola & Toiviainen, 2004) indicated that the melodies were at least unusual (see Appendix A).
The lyrics were moderately complex. They expressed serious feelings, but did so with a sense of irony and self-mockery. Furthermore, they were quite lengthy (between 34 and 51 lines), with very few verbatim repetitions, but many parallelisms. And indeed, according to an online test tool to determine the CEFR comprehension level (Council of Europe, 2011; Velleman & Van der Geest, 2014; Stichting Accessibility, 2014), they were in the B2-category, with comtemporary literature.
DESIGN
The participants listened to five of the 24 tracks in a classroom setting, under the guidance of their own teacher, who used a laptop and the loudspeaker system connected to the smart-board in the classroom. This is an ecologically valid setting, but it impairs randomizing. Nevertheless, initially, the 16 combinations of songs and basic conditions (a cappella, spoken, complete and vocalized song) were distributed pseudo-randomly among four groups (group I-IV in Table 1), and each session was extended with the accompaniment-only version of the song, which was presented as spoken text. However, as Table 1 shows, sessions I and II remained incomplete because tracks were mixed up. Therefore, two complementary sessions were added.
| Group | N valid |
Track 1 Song |
Cond | Track 2 Song |
Cond. | Track 3 Song |
Cond. | Track 4 Song |
Cond. | Track 5 Song |
Cond. |
|---|---|---|---|---|---|---|---|---|---|---|---|
| I | 26 | KT | sp | KT | la | KT | ac onl | ||||
| II | 20 | KT | ac onl | JD | a cap | LY | la | [KT | sp | WS | c]* |
| III | 28 | JD | la | LY | ac onl | KT | c | WS | a cap | LY | sp |
| IV | 24 | KT | a cap | LY | c | JD | sp | JD | ac onl | WS | la |
| V | 22 | LY | a cap | KT | sp | WS | c | ||||
| VI (I) | 24 | WS | sp | KT | la | WS | ac onl | JD | c | LY | a cap |
| VII** | 17 | LY | la | WS | c | KT | ac onl | KT | sp | JD | a cap |
| VIII** | 18 | WS | ac sp | LY | a cap | WS | la | JD | sp | KT | c |
| IX** | 21 | KT | sp | JD | la | WS | a cap | LY | c | JD | ac sp |
| X** | 23 | KT | la | WS | c | 1LY | sp | KT | ac sp | JD | a cap |
| XI** | 16 | KT | a cap | LY | ac sp | JD | c | LY | la | WS | sp |
| XII** | 20 | KT | a cap | LY | ac sp | JD | c | LY | la | WS | sp |
* planned but not realized ** with modified questionnaire
JD = 'Lekker depressief' (Jolly Depressed); KT = 'Hou'en zo' (Keep it Like That); LY = 'Maar ik hou van jou' (But I Love You); WS = 'Wat past' (What Suits).
During the first trials in 2015 several shortcomings in the questionnaires came to light. Therefore, a few changes were made in the questionnaires and a second set of trials was conducted in 2016. This time, in each session the additional condition (accompaniment only) was replaced by an accompanied-speech version of the song presented in the vocalized condition. Thus, each participant would hear and react to the lyrics of all four songs, and a further investigation of the effect of the accompaniment would be possible.
During the 2016 trials, one group caused trouble during the session, and several pupils had to be excluded from the analysis for reasons mentioned above. An extra group was added to obtain additional valid cases. But from this group several pupils had to be excluded as well. Perhaps there was an unfavourable, demotivating mixture of songs and conditions in these two sessions. Finally, two groups that completed trial in 2016 filled out an extra questionnaire after approximately eight weeks to measure delayed recall (see Questionnaires section). Regrettably, the other groups in the 2016 trials, could not fill out this extra questionnaire, due to time trouble finishing the school programme.
QUESTIONNAIRES
The questionnaires, the full text of which is available on the internet (Schotanus, 2017), mainly consisted of five-point Likert scale ratings concerning the applicability of statements regarding arousal, emotions, aesthetic valence, processing fluency, rhyming perception, voice quality, and purity of singing (1, not applicable, 2. hardly applicable, 3. a bit applicable, 4. applicable, 5. Very applicable). Several questions could not be asked in all the different experimental conditions (e.g., questions about the lyrics could not be asked in the conditions vocalized and accompaniment only); others were asked twice in each condition, once in relation to the music and once in relation to the lyrics. For the a cappella condition, the word 'music' in these questions was changed into 'melody' in the second run, because during the first run, several pupils (n=26) felt there was no music in this condition and therefore did not answer the questions.
Several song-specific questions were also asked: five Likert-scale ratings of the applicability of statements about the content of the songs; an open question about the meaning of a difficult line; five lines that had to be identified as either correct or incorrect quotes from the song lyrics; and (in the 2016 version) a rhyming detection task (i.e. pupils were asked to mark 'sound repetition' in a full strophe of the song, quoted in prose form). Some of the comprehension questions were changed as well for the 2016 trials because experts did not agree on the 'right' answers for these questions.
Finally, after hearing non-verbal song versions, participants were asked to describe what the lyrics of the song would be about. This question will be analysed separately (Schotanus, 2020).
In the additional questionnaire on delayed recall, pupils were presented with six short phrases expressing the gist of six songs, including the four songs of the experiment. The other songs described were non-existing songs. Pupils were asked to mark the songs they thought they had heard, and to write down as many details and words as they could remember.
STATISTICAL ANALYSES
In order to reduce dimensions, Principal Axis Factoring Analyses were conducted with oblique rotation (direct oblimin) in SPSS, factor scores where estimated using the Anderson-Rubin method. After that, the effects of condition and musical experience was measured, using crossed classified linear mixed models regressions, or, in the case of ordinal variables, generalized mixed models regressions (multinomial with Logit link), with random intercepts for participant*group, song, and group. In addition, alternative regressions were run using Classification and Regression Trees software (CART, Breiman, Friedman, Stone & Ohlsen, 1984), a part of Salford Prediction Models (SPM). CART regressions (for an introduction see Strobl, Malley, & Tutz, 2009) are also suitable for clustered data and always provide a clear indication of effect size, i.e. an R2 value. CART regressions were conducted using the default settings for regression trees, i.e., method: least squares; stopping rule: do not split node if sample < 10, and the additional rule that the best tree is the smallest tree within one SE from the most predictive one. However, in some cases the most predictive tree was reported as well.
ETHICS STATEMENT
This experiment was conducted in line with the Declaration of Helsinki. All participants were free to decide whether or not to complete the questionnaire, and were given the option to forbid the scientific use of their answers. Furthermore, the first run was approved by the school board and was organized in regular lessons that were not needed to prepare tests. For the second run, the experiment was examined and approved by ETCL (the Ethics Committee of the Utrecht Institute for Linguistics, UIL-OTS). After that, the school leaders of both participating schools gave their written consent. Parents were informed by email and did not withdraw their consent for participation by their children.
Results and Discussion
Because most of the questions were not asked in every condition, an overall factor analysis was not possible. Instead, factor analyses were performed on the answers to groups of questions asked in the same conditions, where music and lyrics of the same song version are treated as separate conditions. Five groups of questions were analysed using Principal Axis Factoring analyses with oblique rotation (direct oblimin), i.e., questions concerning overall aesthetics and processing fluency (six conditions), questions concerning voice quality (five conditions), questions concerning the lyrics (four conditions), questions concerning emotions (nine conditions), questions concerning repetitions (four conditions). In all cases, the datasets were considered suitable for factor analyses. Specifically, both the KMO statistic and the Measures of Sampling Adequacy for all the individual variables were > .5, the determinant was > .00001, and the Bartlett test of sphericity was significant. Nine factors in total had eigenvalues over 1 and were retained. Based on the factor loadings (see Table 2), Factor 1 represents Listening comfort (a combination of aesthetic valence and processing fluency), Factor 2 Distraction by voiceless intervals, Factor 3 Voice quality, Factor 4 Quality of the lyrics, Factor 5 Clearness, Factor 6 Bad rhyming, Factor 7 Feeling downbeat (a combination of sadness and lack of energy), Factor 8 Emotional load (a combination of sadness, heaviness, and emotivity), and Factor 9 Meaningfulness of repetition.
The fact that several factors are combinations of aesthetic valence and listening comfort raises the question of whether aesthetic valence and listening comfort would not have formed separate factors if the structure of the data had allowed for a factor analysis with all variables combined. However, the connection between aesthetic valence and listening comfort is in line with work by Van den Tol and Edwards (2014), who hypothesize that aesthetic valence supports concentration, and Huron (2013), who argues that processing fluency supports aesthetic valence. Furthermore, the interpretation of the two factors concerning arousal and emotion (Feeling downbeat and Emotional load) was complex. Feeling downbeat appeared to be the inverse of happiness, energetic quality and, to a lesser extent, humour, but did not straightforwardly represent sadness, because sadness is also an important contributor to the second factor (Emotional load). It appears to be the case that Feeling downbeat measures the well known low-energy and negative-affect part of sadness (see for example, Cespedes-Guevara & Eerola, 2018), while Emotional load represents its more positively valued, sensitive and serious part: solemnness, or the expression of serious feelings.
Two variables, Focus and Purity of singing, were not included in the factor analyses and will be analysed as single variables. Including them in the Factors 1 (Listening comfort) and 3 (Voice quality) respectively would exclude too many cases. Moreover, there are specific predictions concerning these two variables, which seemed to be confirmed in the earlier version of this paper (Schotanus, 2016a). However, as Figure 1 shows, the scores for focus, purity, Listening comfort, and Voice quality show a similar pattern, indicating that song versions with accompaniment are rated differently from those without accompaniment. Moreover, Voiceless intervals and Bad rhyming show a comparable but inverse pattern. Only Lyric quality, Clearness and Meaningfulness of repetitions seem to show deviant patterns. Feeling downbeat and Emotional load, with nine categories in the variable condition, will be discussed later.
REGRESSIONS
Crossed classified mixed model regressions with condition, presentation order, condition*presentation order, and musical training as fixed factors, show that condition is a significant predictor of all these factors (see Table 3). In line with that, in most of the CART regressions on the same variables, with condition, group, song, presentation order and musical training, condition turns out to be an important predictor as well (see Table 5).
| Processing fluency | Voice | Lyrics | Emotion | Rep. | |||||
|---|---|---|---|---|---|---|---|---|---|
| KMO | .71 | .68 | .64 | .78 | .54 | ||||
| Df | 10 | 3 | 21 | 21 | 3 | ||||
| Factor 1 Listening Comfort | Factor 2 Voiceless intervals | Factor 3 Voice quality | Factor 4 Lyric quality | Factor 5 Clearness | Factor 6 Bad rhyming | Factor 7 Feeling downb. | Factor 8 Emotional load | Factor 9 Meaningful rep. | |
| Not boring | .81 | -.29 | |||||||
| Not tiring | .81 | -.39 | |||||||
| Song beautiful | .68 | -.17 | |||||||
| VIs distractive | -.20 | .65 | |||||||
| VIs nice | .23 | -.23 | |||||||
| Voice natural | .71 | ||||||||
| Voice pleasant | .63 | ||||||||
| Voice at ease | .77 | ||||||||
| Worth thinking about | .82 | .08 | |||||||
| Lyrics beautiful | .78 | .21 | -.43 | ||||||
| Poetic | .78 | -.17 | |||||||
| Beautiful rhymes | .49 | .18 | -.83 | ||||||
| Lot of rhyme | .24 | -.87 | |||||||
| Intelligible | .12 | .86 | |||||||
| Comprehensible | .10 | .82 | -.33 | ||||||
| Happy | -.84 | -.34 | |||||||
| Sad | .73 | .61 | |||||||
| Emotive | .10 | .51 | |||||||
| Funny | -.38 | -.12 | |||||||
| Energetic | -.68 | .61 | |||||||
| Heavy | .54 | .66 | |||||||
| Nagging | .43 | .14 | |||||||
| Rep. superfluous | -.81 | ||||||||
| Str. Emotion | .86 | ||||||||
| Adds meaning | .53 | ||||||||
| Eigenvalue | 2.31 | 1.11 | 1.98 | 2.57 | 1.37 | 1.04 | 2.97 | 1.14 | 1.68 |
| % of Variance | 46.20% | 20.38% | 49.66% | 36.64% | 19.63% | 14.82% | 42.38% | 16.23% | 56.04% |
| Squared loadings | 1.87 | .734 | 1.49 | 2.14 | 1.57 | 1.79 | 2.34 | 1.21 | 1.68 |
Feeling downb. = Feeling downbeat; Meaningful rep. = Meaningfulness of repetition; VIs = Voiceless intervals; Rep. superfluous = Repetition was superfluous; Str. Emotion = repetition strengthens emotivity.
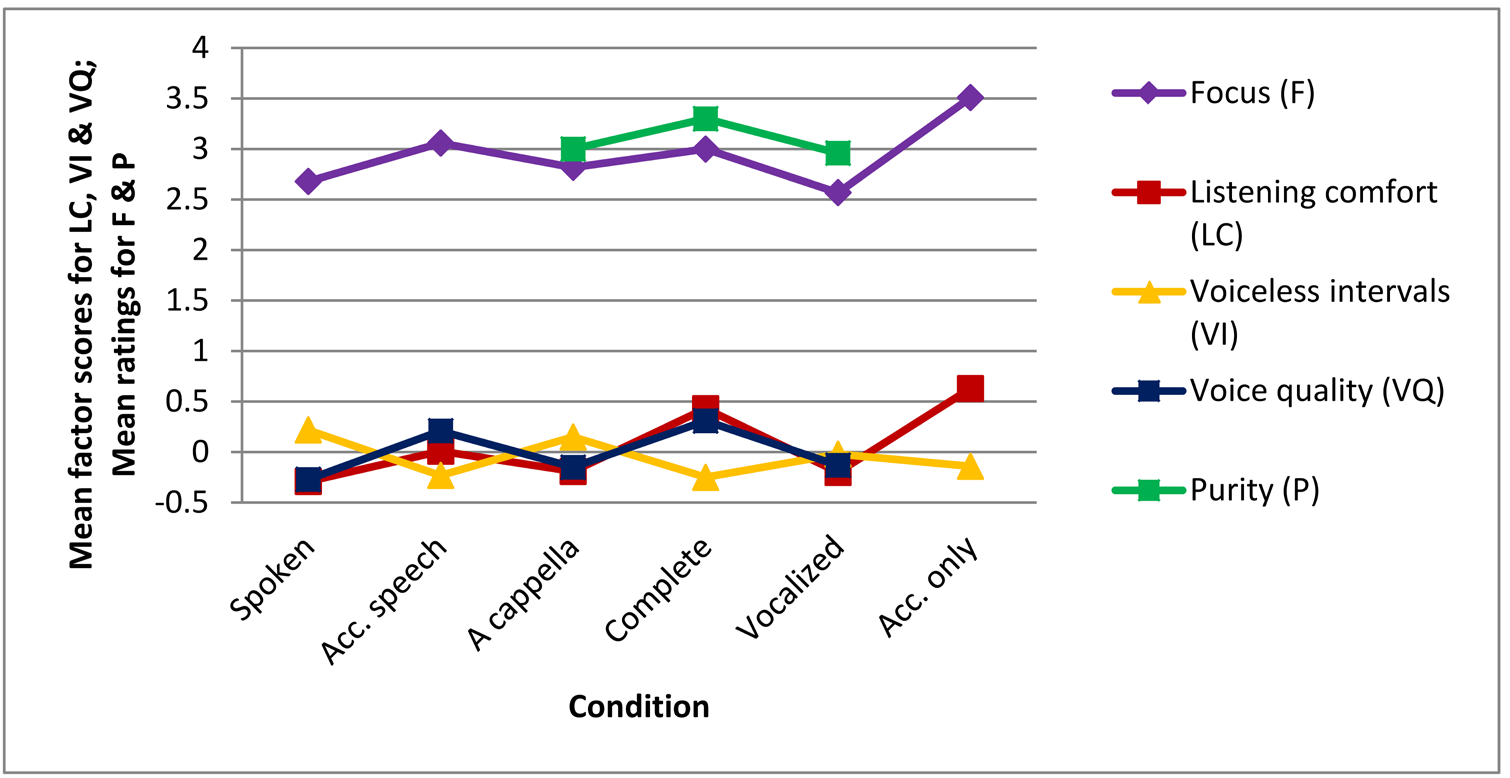
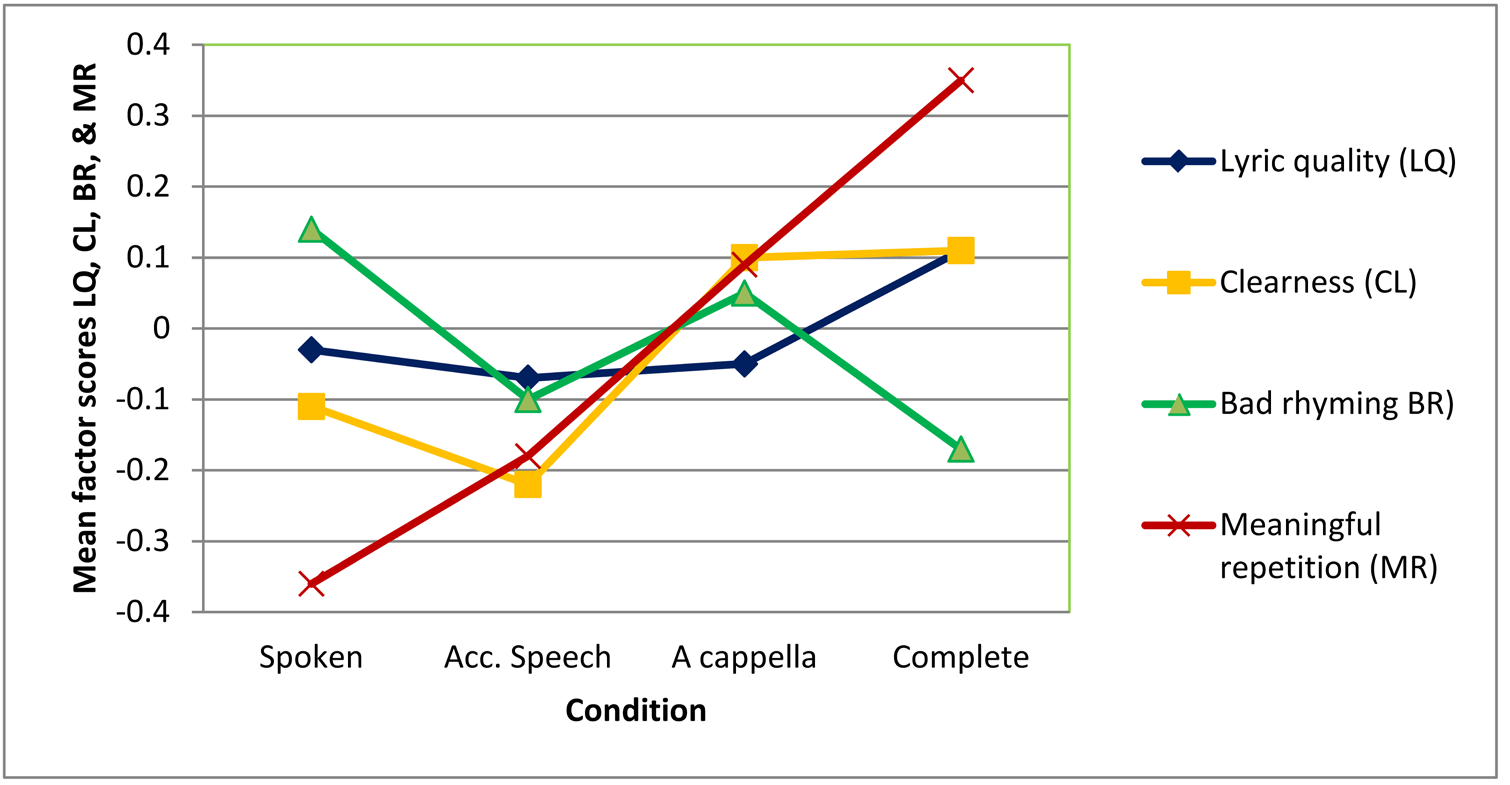
Figure 1. Recurrent and deviant patterns in the effect of condition on various ratings. Lines are meant to facilitate pattern-comparison and do not represent a gradual transition between two conditions. Acc. speech = accompanied speech; Acc. only = accompaniment only. For exact Means and SDs, see Appendix B.
| Focusa | L. Comf | V. Int. | V.Q | Puritya | Lyr Q. | Clearn. | B. R. | M Rep | |
|---|---|---|---|---|---|---|---|---|---|
| AIC Intercept | 2513.23 | 2814.69 | 2982.84 | 1778.74 | 1837.12 | 1946.07 | 2011.03 | 2028.60 | 1647.35 |
| AIC model | 2427.39 | 2601.01 | 2937.56 | 1677.15 | 1804.81 | 1924.94 | 1992.64 | 2004.32 | 1588.46 |
| N valid | 765 | 1072 | 1072 | 669 | 670 | 756 | 756 | 756 | 600 |
| Fixed (df) | F | F | F | F | F | F | F | F | F |
| Condition | 19.18*** | 33.68*** | 6.22*** | 15.01*** | 8.50*** | 5.84** | 44.73** | 3.21* | 16.69*** |
| Pr. Order | 2.78* | 0.74 | 1.26 | 4.43** | 2.05 | 2.42 | 87.86 | ||
| Pr.ord*cond. | 3.23*** | 2.84*** | 1.83* | 4.90*** | 2.09 | 3.30** | 2.34* | ||
| Mus. exp. | 4.14* | 1.48 | 8.67** | 0.02 | 0.24 | 0.04 | 8.72** |
Pr. Order = presentation order; Cond. = Condition; L. Comf. = Listening comfort; Mus. Exp. = Musical experience; V. Int. = Voiceless intervals; V.Q. = Voice quality; Lyr. Q. = Lyric quality; Clearn. = Clearness; B. R. = Bad rhyming; M. Rep. = Meaningfulness of repetition
a Ordinal glmm: same variables significant but AIC for model larger than AIC for intercept only.
| p < .001 | p < .01 | p < .05 | p < .06 | |
|---|---|---|---|---|
| Focus | C > V; AS > V; AO > AC; AO > S | AO > AS; AO > C | AS > S | |
| Listening comfort | C > S; C > V; C > AC; AO > S; AO > V; AO > AC; AO > AS; AS > S | AS > V | AS > AC; C > AS | |
| Voiceless intervals | C > S | C > AC; AO > AS | AS > S; AO > AC; V > S | |
| Voice quality | C > S; C > V; C > AC; AS > S | AC > S; V > S | ||
| Purity | C > V | C > AC | ||
| Lyric quality | C > AS | C > AC | C > S | |
| Clearness | AC > S | C > S | ||
| Bad rhyming | C > S | |||
| Meaningful rep. | C > S; C > AS; AC > S | AS > S | AC > S | C > AC |
AC = A cappella, AO = Accompaniment only, AS = Accompanied speech, C = Complete, S = Spoken, V = Vocalized
In line with the above observations, both pairwise comparisons in mixed model regressions (see Table 4) and splits in CART trees (see Figures 2a and 2b) show that for six of these variables (i.e., focus, Listening comfort, Voiceless intervals, Voice quality, purity and Bad rhyming), the main differences are those between song versions with and without accompaniment. This indicates that, as hypothesized, accompanied versions support processing fluency, aesthetic value, perceived voice quality, focus, and purity of singing, and that these processes are related to the processing of silences and out-of-key notes in the melody (hypothesis 2, and SH 2.1; 2.2; 2.3 and 2.4).
Whether this relationship really exists cannot be established with certainty. However, regarding silences, as some of the positive effects of accompaniment are also visible in accompanied speech (which may be interesting for advertisements and poetry performances), it is likely that there is indeed a causal relationship between silence processing and the other variables. Note that distraction by silences may even be rated lower than it should be. Several pupils rated silences as absolutely not distracting, even though they indicated that they were absolutely bored or tired of listening to the track. They seem to have used this statement as a measure of disgust, as in 'I'd rather hear nothing than this'.
| Focus | L Com | V Int | V Q | Purityc | Lyr Q | Clearc | B Rd | M Rc | |
|---|---|---|---|---|---|---|---|---|---|
| R2learn | 0.19 | 0.28 | 0.03 | 0.16 | 0.20 | 0.10 | 0.11 | 0.08 | 0.14 |
| R2test | 0.15 | 0.24 | 0.02 | 0.12 | 0.13 | 0.08 | 0.06 | 0.07 | 0.12 |
| RE | 0.86 | 0.76 | 0.98 | 0.95 | 0.88 | 0.92 | 0.94 | 0.93 | 0.89 |
| RVI | RVI | RVI | RVI | RVI | RVI | RVI | RVI | RVI | |
| Condition | 45.06 | 55.18 | 100 | 57.90 | 14.79 | b | 26.23 | 87.70 | 41.71 |
| Pr. order | 13.40 | a | b | a | a | b | a | b | b |
| Group | 100 | 100 | b | 100 | 100 | 100 | 100 | 100 | 100 |
| Song | 2.31 | a | b | a | a | b | a | a | b |
| M T | 14.16 | b | b | a | 41.19 | b | a | 22.44 | b |
RE = Relative Error; RVI = Relative variable importance; Pr. Order = Presentation order; M T = Musical training.
a Deleted from model. b Not important . c The smallest CART tree within 1 SE from the most predictive one has just one split concerning group (purity: R2test = 0.10; Meaningfulness of repetition: R2test = 0.09), or two splits concerning group: Clearness: R2 test = 0.08) . d In a model with song, there is just one split (concerning song), but R2 is lower.
Regarding the effect of accompaniment on perceived purity and relaxation of the voice (bearing in mind that the exact same recording was used for both a-cappella and complete versions), there may be several alternatives for the explanation that processing the implied harmonies would be more difficult without accompaniment, and that the listener would project their own uncertainty on the singer. First, in an unaccompanied voice, every unevenness will be heard clearly, and consequently may affect purity ratings, even if this has nothing to do with pitch. Furthermore, purity ratings may not really reflect true purity ratings, but just an indication of voice quality or hedonic valence. However, in the CART tree predicting Purity ratings, Musicianship is a relatively important factor, which indicates that participants have really rated purity of singing. That this effect is not visible in the mixed model regression can be explained by the fact that SPSS cannot handle U-shaped correlations. As the extended CART tree shows, beginning musicians gave lower purity ratings than both trained musicians and non-musicians (see Figure 2a).
Another confounding factor could be that both vocalized and a-cappella versions are sung in equal-tempered tuning, which is not exactly pure. Hence, it cannot be excluded that listeners do not expect such an impure tuning in a-cappella singing. However, in an additional experiment (Schotanus, 2016) the singing in equal-tempered tuning was not rated significantly as being consistently less pure than the singing in Pythagorean tuning. Moreover, as nearly all the singing Western school children hear is in equal-tempered tuning, it would be unlikely for them to rate equal-tempered tuning as impure. Finally, unlike the MFH, an equal-tempered-tuning effect cannot explain why complete versions were rated consistently across songs, while vocalized songs and a-cappella versions with lyrics were not, nor can it explain why sometimes the vocalized-song and a-cappella versions of the same song were rated differently (see Schotanus, 2016, see also Appendix D), although in both tracks the melody is the same and tuning is digitally controlled. The MFH, however, predicts (in line with SH 2.1.1) that out-of-key notes lead to lower purity ratings in a-cappella versions compared to complete ones, unless listeners are able to overcome the problems caused by these notes. This is exactly what the data seem to show. Sometimes the lyrics, or something in the vocalizations, may have caught the attention of the listeners and helped them solve the problems caused by the out-of-key notes.
Although the main differences between the conditions in regressions on the six variables showing similar patterns are those between song versions with and without accompaniment, there are other significant differences as well. In general, ratings for complete versions are more positive than those for accompanied-speech versions, and ratings for a-cappella versions are more positive than those for spoken versions. The mutual differences (particularly those between a cappella and spoken) are not always significant, but in pairwise comparisons with other versions, spoken versions are more often rated significantly more negative than a-cappella versions, and complete versions are rated more positive than accompanied-speech versions. Thus, most of these regressions show an effect of singing. (SH 1.3).
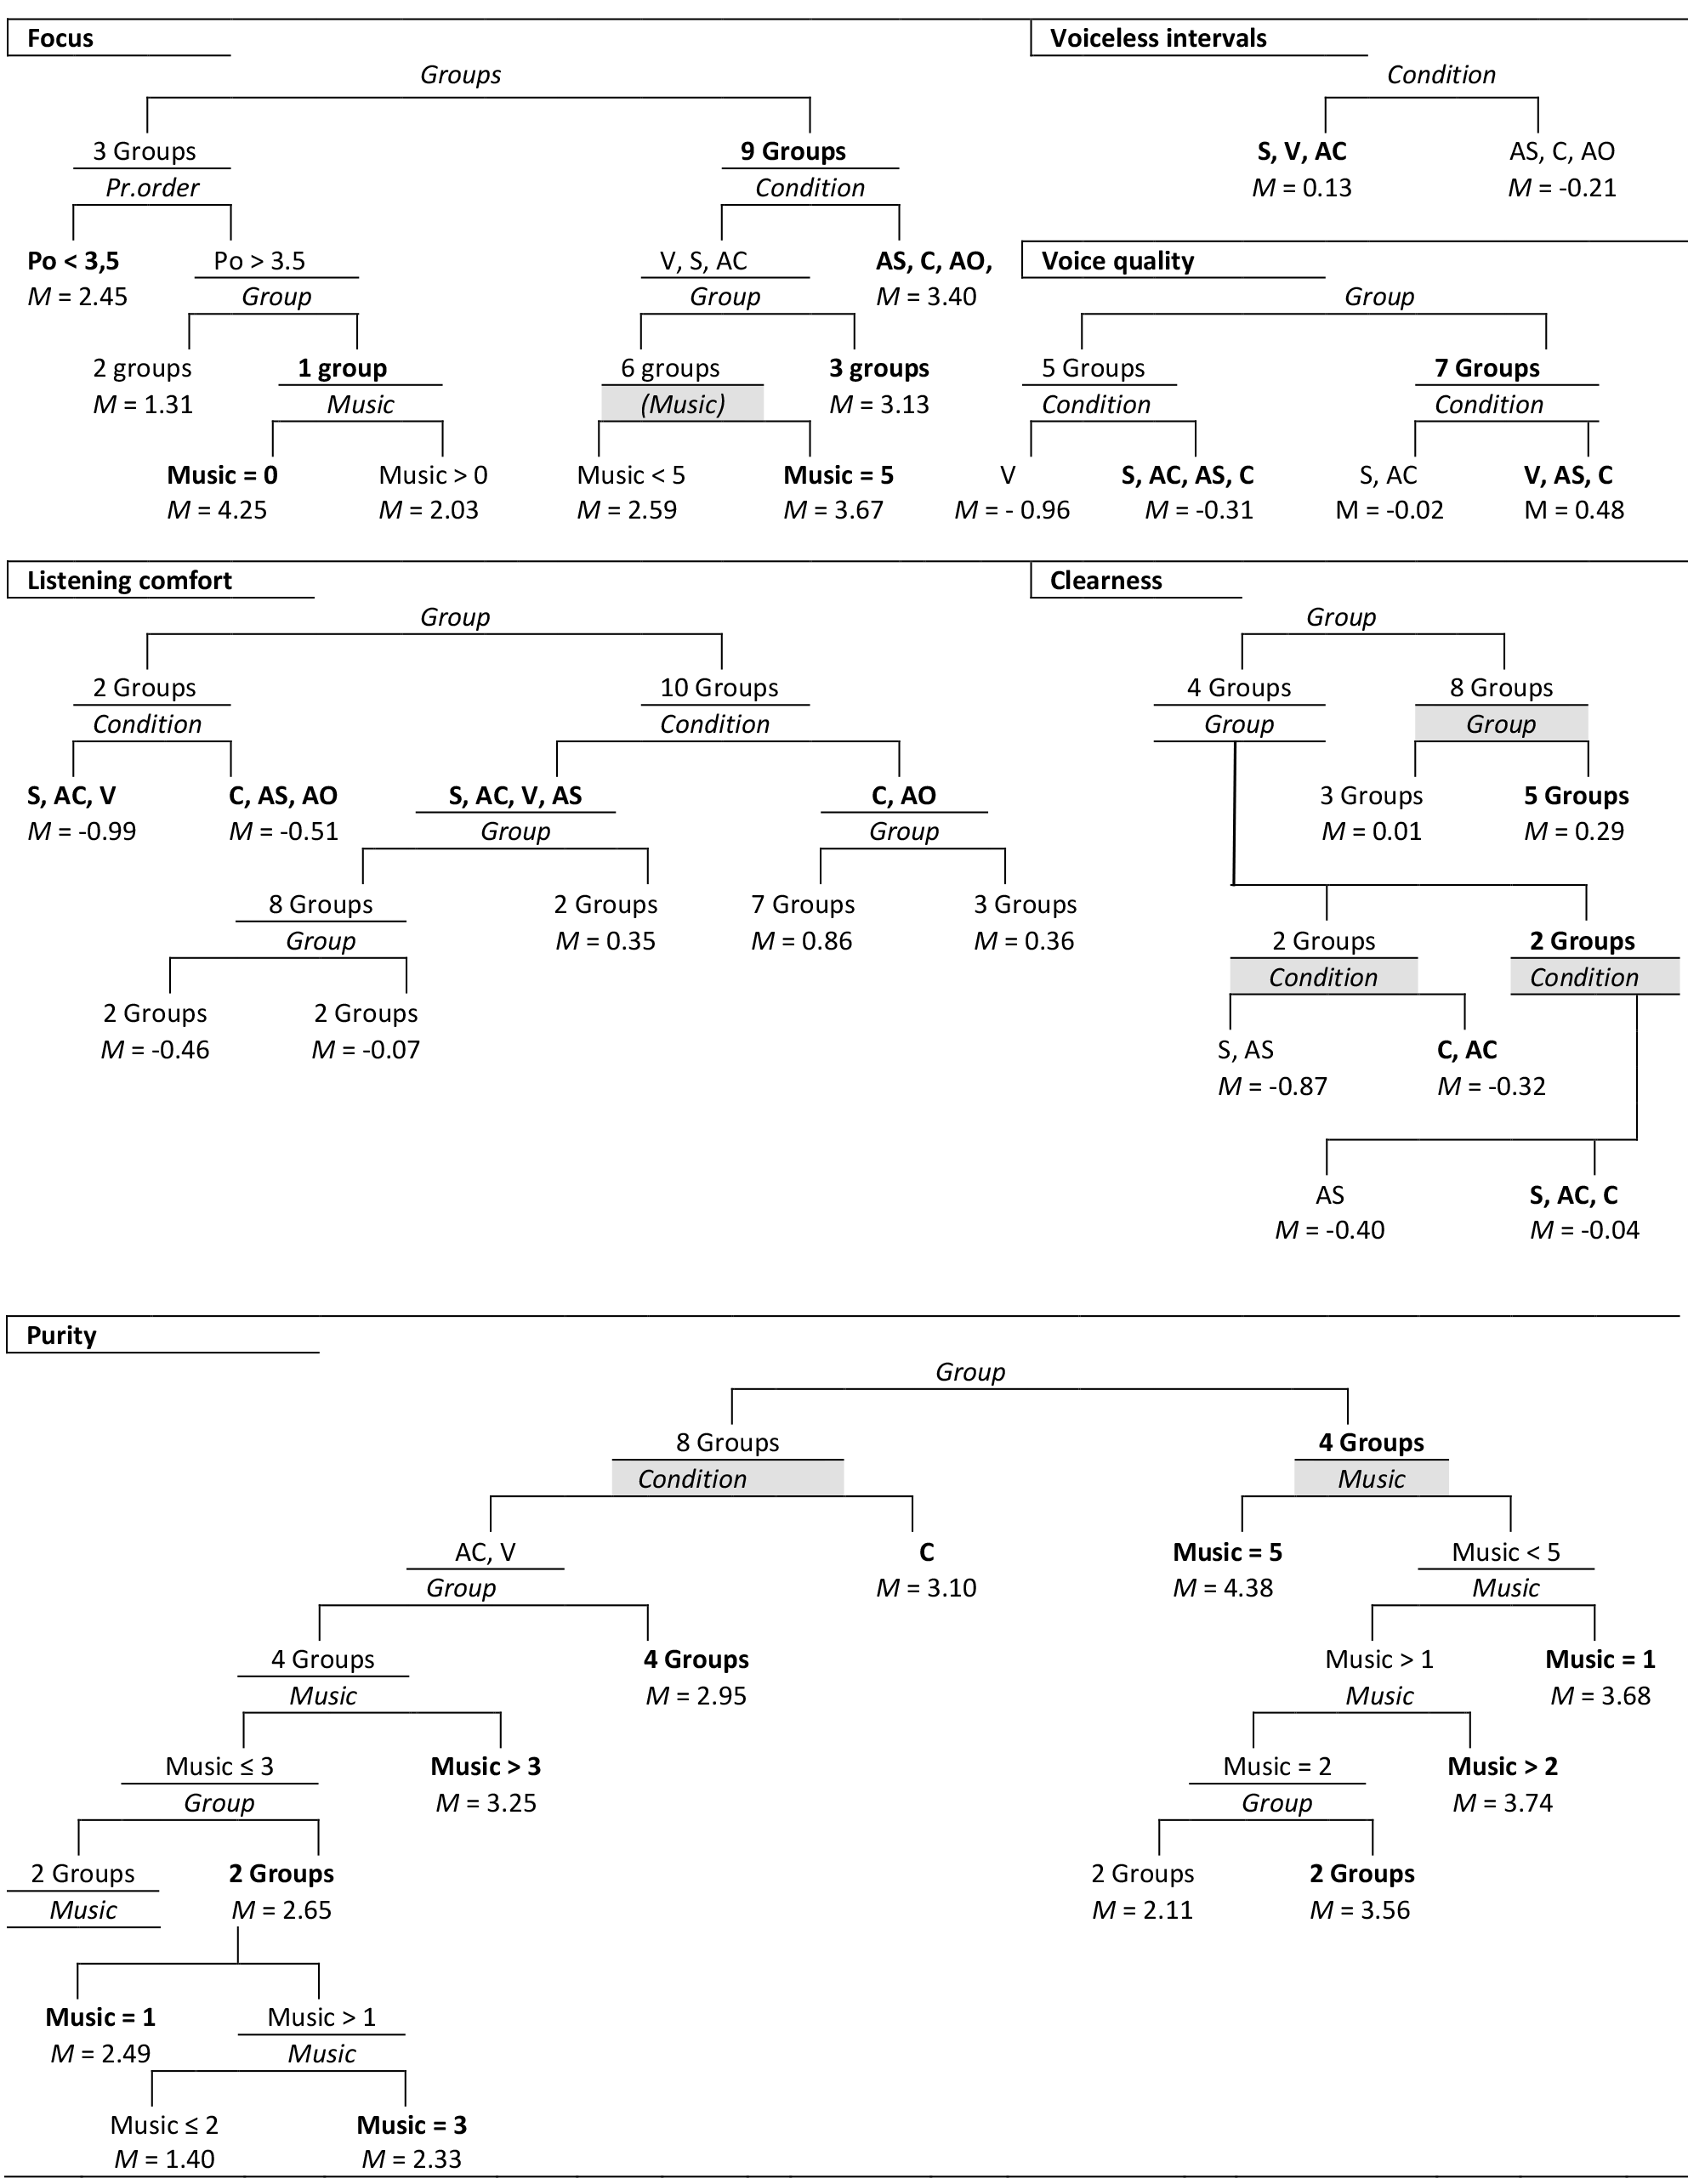
Figure 2a. CART trees belonging to six of the regressions summarized in Table 6. For index see Figure 2b.
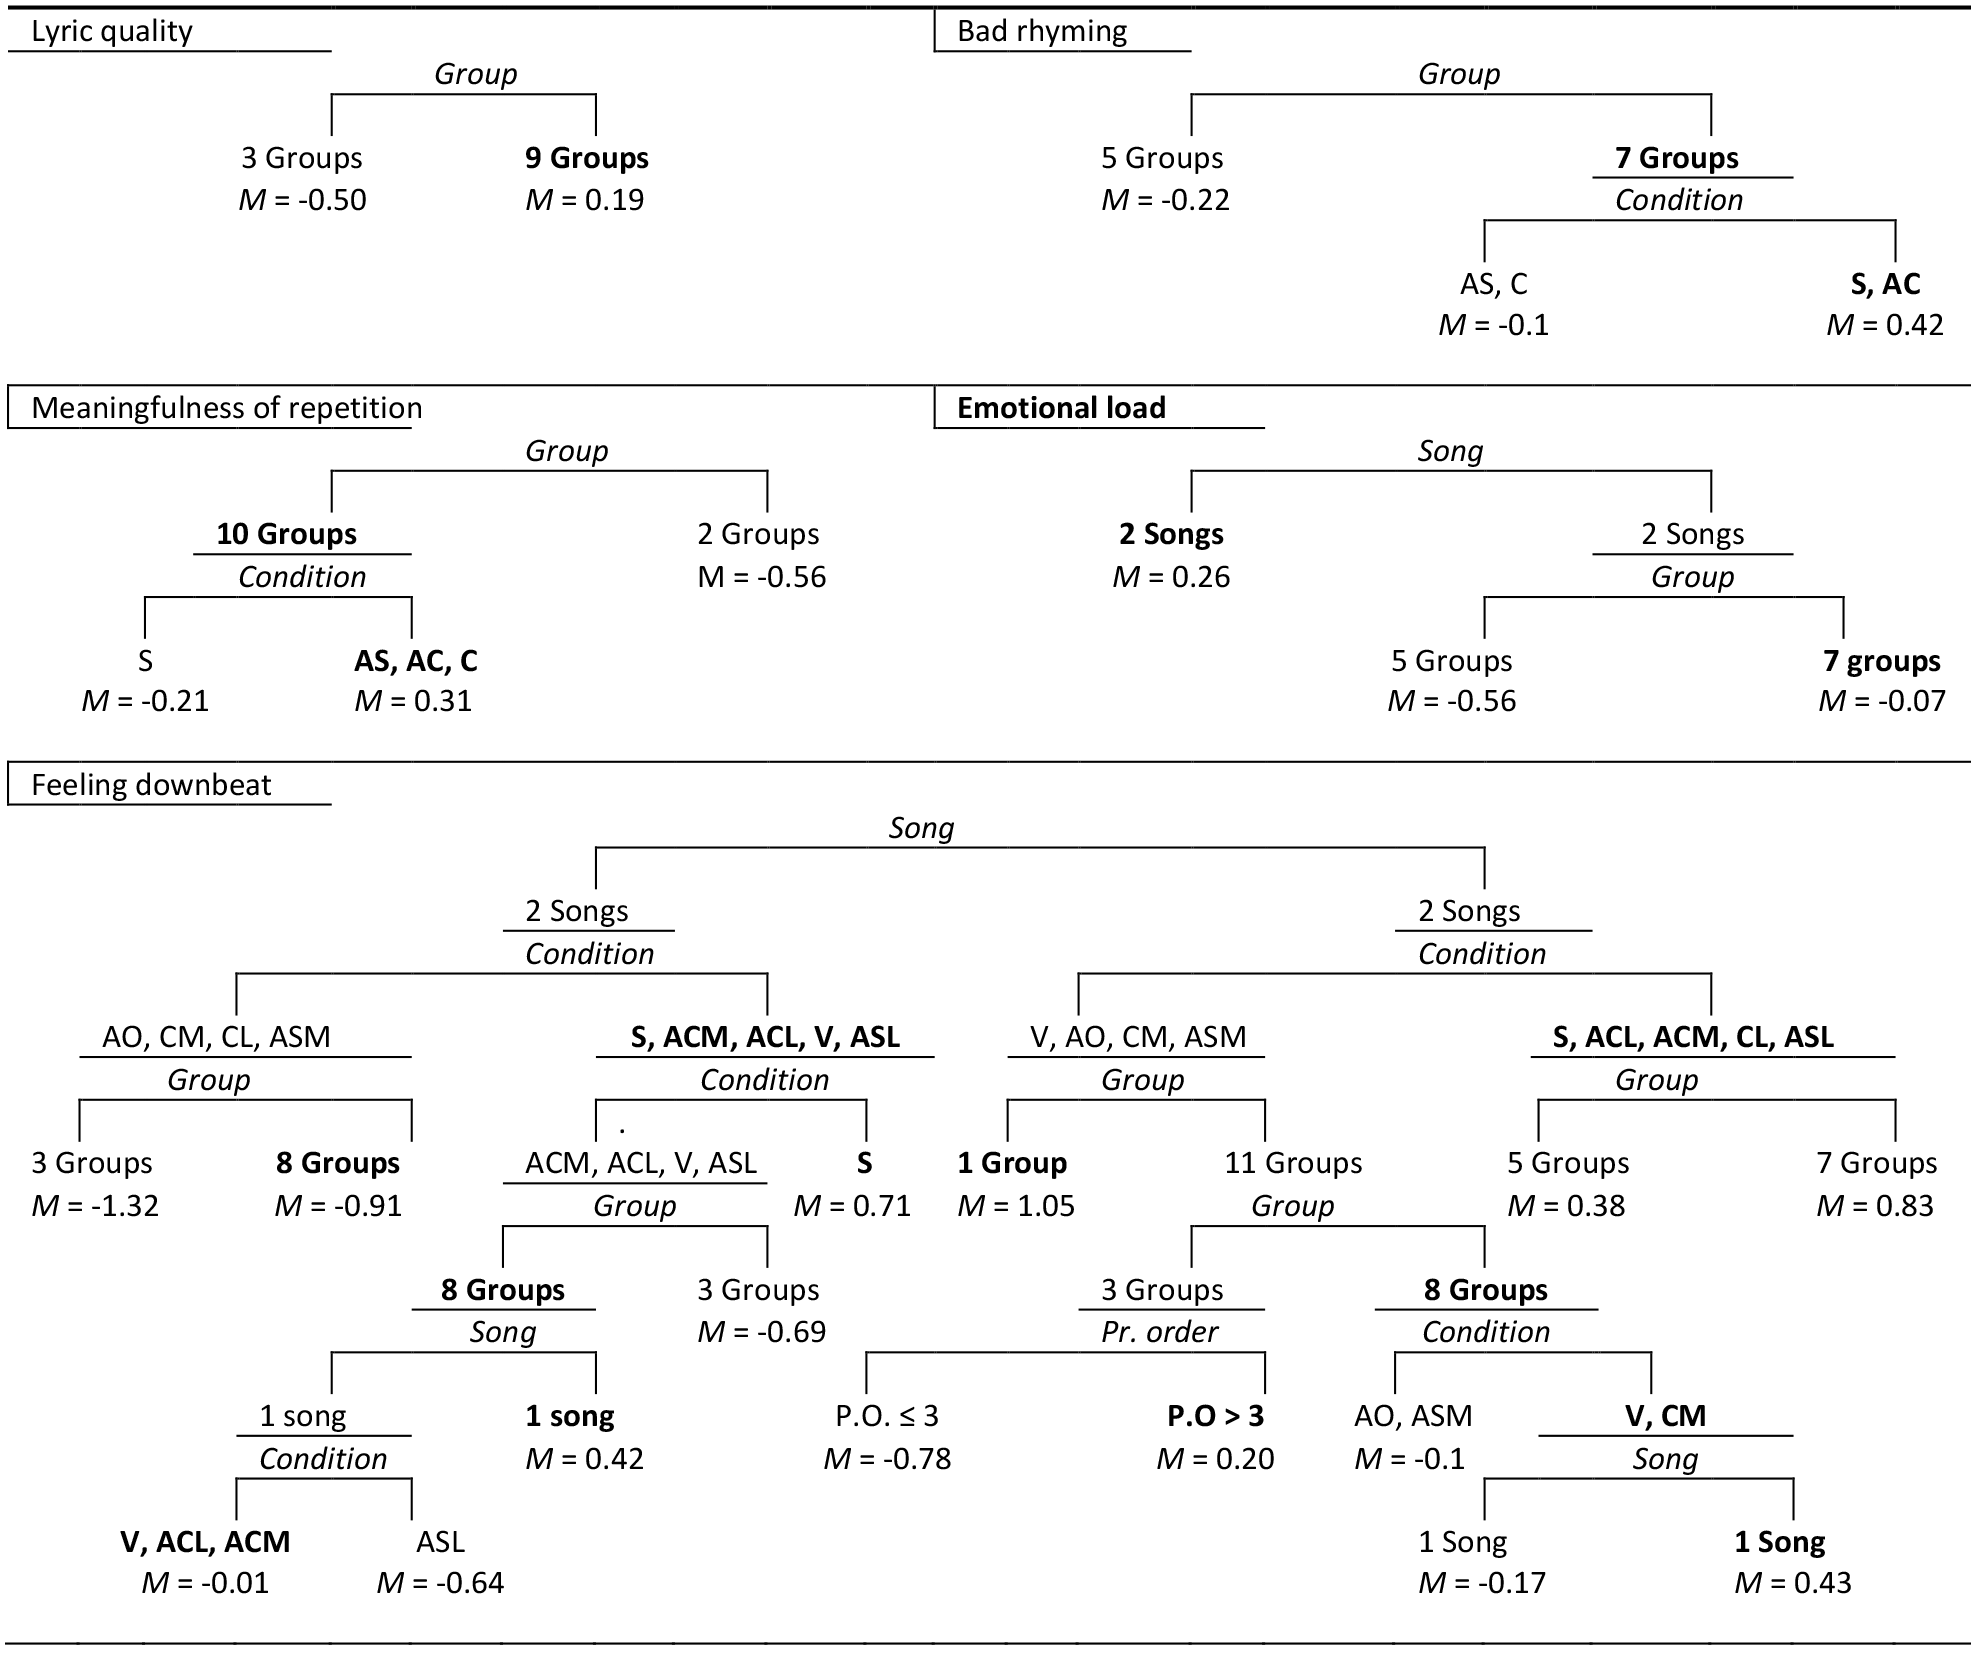
Figure 2b. CART trees belonging to the regressions summarized in Tables 6 and 7. Node with highest Mean after split in bold. Shaded splitters indicate the boundaries between the most predictive tree and the smallest one within 1 SE. Pr. Order = Presentation order. S = Spoken, ACL = A cappella lyrics; ACM = A cappella music; ASL = Accompanied speech lyrics; ASM = Accompanied speech music; CL = Complete lyrics; CM = Complete music; V = Vocalized song; AO = Accompaniment only.
The deviant patterns in the effect of condition on Lyric quality, Clearness and Meaningful repetition can also be interpreted as an effect of singing. As all these variables are related to lyric content, this indicates that singing does indeed function as a foregrounding device. Admittedly, the effect is relatively small in Lyric quality. However, as the main constituting variable 'beauty of the lyrics' did show a clear effect of singing (Schotanus, 2016a), this factor may be confounded by the ambiguity of one of the other constituting variables: poeticness. As the author knows from daily practice, school children often use 'poetic' as a synonym for difficult, incomprehensible, or unnecessarily vague, instead of an indication of lyric quality. In line with that, a post-hoc Goodman and Kruskal ordinal gamma test shows that pupils who rate the lyrics of a song highly poetic often also rate these lyrics as absolutely not beautiful. Additional research avoiding the term 'poetic' is desirable.
The effect of singing on Meaningfulness of repetitions is larger than the effect of accompaniment (which is still substantial). This is in line with the hypothesis (SH 1.6) that verbatim repetitions of words were rated more meaningful in conditions with music. These results indicate that repetition as a stylistic feature is not only more accepted in song lyrics than it is in printed or declaimed poetry, but also more meaningful.
Clearness (mainly a combination of intelligibility and comprehensibility) shows a clear division between sung versions and spoken ones, and therefore a clear effect of singing (SH 1.1, SH 1.2). Remarkably, perceived clearness of sung language is not significantly hampered by an accompaniment, while the perceived clearness of spoken language does tend to be hampered by this. At least, the original variable Intelligibility showed such an effect (Schotanus, 2016a). However, perceived Clearness may not be the same as actual clearness. The prosodic clarity of sung language could be misleading in a similar way as the prosodic clarity of rhetorical features (Menninghaus et al., 2015), or the illusion of comprehension served by graphs or analogies in texts used for a science class (Jaeger & Wiley, 2015). Therefore, it is important to investigate whether listeners would, indeed, show higher results for an intelligibility or comprehension task in sung versus spoken language.
Unfortunately, the comprehension task within the current experiment could not be reliably analysed. Expert judgments by two colleagues have shown that several comprehension questions were ambiguous, and when preparing the data for analysis I realized that even after changing the ambiguous questions for the 2016 trials it still was impossible to judge the answers unambiguously. However, the ratings concerning emotional meaning (see the next section) indicate that both singing and accompaniment do support lyric comprehension. Both a-cappella and complete versions are rated less as Feeling downbeat and more as Emotionally loaded than spoken versions, which is in line with the intended meaning of the songs that are cabaret songs meant to express serious feelings in a light and humorous manner. Spoken versions seem to be taken too seriously for these cabaret songs (SH 1.2).
FEELING DOWNBEAT AND EMOTIONAL LOAD
As Figure 3 shows, Feeling downbeat decreases depending on the amount of music involved in a song version, except that vocalized songs are rated more as Feeling downbeat than accompanied versions with lyrics. Whenever there is an accompaniment, the music of a certain track is even rated less as Feeling downbeat than the lyrics. Emotional load is highest in sung versions with lyrics, and lowest, by a substantial amount, in vocalized versions.
Indeed, condition turns out to be a significant predictor of both Feeling downbeat and Emotional load (see Table 6), but particularly of Feeling downbeat. Pairwise comparisons show that the differences between almost all Feeling downbeat ratings are significant (only six out of 45 combinations are not, see Table 7), and the CART tree shows relatively many splits concerning condition (see Figure 2b). These results are in line with SH 2.2 that music in general and accompaniment in particular support arousal, as well as with SH 1.2 (as discussed above) and with H 3. Moreover, in line with earlier findings (e.g., Ali & Peynircioǧlu, 2006; Brattico et al, 2011), the results indicate that the perceived happiness and humour of the accompaniments, and (to a lesser extent) of the melodies contribute to the perceived happiness and humour of the lyrics.
Nevertheless, one may wonder whether the ratings for specific songs would contradict the general pattern, or whether the songs in this experiment (all wordy cabaret songs representing mixed feelings, written and performed by the same person) are too similar to each other to allow for generalization. Admittedly, the CART tree shows a substantial effect of song. Furthermore, the perceived sadness of the spoken lyrics may have been increased by slow speech, since tempo is known to affect mood in music (Peretz, Gagnon, & Bouchard, 1998, among others).
However, regarding the relatively large effect of condition in both mixed model and CART regressions, the predictive power of the model (the CART tree even predicted 44% of the variance), the significance of the pairwise comparisons, and the fact that the CART tree-splits are all in line with the general pattern, it is fair to conclude that the effect of condition on Feeling downbeat is largely song independent. Moreover, as Figure 4 shows, all spoken versions are rated more as Feeling downbeat than any vocalized version or accompaniment, even though the vocalized and accompaniment-only versions of one of the songs were frequently associated with death, loss and suicide by the participants (see Schotanus, 2020, Chapter 3.4, for further details). Even the deviant ratings for song versions of JD in which music and lyrics are combined, do not contradict the pattern, as they can be explained by the fact that the vocalized version is less Feeling downbeat than the accompaniment-only version. This suggests that misalignments of musical mood and lyrical mood can have disastrous effects on the perceived emotions in a song.
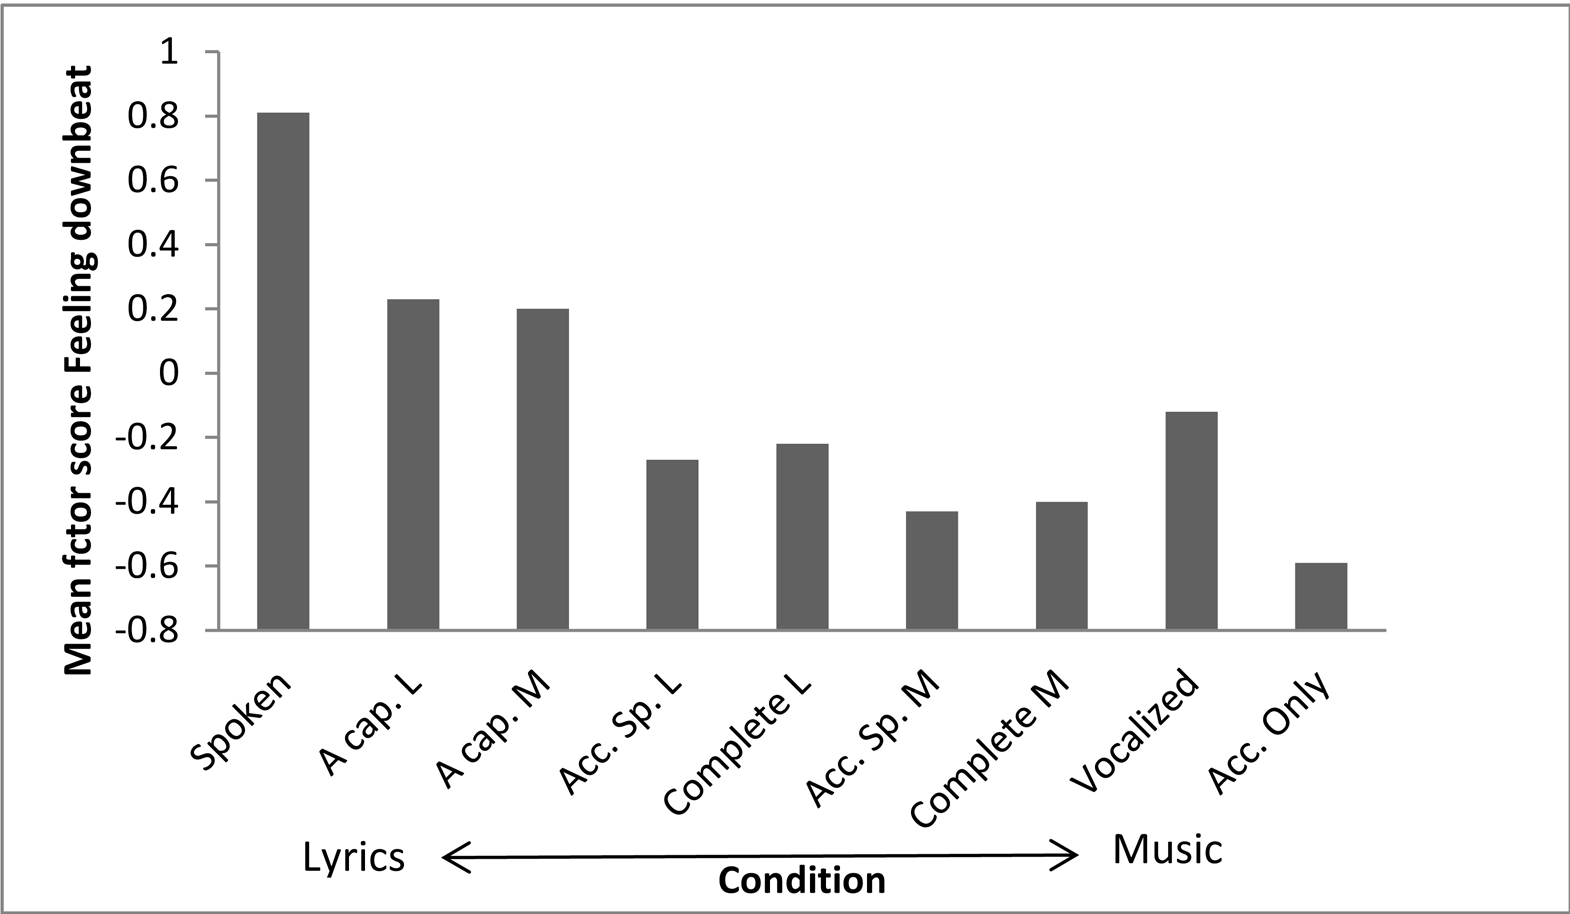
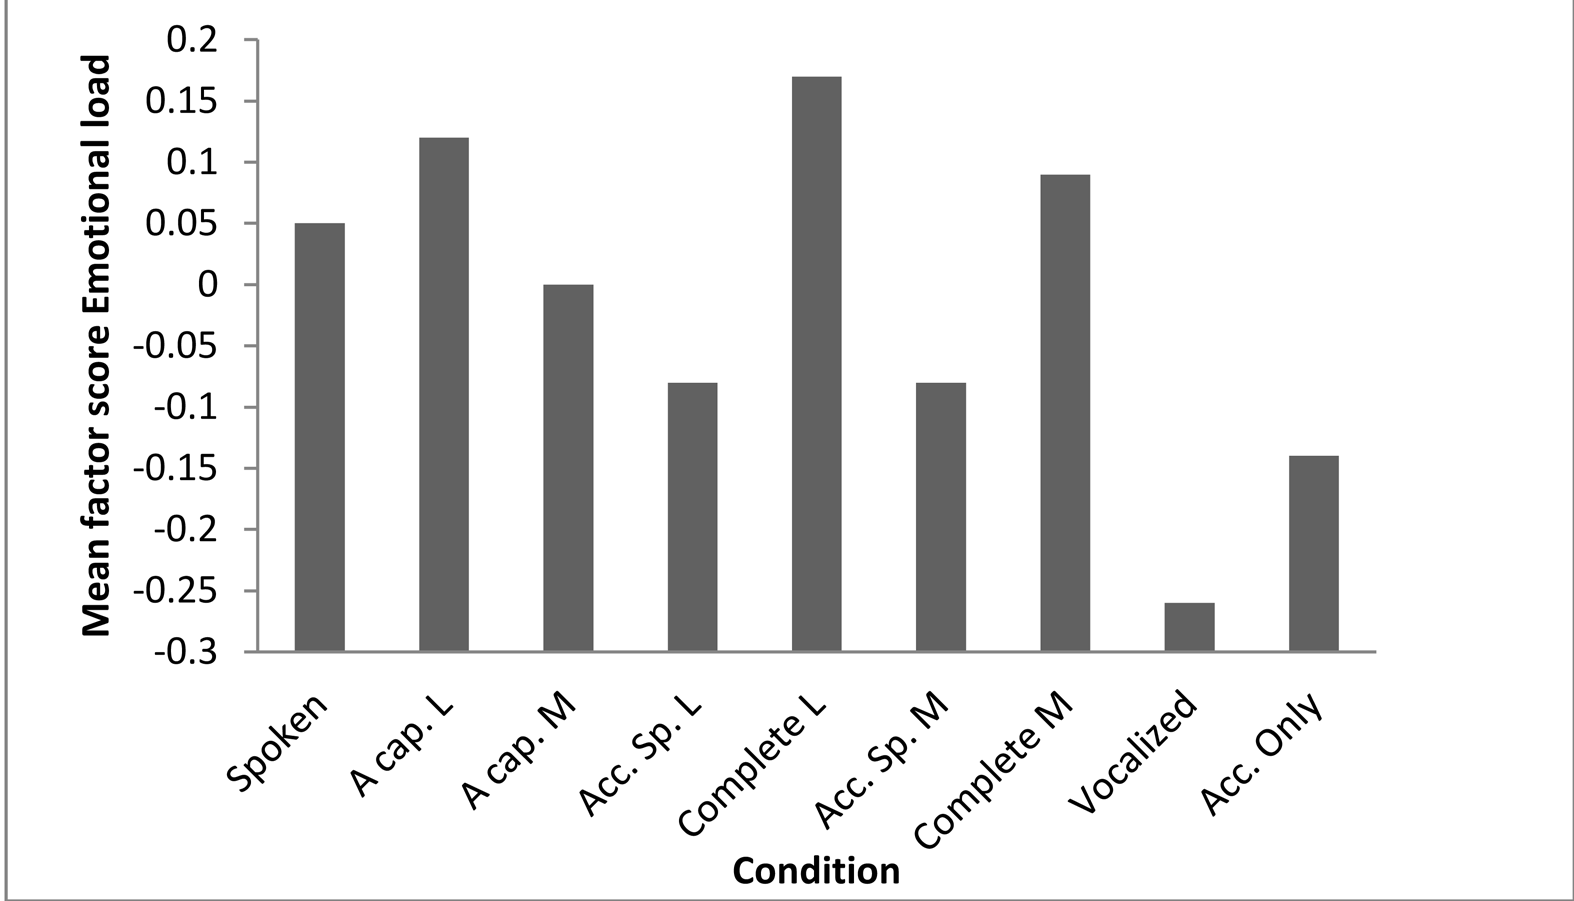
Figure 3. The effect of condition on emotion ratings. The more lyrics dominate over music in a song version, the higher the Feeling downbeat ratings. Emotional load ratings are highest when music and lyrics are combined. A Cap. = A cappella; Acc. Speech = Accompanied speech; Acc. Only = Accompaniment only; L = Lyrics; M = Music. For exact Means and SDs, see Appendix B.
For Emotional load, condition is less powerful as a predictor (see Table 7). Hence, fewer pairwise comparisons are significant, and the CART tree predicting Emotional load has no split for condition. Depending on the regressions, Emotional load seems to be mainly a matter of lyrics. This may indicate that Emotional load is a semantic-content related variable, and seems to contradict the hypothesis that non-verbal music can convey meaning. However, the highest emotional-load ratings are for a cappella lyrics and complete lyrics, not for spoken versions, which suggests that music enhances the emotional load in the lyrics. Furthermore, the CART tree does not show an effect of condition, and an inspection of the mean ratings per song (see Figure 4) shows that, indeed, there is no regular pattern. For example, both the melody and the accompaniment of two songs are rated as relatively emotionally loaded. Emotional load is therefore not a lyric-related factor, although it may be a semantic-content-related one.
In connection with this, it is important to note that an earlier analysis of the data from this experiment (Schotanus, 2016a) revealed that combinations of lyrics and music are rated as relatively funny compared to both non-verbal and spoken versions. Unfortunately, in the current study humour ratings were largely lost in the Factor analysis. However, both Emotional load and humour ratings indicate that Feeling downbeat does not tell us the whole story about the contribution of music and lyrics to the overall meaning of a song. These variables show less consistent, but significantly different patterns.
| Feeling downbeat | Emotional load | |
|---|---|---|
| Mixed | Mixed | |
| AICintercept | 4238.24 | 4223.42 |
| AIC | 3603.49 | 4173.43 |
| N valid | 1624 | 1624 |
| N excluded | 842 | 842 |
| Fixed | F | F |
| Condition | 47.76*** | 5.72*** |
| Presentation order | 10.98*** | a |
| Cond.*Pres. order | 8.63*** | a |
| Musicianship | ||
| CART | CART | |
| R2 learn | .46 | .10 |
| R2 test | .42 | .09 |
| RE | .59 | .91 |
| RVI | RVI | |
| Condition | 100 | 7.69 |
| Musicianship | 0.08 | 1.22 |
| Group | 40.97 | 55.36 |
| Presentation order | 35.43 | 9.53 |
| Song | 90.96 | 100 |
a AIC for a model with presentation order and condition*presentation order showed a significant effect of condition*presentation order but was slightly larger.
| P < .001 | P < .01 | P < .05 | P < .06 | Not significant | |
|---|---|---|---|---|---|
| Feeling downbeat | All, except… (see other columns) | V > CL & ASM; CL > CM | V > ASL; ASM > CM; CL > ASM; ACL > ASM & ACM; ACM > ASL | ||
| Emotional load | V < all, except AO; AO < all, except V & ACM | AO < ACM; ACM < ACL | ACM < CL | rest |
AC = A cappella, AO = Accompaniment only, AS = Accompanied speech, C = Complete, S = Spoken, V = Vocalized
RHYMING PERCEPTION AND RECALL
Unfortunately, testing SH 1.4, on rhyming perception, met with several problems. First, not all of the participants appeared to be sufficiently familiar with the notion of 'sound repetitions' to understand that this also includes off rhymes and alliterations. Second, while reading the text fragment, they may have detected sound repetitions they did not hear. Third, the question whether there is much rhyme is problematic: in songs, rhyme is normal, so even when participants detect more rhymes in sung conditions than in spoken ones, they may still rate the amount of rhymes in the sung condition as relatively low. Finally, although regressions on Bad rhyming show a significant effect of condition, indicating that accompaniment makes rhyming less 'bad', it is unclear what this means. Are the rhymes detected more easily (SH 1.4), are they more acceptable (like verbal repetitions) (SH 1.6), or do they just benefit from the general increase of aesthetic valence in conditions with accompaniment (SH 1.3)? Other measures than the ones used in the current experiment are required to answer these questions.
The recall scores were unreliable as well, because several pupils filled out the recall questions while the song was still audible. They had received all the questionnaires in one stapled bundle in order to keep each participant's work together, and were asked to wait, but not everybody complied. Furthermore, the sample size for the follow-up delayed recall questionnaire was too small to allow for reliable analyses. Hence SH 1.5 could not be tested at all. Nevertheless, two interesting observations could be made. First, recall for KT and JD seemed to be better than for WS and LY; several pupils recalled words or phrases of these songs, while only one recalled a phrase of one of the other songs. Second, just a few participants thought that one of the fake descriptions represented a song they had heard, although most of them were not able to remember anything specific about any of the songs.
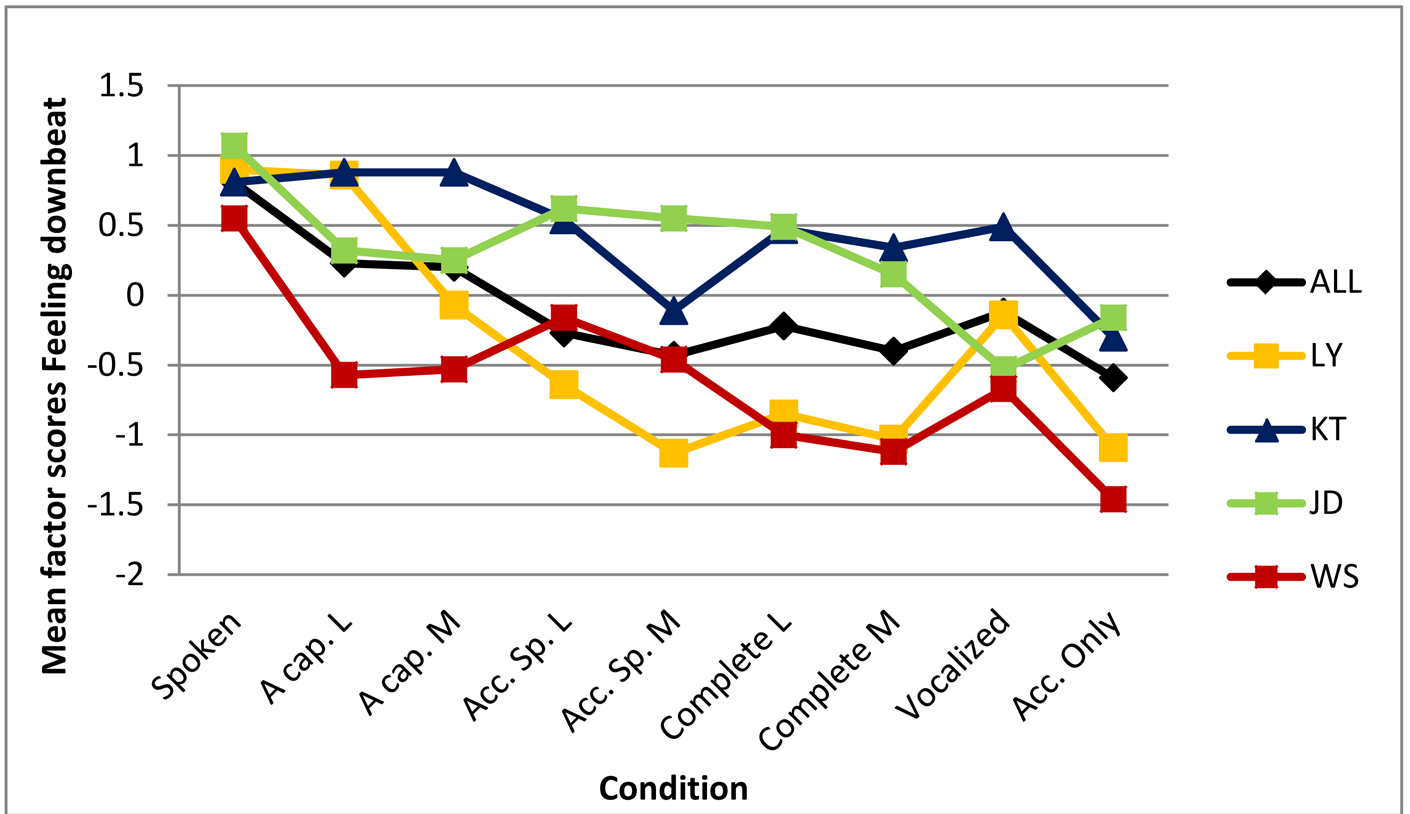
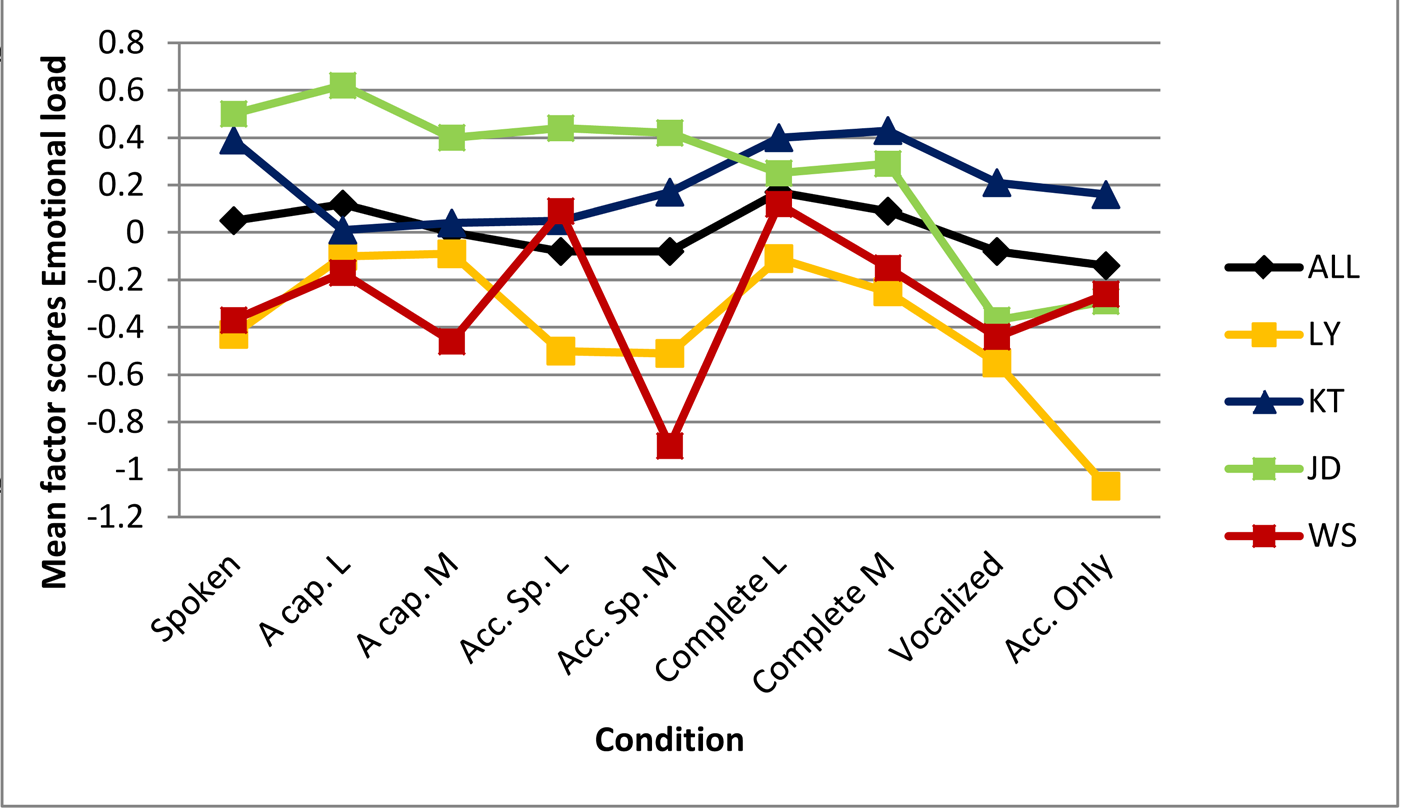
Figure 4. Comparison between song-specific effects of condition on emotion ratings and the general pattern (ALL). Lines are meant to facilitate pattern-comparison and do not represent a gradual transition between two conditions.A cap. = A cappella; Acc. speech = Accompanied speech; Acc. Only = Accompaniment only; L = Lyrics; M = Music. LY = 'But I love you'; KT = 'Keep it like that'; JD = 'Jolly depressed'; WS = 'What suits'. For exact Means and SDs see Appendix B.
MUSICIANSHIP
Musicianship was the only significant covariate in mixed model regressions on focus, Voiceless intervals and Bad rhyming, and a relatively important variable in CART trees predicting focus, Bad Rhyming, and purity, although it did not occur in the actual tree predicting Bad rhyming. Remarkably, these variables can all be linked directly to musical phenomena: silences, out-of-key notes, and regularly occurring sounds. Furthermore, these results indicate that musicianship is particularly beneficial when processing spoken or a-cappella song versions.
SONGS IN THE CLASSROOM
The abovementioned positive effects of accompanied and unaccompanied singing indicate that, at least in a classroom situation, singing supports the communication of verbal information, even if a song is presented only once (H1). Moreover, the positive effects on arousal, emotion, concentration, and attitude towards the songs presented provide evidence for earlier claims that songs enhance attention and motivation in the classroom (Cohen, 2005; Fonseca-Mora & Gant, 2016; Goering & Burenheide, 2010; Good, Russo, & Sullivan, 2015; Msila, 2013; Sitomer, 2008; among others), and thus may enhance learning. Furthermore, the effect of singing on Clearness indicates that difficult language (for example seventeenth-century poetry, difficult words, or a foreign language) may be more accessible when it is sung, especially when listeners can read along using a printed version (Hansen & Hansen, 1991). Finally, using songs in the classroom may be particularly beneficial to non-musicians.
However, additional research is required. Several topics need to be investigated: the physiological or neurophysiological underpinnings of these results, the differences between normal and musicalized speech, and the concrete implications of these findings, either in the classroom or in other contexts, such as poetry performances. Furthermore, a replication of this Study in a more randomized design would be welcome. Study 2 provides a partial replication of the research in a more randomized design.
STUDY 2
An opportunity to investigate whether the results of Study 1 could be replicated in a design less confounded by group effects arose when a laboratory experiment (aiming for EEG and GSR measures) was conducted among 24 adults, using the same stimuli and almost the same questionnaires in a pseudo-randomized order (Schotanus, Eekhof & Willems, 2018). So far, only part of the behavioural data from this experiment has been analysed. Schotanus, Eekhof, and Willems (2018) only reported regressions on the four factors retained after a factor analysis of the ratings for 17 lyric and voice related items, and on the results of the enhanced recall task. The results were largely in line with those of Study 1. The scores for both a factor indicating positive valence (i.e., positive feelings, listening comfort and positive aesthetic value), and a factor indicating voice quality were rated higher in complete versions compared to a-cappella and spoken versions. For two other factors, Seriousness (a combination of sad feelings, emotivity, and high text quality), and Strikingness of textual features (a combination of humour and striking formulations), only the differences between complete and spoken versions were significant. The ratings for Seriousness were lower while the ratings for Strikingness of textual features were higher in complete versions. Furthermore, cued recall was higher in a-cappella versions compared to spoken versions. These results indicate, again, that an accompaniment supports processing fluency and positive valence, but that singing supports conscious lyric-processing. However, important items such as focus, purity, voiceless intervals, and meaningfulness of repetitions, as well as the separate emotion ratings for the music, have not yet been analysed. The main aim of the current study is to fill these gaps.
Method
As this study makes use of the same dataset as Schotanus, Eekhof and Willems (2018), the information on participants, stimuli and experimental design will be summarized in order to avoid unnecessary duplications.
PARTICIPANTS
For this experiment 24 participants (18 women) were recruited from the subject pool of Radboud University Nijmegen. Participants were aged between 19 and 37 years (M = 24.4; SD = 4.8). In this case musical experience was measured using the Dutch translation (Bouwer, Schotanus, Sadakata, Müllensiefen, & Schaefer, in preparation) of the Gold MSI (Müllensiefen, Gingras, Stewart, & Musil, 2014).
STIMULI
Sixteen different tracks were used as stimuli, i.e., the spoken, a-cappella, vocalized and complete versions of the four songs used in Study 1.
DESIGN
The participants each listened individually to four of the 16 tracks in a small, soundproof booth with a desk and a computer screen in front of the participant, from which the stimuli were played over Sennheiser HD 215 headphones. Songs and conditions were distributed pseudo randomly among the 24 participants in such a way that each song was used in each condition six times, and that each participant heard all song once, each in another condition. The start of each song was indicated by a beep, and a fixation cross accompanied each song until the end in order to make sure participants would not erroneously think the song had finished during silences in the conditions without an accompaniment. After each song, participants manually filled out questionnaires about the track they had just heard.
QUESTIONNAIRES
The questionnaires were the same as in Study 1, except that the five-point Likert scale was changed into a seven-point scale in order to allow for more advanced statistical methods, and 'nagging' was changed into 'calming', a more comprehensible concept according to the authors, thought to represent the opposite of nagging. Furthermore, in line with the discussion section of Study 1, the item 'The lyrics are poetic' was replaced by two other items (i.e., 'There are special/striking formulations in the text', and the recall task was changed into a fill-in-the-gap cued recall task.
STATISTICAL ANALYSIS
The statistical analyses are comparable to those in Study 1. However, random intercepts were modelled for participant and song, not for group, and either the Gold MSI or its subscales were used as covariates. In mixed models, insignificant variables (except for condition) were deleted from the model unless it was weakened by deleting them, relying on the AIC, models with the Gold MSI where always weaker than models with one or two of its subscales. In CART trees, GMSI subscales were deleted if the optimal tree had no splits, if splits seemed non-interpretable, or if RVI for a GMSI subscale was low (< 10). The factor song was deleted only if the optimal tree had no splits.
EHTICS STATEMENT
The experiment was conducted in line with the Declaration of Helsinki. It was approved by the internal ethics review board of Radboud University, and all participants signed an informed consent form before the experiment started.
Results and Discussion
A Principal Axis Factoring Analysis was conducted on the ratings for happiness, sadness, humour, emotivity, energetic quality, heaviness and calming quality from the laboratory study. Two factors had eigenvalues over 1 and were retained. Depending on the factor loadings (see Table 8) these factors represent by and large the same phenomena as those in the classroom study. However, the first one (a combination of happiness, energetic quality and, to a lesser extent, humour) now emerges as the inverse of Feeling downbeat and therefore will be called Feeling upbeat. Furthermore, this time emotivity is not only the central contributor to the second factor, Emotional load, but also the most important one, before sadness, heaviness and calming quality. Remarkably, calming quality contributes positively to both factors, whereas in the classroom study the supposed opposite of calming quality, nagging quality, was only a contributor to the first factor, Feeling downbeat.
This leads to the rather counterintuitive secondary conclusion that both 'calming' and 'not nagging' are positively correlated with 'energetic'. Relying on earlier findings, one would rather expect something nagging to be more energetic (high arousal level) than something calming (low arousal level) (Coffman et al., 1995; Russell, Ward & Pratt, 1981). There could be several explanations. First, 'energetic quality' is a property of a song, while 'nagging quality' and 'calming quality' are rather like felt emotions attributed to the music. Second, the negative effect of increased energy may have been overruled by the calming effect of the regular rhythm music provides, which is hypothesized as being less clear in a-cappella singing (see introduction) or in the atonal music Coffman and colleagues used. A further increase in energy will probably make a song ultimately less calming. Finally, an accompaniment could function as a distracter within the song, which would probably also make it less nagging.
For two other factor analyses on variables which were not analyzed yet in Schotanus, Eekhof & Willems (2018) (three variables concerning verbatim repletion, and two concerning distraction by voiceless intervals) the sampling adequacy of the data was poor (for the latter all measures of sampling adequacy were as low as .5). Nevertheless, both analyses were conducted in order to be able to compare the results with those in Study 1, and just as in the classroom study, after each analysis, one factor with an eigenvalue higher than 1 was retained (i.e., Meaningfulness of repetition and Voiceless intervals). Therefore, although there are differences between the factors in both studies, it appears to make sense to compare the results of the regressions on them.
| Emotions | Repetition | VI | ||
|---|---|---|---|---|
| KMO | .73 | .58 | .5 | |
| Determinant | .10 | .46 | .71 | |
| Df | 21 | 3 | 1 | |
| Feeling upbeat | Emotional load | Meaningfuln. of repetition | Voiceless intervals | |
| Factor loadings | ||||
| Happy | .81 | |||
| Sad | -.69 | .38 | ||
| Emotive | .88 | |||
| Funny | -.37 | |||
| Energetic | .83 | .27 | ||
| Heavy | -.54 | .50 | ||
| Calming | .27 | .37 | ||
| Repetition superfluous | -0.90 | |||
| Increased feeling | 0.77 | |||
| Increased meaning | 0.37 | |||
| VIs are nice | -.73 | |||
| VIs are distracting | .73 | |||
| Eigenvalue | 2.75 | 1.71 | 1.90 | 1.54 |
| % of Variance predicted | 39.30 | 24.37 | 63.39 | 76.74 |
| Sum of squared loadings | 2.30 | 1.38 | 1.53 | 1.07 |
Meaningfuln. of repetition = Meaningfulness of repetition
For all matrices Bartlett's test was significant, and the Measure of Sampling Adequacy for each variable was > .5 or = .5 in the case of VI ratings.
A visual inspection of the mean scores per condition per variable (see Figure 5) indicates that the patterns are comparable to those in the classroom experiment reported in Study 1. Again, focus and purity are higher in song versions with accompaniment than in song versions without, while Voiceless intervals is lower. However, the ratings for vocalized versions were much more negative in the classroom study. Meaningfulness of repetitions shows an exactly similar pattern, and Feeling upbeat, predictably, shows an inverse pattern compared to Feeling downbeat. Emotional load only shows a deviant score for a cappella lyrics, which was rated relatively highly in the classroom study.
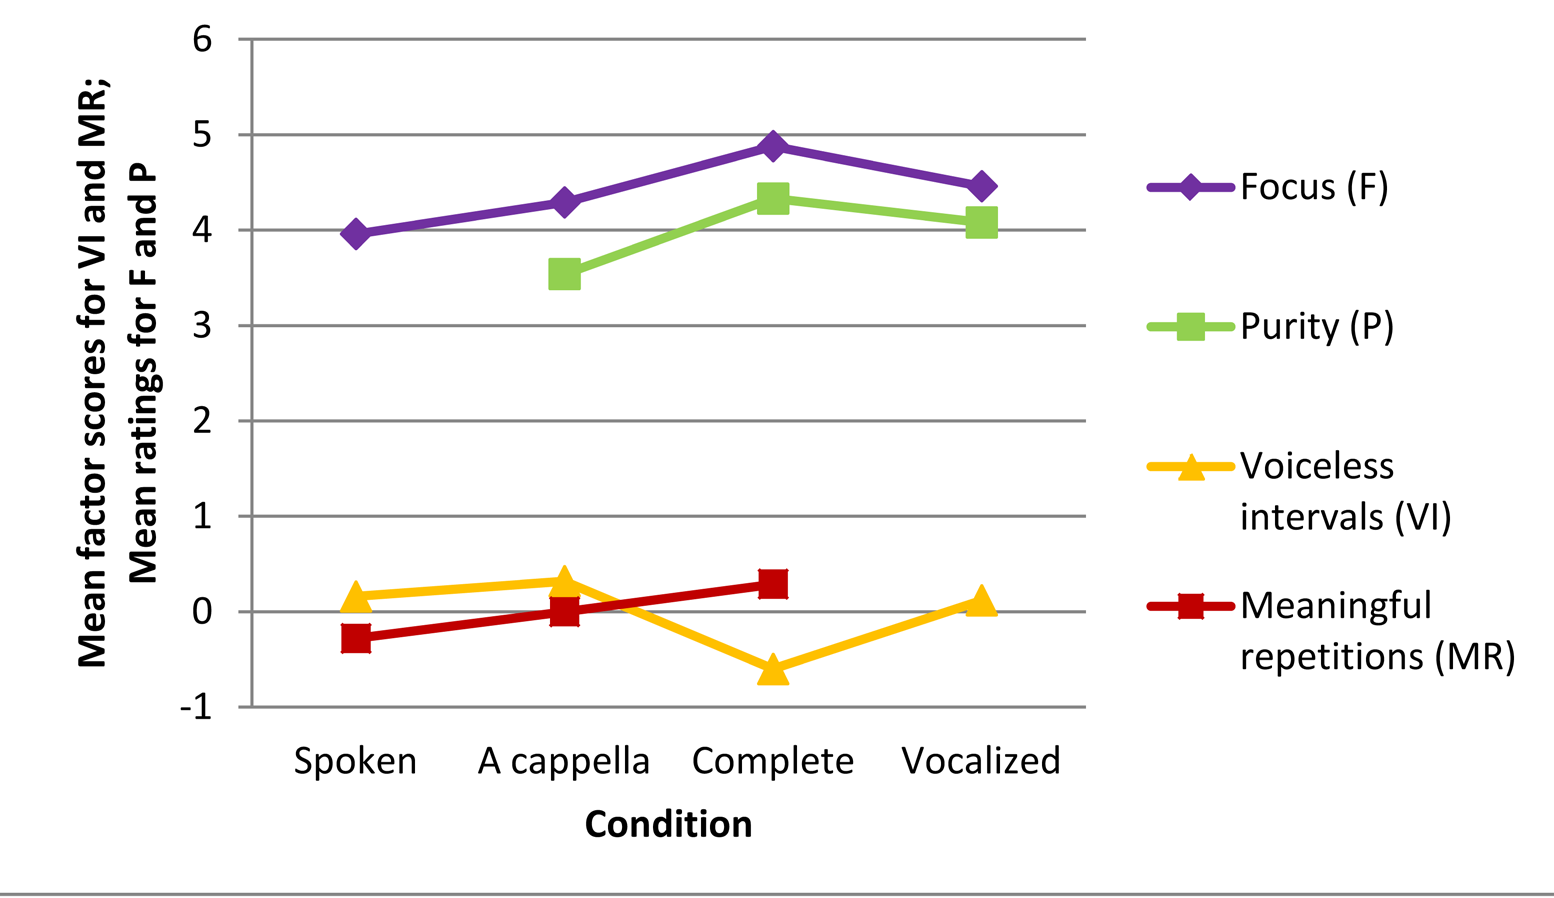
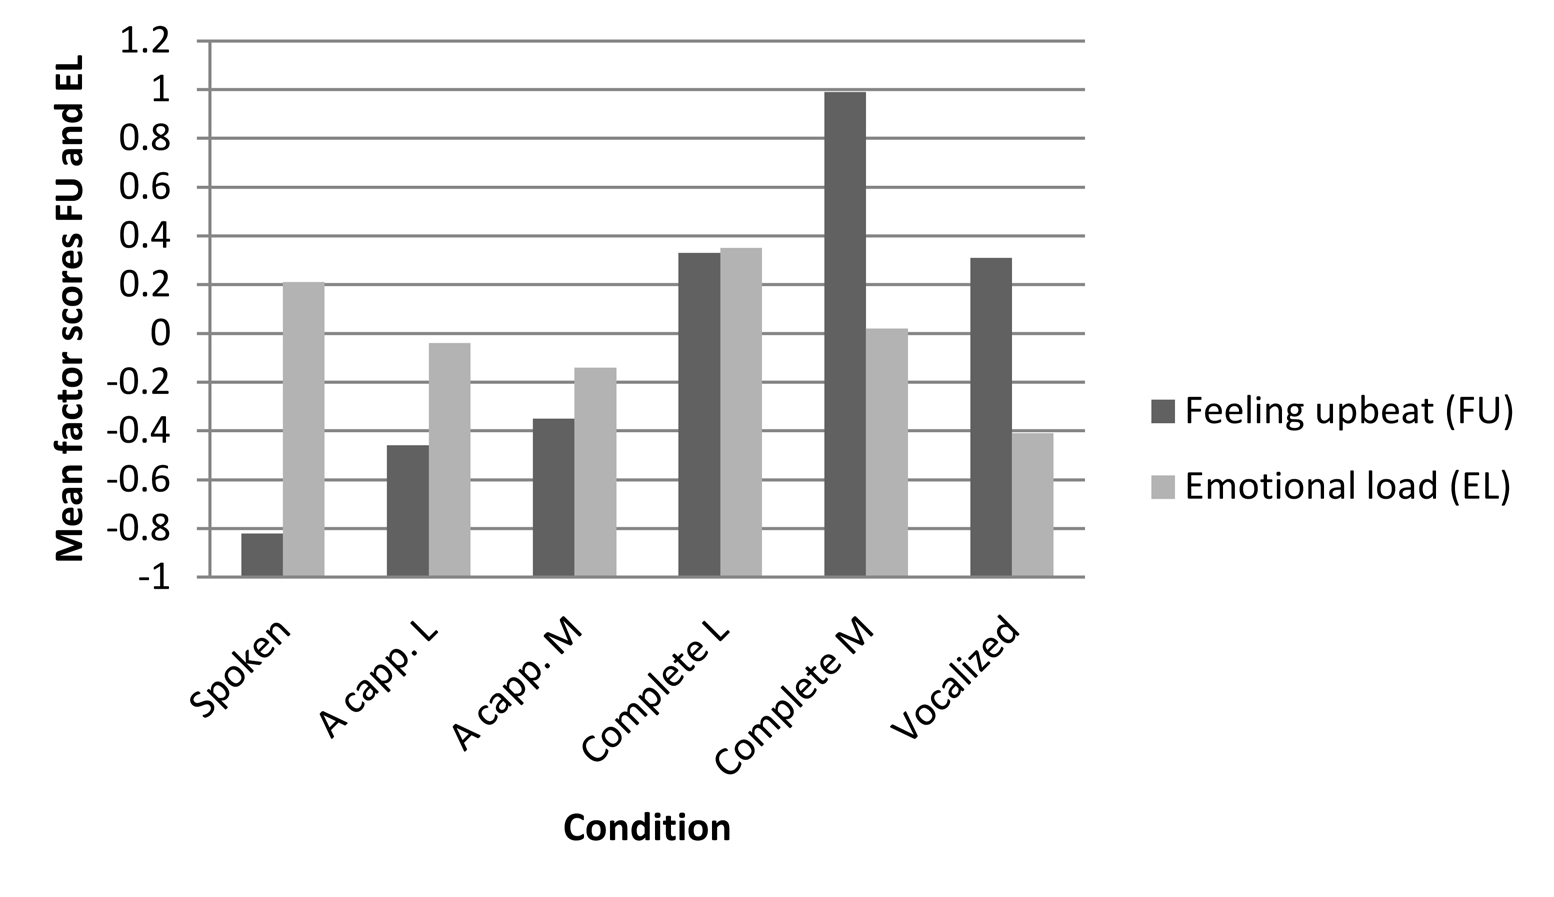
Figure 5. Patterns in the effect of condition on focus, purity, Voiceless intervals, Meaningfulness of repetitions, Feeling upbeat and Emotional load. Lines are meant to facilitate pattern-comparison and do not represent a gradual transition between two conditions. A capp. = a cappella; L = lyrics; M = Music. For exact Means and SDs, see Appendix B.
Although there were only 24 participants in the laboratory study, regressions on all these variables show a significant effect of condition, except Meaningfulness of repetition (see Table 9). However, pairwise comparisons with Bonferroni corrections (see Table 10) reveal that verbal repetitions in complete versions are rated as significantly more meaningful than spoken versions (p = 0.04). In line with these results, most of the CART trees also show effects of condition (see Table 11 and Figure 6). In line with the results of the classroom study and Hypotheses 2, 2.2, 2.3 and 2.4, complete versions, which are the only song versions with an accompaniment in this experiment, received the most positive ratings for focus, purity and voiceless intervals. However, this time vocalized versions have relatively positive scores as well. Both pairwise comparisons and CART trees reassert this observation. For example, the focus scores for vocalized versions are relatively high, although in the classroom study these versions were rated as hard to focus on. The adult participants in the laboratory study, who may be used to unusual stimuli, were probably less put out by the 'lalala' lyrics than the pupils, and they were therefore better able to process this as music. This would also explain the differences between the ratings for vocalized and a-cappella versions. The presence of language seems to hamper the processing of the music in a-cappella versions, compared to (a cappella) vocalized versions. Hence the relatively low scores for purity, and high scores for (distraction of) Voiceless intervals in the a-cappella condition, which are even higher than those for spoken versions. These results suggest that the enhanced recall in a-cappella versions is indeed related to foregrounding effects, i.e. that language processing is enhanced by obstructing it.
| Focus | Purity | Voiceless intervals | Meaningful repetitions | Feeling upbeat | Emotional load | |
|---|---|---|---|---|---|---|
| AICintercept | 333.32 | 244.10 | 267.78 | 207.64 | 403.97 | 389.07 |
| AICmodel | 330.25 | 226.50 | 253.45 | 207.33 | 324.31 | 375.11 |
| F | F | F | F | F | F | |
| Condition | 92.52*** | 8.20*** | 5.87** | 1.50 | 22.46*** | 2.97* |
| GMSI m. training | a | b | 15.23** | |||
| GMSI singing ab. | a | b | 8.98** | |||
| GMSI emotions | 21.32*** |
For parameter estimates for random intercepts see Appendix C.
a AIC for an alternative model with GMSI Musical training & GMSI singing abilities is higher (229.82).
b Musical training and Singing abilities were only significant in a model along with other GMSI subscales; AIC for this model was higher.
| P < .001 | P < .01 | P < .05 | P < .06 | n.s. | |
|---|---|---|---|---|---|
| Focus | C > S | C > AC | |||
| Purity | C > AC | Rest | |||
| Voiceless intervals | C > S; C > AC | C > V | Rest | ||
| Meaningful rep. | C > S | Rest | |||
| Feeling upbeat | All, except: | ACM > S; ACL > S | CL > V; ACM > ACL | ||
| Emotional load | CL > V | S > V | CL > ACM | CM > V | Rest |
AC = A cappella, AO = Accompaniment only, AS = Accompanied speech, C = Complete, S = Spoken, V = Vocalized, M = Music, L = Lyrics
| Focusa | Purity | Voiceless intervalsc | Meaningful repetitiond | Feeling upbeat | Emotional loade | |
|---|---|---|---|---|---|---|
| R2learn | .13 | .54 | .40 | .05 | .54 | .25 |
| R2test | .03 | .32 | .13 | .02 | .43 | .10 |
| RE | .99 | .71 | .91 | .98 | .57 | .94 |
| Rvi | Rvi | Rvi | Rvi | Rvi | Rvi | |
| Condition | 100 | 33.41 | 99.02 | 100 | 100 | 0 |
| GMSI emotions | b | 100 | 85.69 | b | b | b |
| GMSI m. training | b | 85.68 | 100 | b | b | 100 |
| GMSI singing ab. | b | 33.68 | 43.48 | b | b | 61.11 |
| GMSI perc. ab | b | 33.44 | 69.96 | b | b | b |
| GMSI active en. | b | 30.65 | 48.94 | b | b | 18.69 |
| Song | 53.96 | 41.87 | 43.48 | b | 43.48 | 0 |
m. training = musical training; singing ab. = singing abilities; perc. ab. = perceptual abilities; active en. = active engagement
a An alternative model with all GMSI-subscales yielded a tree with two splits, indicating that concentration is highest in people with perceptual abilities between 32 and 43; RE for the smallest tree within one SE > 1.
b Variable deleted.
c The smallest tree within one SE from the most predictive one only has two nodes and is much less predictive (R2 test = 0.07; RE = 0.98), but if Song is deleted from the model, R2 for the same trees increases.
d RE for the smallest tree within one SE from the most predictive one > 1.
e Including more GMSI scales weakens the model, but the tree remains the same.
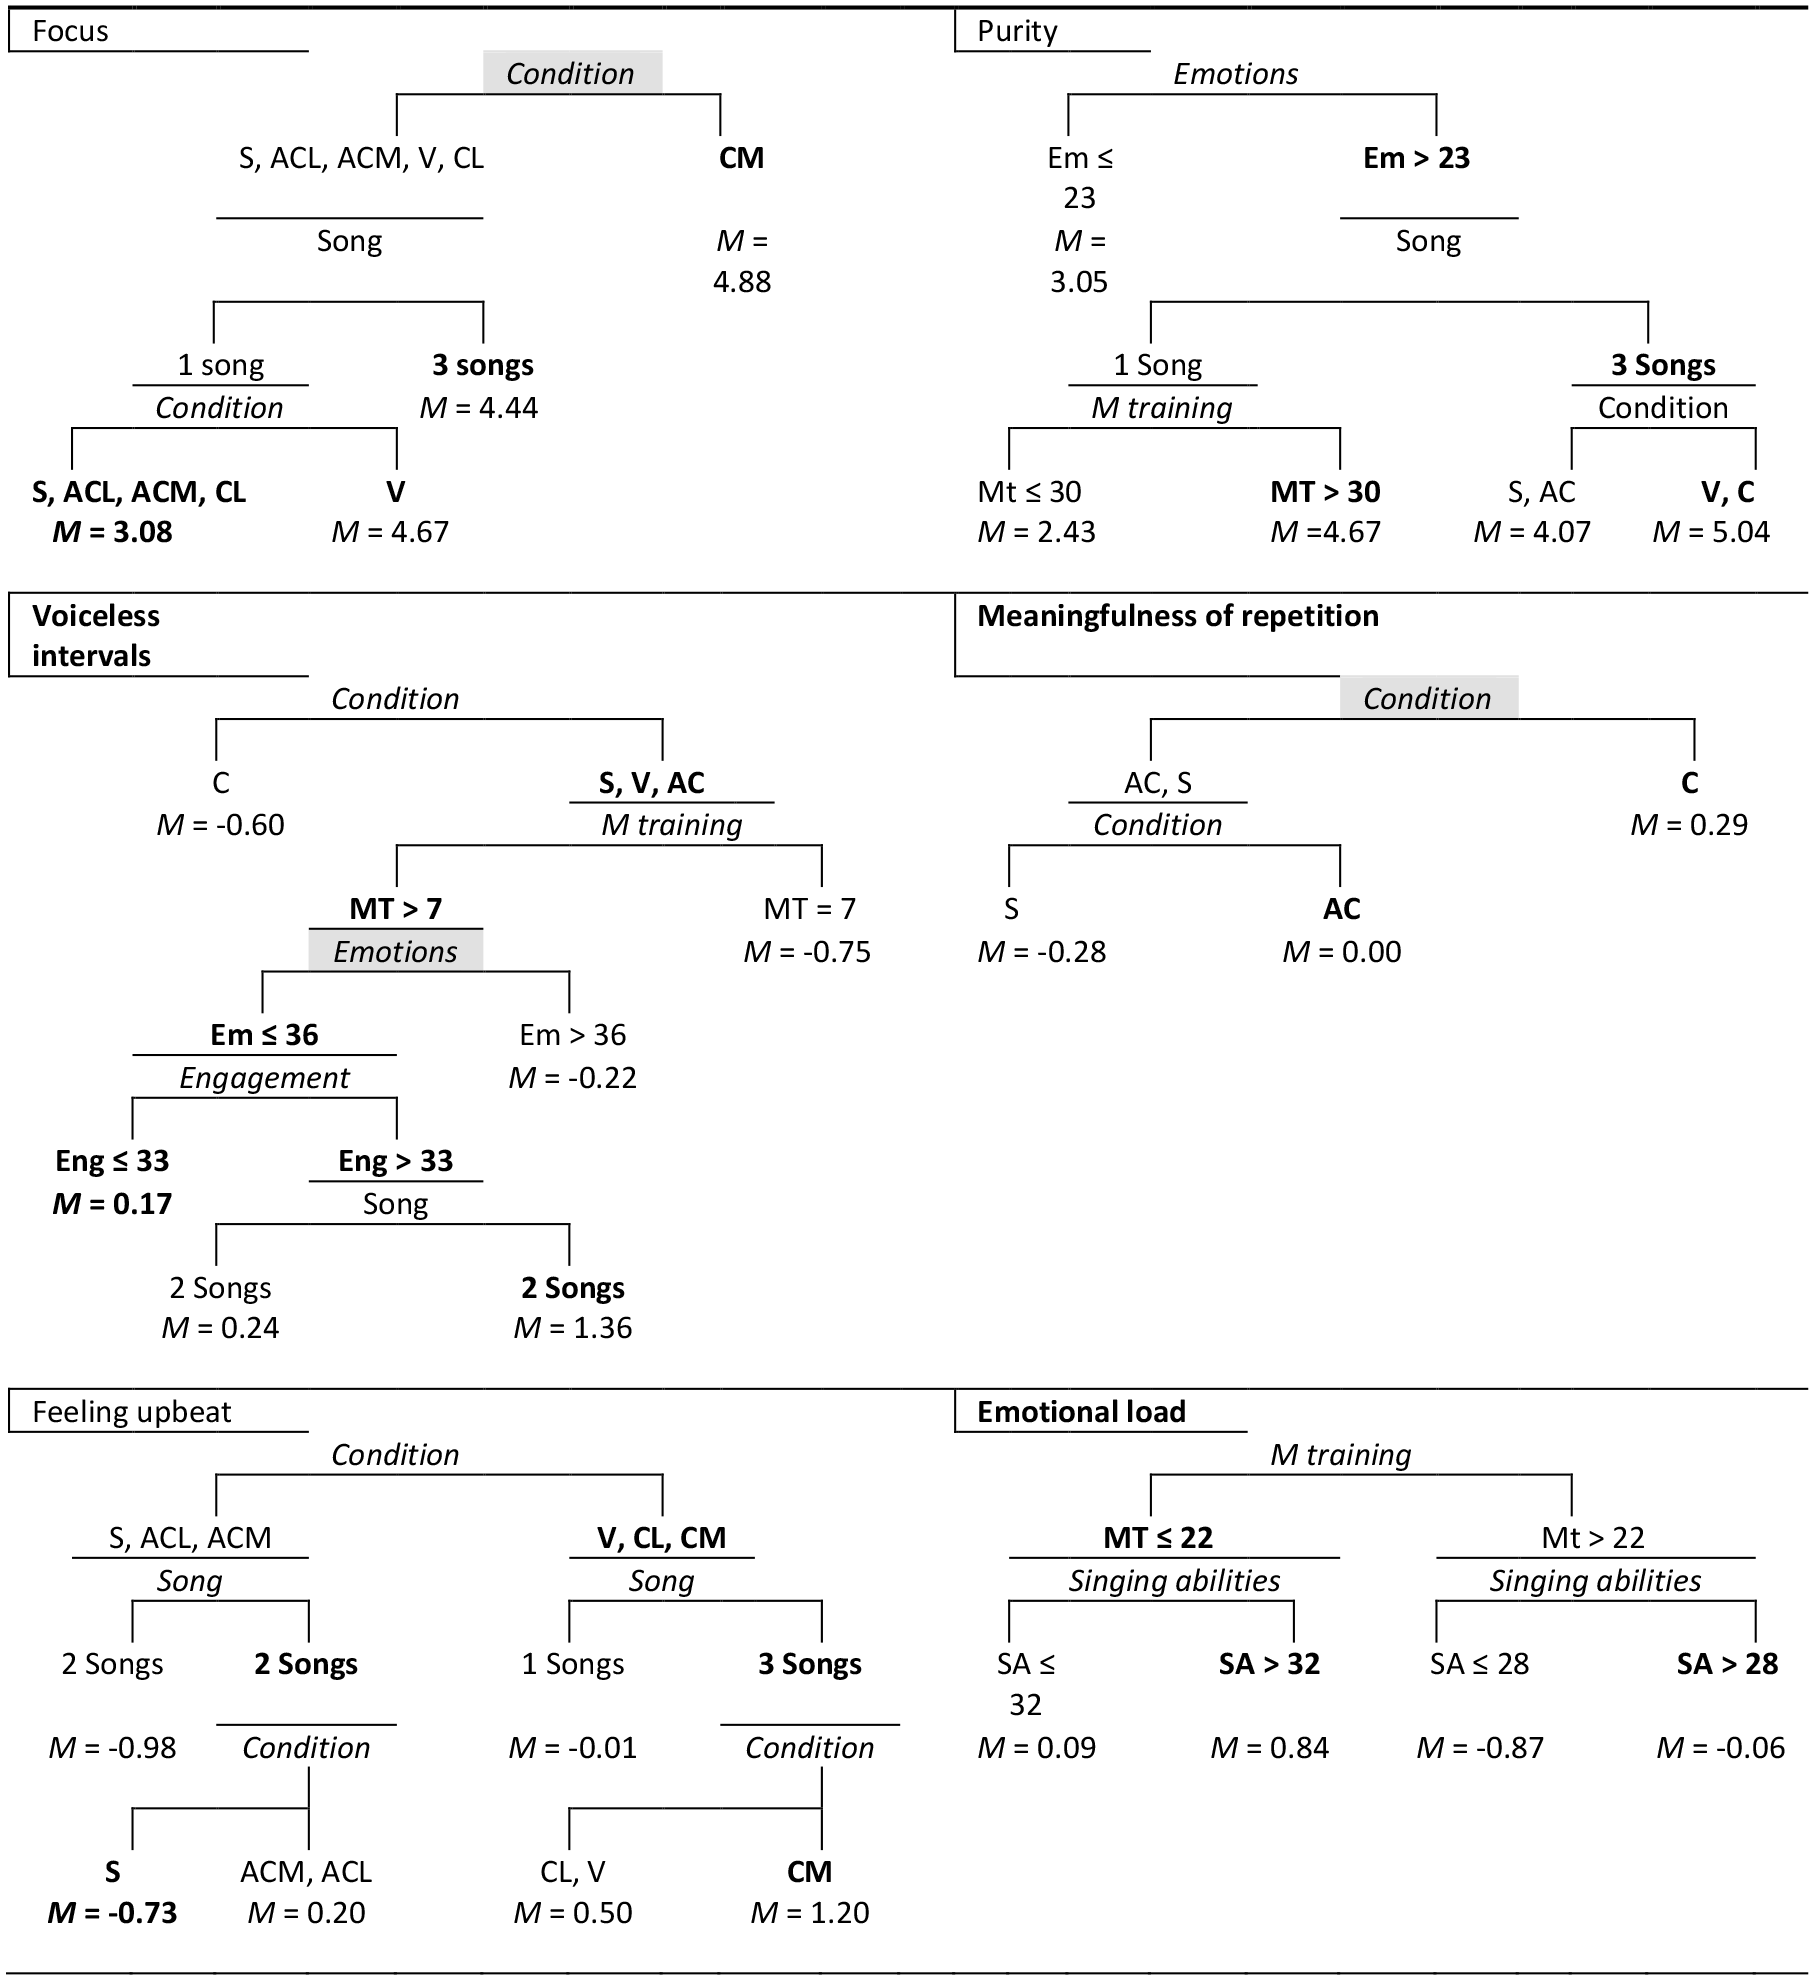
Figure 6. CART trees belonging to the regressions summarized in Table 11. Node with highest Mean after split in bold. Shaded splitters indicate the boundaries between the most predictive tree and the smallest tree within 1 SE. M training & MT = GMSI musical training; Singing & SA = GMSI singing abilities; Emotions & Em = GMSI Emotions; Engagement & Eng. = GMSI active engagement; Pr. Order = Presentation order. S = Spoken, ACL = A cappella lyrics; ACM = A cappella music; ASL = Accompanied speech lyrics; ASM = Accompanied speech music; CL = Complete lyrics; CM = Complete music; V = Vocalized song; AO = Accompaniment only.
The model predicting Feeling upbeat is almost as powerful as the corresponding model predicting Feeling downbeat in the classroom study (see Tables 7, 9 and 11), and the categories of condition show a similar, comparable significant pattern indicating that the more music there is in a song version, the more it will be rated as Feeling upbeat. Almost all pairwise comparisons were significant on a < .001 level (see Table 10). The differences between spoken and a cappella are only significant on a lower level (< .05), in this study, and the difference between complete and vocalized is no longer significant, but the difference between complete music and complete lyrics is more salient. Given the significance of most pairwise comparisons, this pattern seems to be consistent across songs. In line with that, the first split in the CART tree distinguishes between music poor and music rich song versions, after which further divisions hold for two or three songs.
Regressions with the variable condition on Emotional load also show a similar pattern in both studies, indicating that lyrics are rated as more Emotionally loaded than music, but that the Emotional load of complete versions is highest. However, in this case the model has less predictive power in the laboratory study than in the classroom study, which could be due to sample size. Another explanation could be that the pattern is not consistent across songs, just as it was not consistent across songs in the classroom study. However, as there are only six ratings per song per song version, a control investigation of the ratings per song would be inappropriate.
The GMSI subscales only showed significant effects in mixed model regressions concerning purity and Emotional load, and in three CART trees. In most cases, a higher GMSI subscale score goes hand in hand with enhanced music and lyric-processing. For example, a relatively high GMSI emotion score goes hand in hand with higher purity ratings, which is in line with earlier findings that tonal encoding and emotion expression analysis are related (Hirotani, 2010; Peretz & Coltheart, 2003). However, there are exceptions. In general, perceptual abilities support focus, but people with a moderate GMSI perceptual-abilities score experience a higher focus than people with a high GMSI perceptual abilities score, which is a puzzling result. Furthermore, people without musical training experience relatively little distraction during voiceless intervals, possibly because people without any musical training have less clear expectations of when an upcoming event is to be expected. This result seems to be contradictory to the results of the classroom study. However, an additional CART regression with no other GMSI subscale than musical training reveals that in fact there is an inverted U-shaped relationship between musical training and Voiceless intervals, which was overruled by the effect of other GMSI subscales. Finally, both CART and mixed model regressions indicate that experienced musicians in the laboratory study tend to rate Emotional load lower than less experienced musicians, whereas singers tend to do the opposite in both groups. Assuming that Emotional load is content related and positively valenced, this could indicate that musicians in general pay less attention to the lyrics, whereas singers are more focused on them. Another explanation could be that musicians somehow find emotional relief in the music, while singers are more sensitive to emotional tension in the voice.
GENERAL DISCUSSION
In two experiments, a classroom experiment among 271 pupils and a laboratory experiment among 24 adults (see also Schotanus, Eekhof, & Willems, 2018), the effect of singing and accompaniment on the processing of song lyrics was investigated. Both experiments provide evidence that both singing and accompaniment can enhance language-processing at first exposure. Study 1, in conjunction with Schotanus, Eekhof and Willems (2018), show that processing fluency and the appreciation of voice quality, song and lyrics are enhanced by an accompaniment, and, to a lesser extent, by singing. Moreover, cued recall was significantly better after hearing the lyrics of a song a cappella than after hearing them being declaimed. In addition, both Study 1 and Study 2 show that, in line with the MFH, the positive effect of an accompaniment seems to be related to the processing of voiceless intervals and harmony. Silences turn out to be more distracting than instrumental interplays and a-cappella singing was rated as less pure than accompanied singing even though the exact same voice part was used. Seemingly, this effect can be modified by the presence of lyrics, dependent on their nature. The results of the classroom experiment, along with a related study (Schotanus, 2016) seem to indicate that in some cases the catchiness of the lyrics alleviated the effect of a-cappella singing on harmony-processing. On the other hand, Study 2 suggests that, for people who do not associate 'lalala' lyrics with sillyness, drunkenness, or childishness and feel put out by having to listen to them, but instead treat them as strictly musical vocalisation, the processing of harmony and voiceless intervals is easier in such a-cappella vocalisations than in a-cappella songs. The MFH would explain these seemingly contradictory results, assuming that processing music is easier if either the music or the lyrics are interesting enough to overcome MF and stay focused. In line with that, focus was relatively low for vocalized versions in the classroom study, and relatively high in the laboratory study.
The effect of silences raises the question of whether silences are distracting because they do not provide anything to focus on, because they violate expectancies and are therefore difficult to process, or because they hamper Dynamic Attending. EEG-measures (analysed only after Schotanus, Eekhof, & Willems, 2018 was published, in Schotanus, 2020, p. 182186) suggest the latter. However, more research is required.
A related question that also calls for further investigation is why musicians find silences, seemingly even silences in speech, less distracting than non-musicians. Possibly, musicians benefit from their ability to attend to speech in noise (Alain, Zendel, Hutka, & Bidelman, 2014), or from their enhanced working memory (Featherstone, Morrison, Waterman, & MacGregor, 2014). If they are able to delay the processing of ambiguous language until a sentence is finished, they may be able to process a delayed continuation of a lyric as well.
Musical Meaning
Regressions on three factors concerning musical meaning show similar results across the two studies, indicating that both singing and accompaniment affect the perceived emotional meaning expressed by the songs and their lyrics. This implies that music can be used to enhance the comprehension of the lyrics at first exposure, as it did in this sample. In the classroom study in particular, spoken versions are taken too seriously, they are rated as sadder and less humourous than these cabaret songs are intended. Furthermore, regressions on Meaningfulness of repetitions show that music can have an immediate impact on the meaning of a word or phrase. Words which were repeated immediately after the first presentation were rated as more meaningful in versions with music than in unaccompanied spoken versions. As suggested by Gordon, Magne, and Large (2011), the fact that in most cases the melody was changed the second time may have enhanced the effect.
The ratings for Feeling upbeat or downbeat in both Study 1 and Study 2 provide further evidence that song versions with somehow predictable music (such as rhythmic tonal music) are perceived as happier and more energetic than spoken lyrics (Ali and Peynircyoǧlu, 2006; Brattico et al., 2011; Menon and Levitin, 2005). Of course, Feeling upbeat and Feeling downbeat are not the same as happy and sad, but regressions with the variable condition on the original happiness and sadness ratings show the same pattern (Schotanus, 2016a) as those on Feeling upbeat and Feeling downbeat. As these results are completely in line with earlier findings, it is very unlikely that the connections between condition and Feeling upbeat or Feeling downbeat measured in the current study are simply the result of a 'lucky' match of music and lyrics Moreover, such a 'lucky' match seems to be rather common (Tiemann & Huron, 2011). Nevertheless, a happier voice, declaiming really happy lyrics, at a higher speech rate and with a more energetic diction, may evoke more positive ratings for spoken lyrics; or a less ambiguously sad piece of music can be rated as Feeling absolutely downbeat, but such examples of really happy spoken lyrics or really sad pieces of instrumental music will be relatively hard to find.
It is remarkable that spoken versions are rated as feeling relatively upbeat in the laboratory study compared to the classroom study. Perhaps adults found the lyrics more accessible than 16-year-olds (see also Schotanus 2016), or maybe the classroom setting makes it more difficult to focus on these spoken lyrics than an EEG-lab setting with headphones.
The effects of the variable condition on Emotional-load ratings are not consistent across songs. Nevertheless, they are relatively consistent across the two studies. In this sample of songs, Emotional load seems to be larger in versions with lyrics than in versions without them, and largest in combinations of music and lyrics, particularly complete versions. However, the Emotional load ratings for several non-verbal song versions were relatively high. Still, Emotional load seems to be a content-related variable, in which a positively valued aspect of sadness, which is not related to low arousal, is combined with heaviness and emotivity. This is in line with Galizio and Hendrick (1974) and with the fact that Emotional load appears to show similarities to the factor Seriousness in Schotanus, Eekhof, and Willems (2018), in which sadness, emotivity, and heaviness are combined with strikingness of textual features. Yet, it is puzzling that the scores for Seriousness were higher in spoken versions and those for Emotional load in complete ones.
The results imply that Ali and Peynircyoǧlu's conclusions (2006) that melodies are more dominant in eliciting emotions than lyrics must be nuanced. First, whereas Feeling upbeat or downbeat seems to be largely dependent on the presence of music, humour and Emotional load seem to be dependent on the combination of lyrics and music, not on the contribution of either. Moreover, at least within this sample, lyrics are more dominant in the expression of Emotional load than music. Furthermore, it is important to distinguish between the influence of melody and that of accompaniment. The results of the current study show that the effect of melody on sadness that Ali and Peynircyoǧlu (2006) measured in all probability is not an effect of melody, but rather of melody and accompaniment together, or even of accompaniment alone. However, melody undoubtedly has an effect. As Figure 3 shows, the only song of which the a-cappella version is rated less downbeat than the complete one, JD, is the only song of which the vocalized version is rated less downbeat than the accompaniment. Nevertheless, the effect of accompaniment is far more powerful. The differences between ratings for spoken and a-cappella or vocalized versions are smaller than those between song versions with and without accompaniment, and within song versions, differences between music and lyrics are more often significant in accompanied song versions. In addition, the lyrics also have a strong effect. Both complete and accompanied-speech versions are rated as significantly less Feeling upbeat than accompaniment-only versions, and spoken and a-cappella versions are rated as significantly more feeling downbeat than vocalized-song versions. Also, within the accompanied song versions, the accompaniment was rated as Feeling significantly less downbeat than the lyrics. Of course, this may also be explained as an effect of voice compared to piano, but given the relatively high ratings for vocalized compared to a-cappella versions, the presence of lyrics must play a part as well.
A remarkable secondary finding is that the differences between the ratings for music and lyrics within the same tracks provide further evidence that music and lyrics are processed separately (Bonnel, Faita, Peretz, & Besson, 2001), and the Emotional load ratings of the classroom study show that this holds even when they are presented in one signal, as is the case in a-cappella singing. At the least, participants can differentiate between the two in retrospect.
Musical Sophistication
In both studies, variables indicating aspects of musical sophistication were used as covariates: a rough scale indicating musical training in the classroom study, and the fine-grained Gold MSI subscales in the laboratory study. Nevertheless, largely the same variables turned out to be affected by musical sophistication, namely purity, focus, Voiceless intervals, and Bad rhyming, which all seem to be related to the processing of musical features rather than linguistic ones. Furthermore, musicianship appears to be particularly beneficial when processing spoken or a-cappella song versions.
The opposing effect of singing abilities and musical training on Emotional load seems to be related to musical meaning. This raises a question about why Feeling upbeat or downbeat is not affected by musical sophistication. This may be explained by the fact that Feeling upbeat or downbeat is more arousal-related than Emotional load is. Andrade and colleagues (2017) found that musicians and non-musicians perceive arousal-based emotions as less different than valence-based emotions. Another remarkable finding is that (in line with Schotanus, 2016) aspects of musical sophistication show an inverted U-shaped relationship with several variables.
Limitations
The design of both studies may entail several confounding factors. First, the accompaniments were all played on a relatively energetic instrument (a piano) and were created to support the processing of rhythm and harmony. It is likely that a lute improvising a strictly ornamental accompaniment would be rated at least as less energetic. Another confounding factor could be the nature of the vocalized-song recording. It is neither a plain melody nor a voice singing a cappella completely without words. If the endlessly repeated syllable 'la' were replaced by a vocalization without consonants or with various nonsense syllables, the ratings might be more positive. Furthermore, in most conditions, the voice of the performer and his diction inevitably affect the emotion ratings. However, it is precisely because the voice and the interpretation of the lyrics and the melody are the same across conditions that the conditions with voice are reliably comparable. Finally, part of the data could not properly be analysed, due to design errors (see, discussion section, Study 1); consequently, the striking results for recall in the laboratory experiment could not be compared with results in the classroom experiment, and questions concerning the effect of condition on comprehension and rhyming perception remain largely unanswered .
CONCLUSIONS
The results of both a laboratory experiment among 24 adults and a classroom experiment among 271 pupils indicate that, as hypothesized, verbal material can helpfully be presented sung instead of spoken, particularly in a classroom setting, and non-musicians seem to benefit the most. Both singing and accompaniment support focus, listening comfort, positive valence, aesthetic value, and perceived intelligibility and comprehensibility. As expected, the effect of accompaniment seems related to the occurrence of out-of-key notes and on-beat silences in the melody. Furthermore, both studies provide evidence that nonverbal music conveys both emotional and semantic meaning, and that at least the emotional meaning of the music affects the meaning of the lyrics of a song. In line with earlier findings, the presence of music increases the perceived happiness in a song's lyrics. The presence of music also tends to increase the acceptability and emotional meaning of verbal repetitions. Emotional load shows a different pattern, as it is rated higher for conditions with lyrics than for conditions without them, but highest for complete versions. However, this pattern is not consistent across songs, as some non-verbal song versions were also rated as relatively Emotionally loaded.
The results also show that, in general, the effect of accompaniment on musical meaning seems to be more powerful and stable than the effect of melody, but that one cannot say that the effect of the music is greater than the effect of the lyrics.
In addition, there were some remarkable secondary findings. First, regressions on Emotional load indicate that participants are able to distinguish between music and lyrics within one a-cappella version, although others do not hear music in it at all. Second, the factor loadings for Feeling upbeat and Feeling downbeat show that induced low arousal (calming, not nagging) is positively correlated with perceived high arousal (energetic), and that sadness has both a low-valence energy-related dimension and a high-valence content-related dimension. Third, the use of the Gold MSI subscales in the laboratory study revealed that singers tend to perceive more emotional load in a song than instrumentalists.
ACKNOWLEDGEMENTS
This research is made possible by NWO and SG het Rhedens, who granted me the opportunity to avail myself of a PhD scholarship for teachers. I would like to thank my supervisors, Emile Wennekes (Universiteit Utrecht), Frank Hakemulder (Universiteit Utrecht) and Roel Willems (Radboud Universiteit Nijmegen) for their support and comments. Furthermore, I would like to thank several people who have helped me collect data: colleagues and the school board of SG het Rhedens and SSGN Nijmegen for their collaboration in the classroom experiment, Xin Gao for his help in the laboratory experiment, and the participants in both studies for taking part. I owe special thanks to Lynn Eekhof for coordinating the laboratory experiment, and for her comments on this article. This article was copyedited by Tanushree Agrawal and layout edited by Kelly Jakubowski.
NOTES
-
The current article forms the basis for Chapter 3.1 and 3.3 of Schotanus (2020). An early version of this study was presented as a conference paper at the ICMPC14 in San Francisco (Schotanus, 2016a). Furthermore, the Method-section of Study 2 partly duplicates the Method-section in Schotanus, Eekhof, & Willems (2018).
Return to Text -
Correspondence address: Yke Schotanus, schotschrift.teksten@planet.nl.
Return to Text
REFERENCES
- Alain, C., Zendel, B. R., Hutka, S., & Bidelman, G. M. (2014). Turning down the noise: The benefit of musical training on the aging auditory brain. Hearing Research, 308, 162-173. https://doi.org/10.1016/j.heares.2013.06.008
- Ali, S. O. & Peynircioǧly, Z. F. (2006). Songs and emotions: are lyrics and melodies equal partners. Psychology of music, 34(4), 511-534. https://doi.org/10.1177/0305735606067168
- Andrade, P. E., Vanzella, P., Andrade, O. V. C. A., & Schellenberg, E. G. (2017). Associating emotions with Wagner's music: A developmental perspective. Psychology of music, 45(5), 752-760. https://doi.org/10.1177/0305735616678056
- Antović, M., Stamenković, D. & Figar, V. (2016). Association of meaning in program music: On denotation, inherence and onomatopoeia. Music Perception, 34(2), 243-248. https://doi.org/10.1525/mp.2016.34.2.243
- Behrendt, M. (2017). I don't like Mondays: Die 66 gröβten Songmissverständnisse. (The 66 biggest misunderstandings of song lyrics). Darmstadt: Theiss.
- Bonnel, A.M., Faïta, F., Peretz, I., & Besson, M. (2001). Divided attention between lyrics and tunes of operatic songs: Evidence for independent processing. Perception and Psychophysics, 63: 1201-1213. https://doi.org/10.3758/BF03194534
- Bouwer, F., Schotanus, Y. P., Sadakata, M., Müllensiefen, D. & Schaefer, R. (in preparation). Measuring musical sophistication in the low countries; validation of a Gold MSI translation in Dutch.
- Brattico, E., Alluri, V., Bogert, B., Jacobsen, T., Vartiainen, N., Nieminen, S., & Tervaniemi, M. (2011). A functional MRI study of happy and sad emotions in music with and without lyrics. Frontiers in Psychology, 2, 308. https://doi.org/10.3389/fpsyg.2011.00308
- Breiman, L., Friedman, J., Stone, C.J. & Olshen, R.A. (1984). Classification And Regression Trees. Taylor & Francis.
- Brodsky, W. (2011). Developing a functional method to apply music in branding: Design language-generated music. Psychology of Music, 39(2), 261-283. https://doi.org/10.1177/0305735610387778
- Bullerjahn, C. (2009). Die Wirksamkeit von Musik in der Fenrsehwerbung. Ein Vergleich theoretischer Annäherungen und Ergebnisse empirischer Studien. In: C. Bullerjahn, & W. Löffler, Musik und Ökonomie. Finanzieren und Vermarkten von und mit Hilfe von Musik: Musikästhetisches und musikpädogogischer Haushalten, Zürich, New York: Hildesheim.
- Byrne, D. (2012). How Music Works, San Francisco: McSweeney's.
- Cespedes-Guevara, J. & Eerola, T. (2018). Music communicates affects, not basic emotions: A constructionist account of attribution of emotional meanings to music. Frontiers in Psychology, 9, 215. https://doi.org/10.3389/fpsyg.2018.00215
- Coffman, D.D., Gfeller, K. & Eckert, M. (1995). Effect of textual setting, training, and gender on emotional response to verbal and musical information. Psychomusicology: A Journal of Research in Music Cognition, 14(1-2), 117-136. https://doi.org/10.1037/h0094088
- Cohen, H. G. (2005). Music in the History Classroom. Perspectives, pp. 18-21.
- Collister, L. & Huron, D. (2008). Comparison of word intelligibility in spoken and sung phrases. Empirical Musicology Review, 3(3), 109-125. https://doi.org/10.18061/1811/34102
- Condit-Schultz, N., & Huron, D. (2015). Catching the lyrics: Intelligibility in twelve song genres. Music Perception, 32(5), 470-483. https://doi.org/10.1525/mp.2015.32.5.470
- Council of Europe (2011). Common European framework of reference to language. Structured overview of all CEFR scales. Retrieved 7 August 2017 from: http://ebcl.eu.com/wp-content/uploads/2011/11/CEFR-all-scales-and-all-skills.pdf.
- Drake, C. & Palmer, C. (1993). Accent structures in music performance. Music Perception, 10, 343-378. https://doi.org/10.2307/40285574
- Eckstein, L. (2010). Reading song lyrics, Amsterdam/New York: Rodopi. https://doi.org/10.1163/9789042030367
- Eerola, T. & North, A. C. (2000). Expectancy-based model of melodic complexity. In Woods, C., Luck, G. B., Brochard, R., O'Neill, S. A., and Sloboda, J. A. (Eds.). Proceedings of the Sixth International conference on Music Perception and Cognition. Keele, Staffordshire, UK: Department of Psychology.
- Eerola, T. & Toiviainen, P. (2004). MIDI Toolbox: MATLAB Tools for Music Research. University of Jyväskylä: Kopijyvä, Finland. Retreived from: http://musicweb.ucsd.edu/~sdubnov/CATbox/miditoolbox/MIDI_Toolbox_Manual.pdf
- Featherstone, C. R., Morrison, C. M., Waterman, M. G. & MacGregor, L. J. (2014). Musical training and semantic integration in sentence processing: Tales of the unexpected. Psychomusicology: Music, Mind and Brain 24(4), 291-297. https://doi.org/10.1037/pmu0000062
- Fonseca-Mora, C. & Gant, M. (2016). Melodies, rhythm and cognition in foreign language learning. Newcastle upon Tyne, UK: Cambridge Scholars Publishing.
- Fritz, D., Jentschke, S., Gosselin, N., Sammler, D., Peretz, I., Turner, R. & Friederici, A. D. (2009). Universal recognition of three basic emotions in music. Current Biology, 19, 573-576. https://doi.org/10.1016/j.cub.2009.02.058
- Galizio, M., & Hendrick, C. (1972). Effect of musical accompaniment on attitude: The guitar as a prop for persuasion. Journal of Applied Social Psychology, 2(4), 350-359. https://doi.org/10.1111/j.1559-1816.1972.tb01286.x
- Goering, C. Z. & Burenheide, B. J. (2010). Exploring the role of music in secondary English and history classrooms through personal practical theory. SRATE Journal, 19(2), 44-51.
- Goeth, M. (2016). Musik und Humor: Strategien, Universalien, Grenzen. (Studien und Materialien zur Musikwissenschaft). Hildesheim/Zürich: Georg Olms AG.
- Good, A. J., Russo, F. A. & Sullivan, J. (2015). The efficacy of singing in foreign-language learning. Psychology of Music, 43(5), 627-640. https://doi.org/10.1177/0305735614528833
- Gordon, R. L., Magne, C. L., & Large, E. W. (2011). EEG correlates of song prosody: a new look at the relationship between linguistic and musical rhythm. Frontiers in Psychology, 2, 352. https://doi.org/10.3389/fpsyg.2011.00352
- HaCohen, R. & Wagner, N. (1997). The communicative force of Wagner's Leitmotifs: Complementary relationships between their connotations and denotations. Music Perception, 14, 445-476. https://doi.org/10.2307/40285733
- Hakemulder, J.F. (2004). Foregrounding and its effect on readers' perception. Discourse Processes, 38(2), 193-218. https://doi.org/10.1207/s15326950dp3802_3
- Hansen, N. C. (2018). A call for hypothesis-driven, multi-level analysis in research on emotional word painting in music: commentary on Sun & Cuthbert (2018). Empirical Musicology Review, 13(3–4). https://doi.org/10.18061/emr.v13i3-4.6771
- Hansen, C. & Hansen, R.D. (1991). Schematic information processing of heavy metal lyrics. Communication Research, 18(3), 373-411. https://doi.org/10.1177/009365091018003005
- Hanslick, E. (1854/2008). Vom Musikalischen Schönen (On the musically beautiful). Leipzig. Published as Ebook by Project Gutenberg-tm, Ebook #26949. Retrieved, Februari 27th 2018, from: http://www.gutenberg.org/ebooks/26949
- Hirotani, M. (2010). Use of pitch for processing emotions. Canadian acoustics, 38(3), 110-111.
- Huovinen, E. & Kaila, A.-K.(2015). The semantics of musical topoi: An empirical approach. Music Perception, 33(2), 217–243. https://doi.org/10.1525/mp.2015.33.2.217
- Huron, D. (2004).. Music-engendered laughter: an analysis of humor devices in PDQ Bach. In: S.D Lipscomb, R. Ashley, R.O. Gjerdingen & P. Webster (EDs.) Proceedings of the 8th International Conference on Music Perception & Cognition, Evanston, IL.
- Huron, D. (2006). Sweet Anticipation. Cambridge, MA: MIT Press. https://doi.org/10.7551/mitpress/6575.001.0001
- Huron, D. (2013). A psychological approach to musical form: The habituation–fluency theory of repetition. Current Musicology, 96, 7-35. https://doi.org/10.7916/D8KP81FG
- Huron, D. (2016). Voice leading: The science behind a musical art. Cambridge, MA: MIT Press. https://doi.org/10.7551/mitpress/9780262034852.001.0001
- Jaeger, A. & Wiley, J. (2015) Reading an analogy can cause the illusion of comprehension. Discourse Processes, 52, 376-405. https://doi.org/10.1080/0163853X.2015.1026679
- Jesse, A. & Massaro, D. W. (2010) Seeing a singer helps comprehension of the song's lyrics, Psychonomic Bulletin & Review, 17(3), 323-328. https://doi.org/10.3758/PBR.17.3.323
- Johnson, R., Huron, D. & Collister, L. (2014). Music and lyrics interactions and their influence on recognition of sung words: An investigation of word frequency, rhyme, metric stress, vocal timbre, melisma, and repetition priming, Empirical Musicology Review, 9(1), 2-20. https://doi.org/10.18061/emr.v9i1.3729
- Jones, M.R. (1976). Time, our lost dimension: Toward a new theory of perception, attention and memory. Psychological Review, 83, 323-335. https://doi.org/10.1037/0033-295X.83.5.323
- Juslin, P.N. (2013). What does music express? Basic emotions and beyond. Frontiers in Psychology, 4, 596. https://doi.org/10.3389/fpsyg.2013.00596
- Juslin, P.N. & Laukka, P. (2003). Communication of emotions in vocal expression and music performance: different channels, same code? Psychological Bulletin, 129(5), 770-814. https://doi.org/10.1037/0033-2909.129.5.770
- Kilgour A. R., Jakobson, L. S. & Cuddy, L. L. (2000). Music training and rate of presentation as mediators of text and song recall. Memory and Cognition, 28, 700-710. https://doi.org/10.3758/BF03198404
- Kim, J. N. (2013). Online Processing of Tonal Melodies: Effects of Harmonic Expectations, dissertation. Evanston: Author.
- Kivy, P. (2002). Introduction to a philosophy of music. Oxford: Clarendon Press.
- Koelsch, S., (2011). Toward a neural basis of processing musical semantics. Physics of Life Reviews, 8(2), 89-105. https://doi.org/10.1016/j.plrev.2011.04.004
- Koelsch, S., Kasper, E., Sammler, D., Schulze, K., Gunter, T., Friederici, A.D. (2004). Music, language and meaning: Brain signatures of semantic processing. Nature Neuroscience, 7(3): 302-307. https://doi.org/10.1038/nn1197
- Kramer, L. (2002). Musical meaning: Toward a critical history. Berkeley: University of California Press. https://doi.org/10.1525/9780520928329
- Ladinig, O., Honing, H. J., Hááden G. & Winkler I. (2009). Probing attentive and pre-attentive emergent meter in adults and adult listeners without extensive music training'. Music Perception, 26(4), 377-386. https://doi.org/10.1525/mp.2009.26.4.377
- Lai, V. T., Willems, R. L. & Hagoort, P (2015). Feel between the lines: Implied emotion in sentence comprehension. Journal of Cognitive Neuroscience, 27(8), 1528-1541. https://doi.org/10.1162/jocn_a_00798
- Large, E.W. & Jones, M.R. (1999). The dynamics of attending: how people track time varying events. Psychological Review, 106, 119–159. https://doi.org/10.1037/0033-295X.106.1.119
- Ludke, K. M., Ferreira, F. & Overy, K. (2014). Singing can facilitate foreign language learning. Memory and Cognition, 42, 41–52. https://doi.org/10.3758/s13421-013-0342-5
- MacGregor, L.J.: Corley, M.; Donaldson, D. (2010). Listening to the sound of silence: disfluent silent pauses in speech have consequences for listeners. Neuropsychologia, 48(14) 3982-3992. https://doi.org/10.1016/j.neuropsychologia.2010.09.024
- Manin, D. Y. (2012). The right word in the left place: Measuring lexical foregrounding in poetry and prose. Scientific Study of Literature, 2(2), pp. 273−300. https://doi.org/10.1075/ssol.2.2.05man
- Margulis, E. H. (2014). On repeat: How Music Plays the Mind. New York, Oxford University Press. https://doi.org/10.1093/acprof:oso/9780199990825.001.0001
- Margulis, E. H. (2016). Narrative experiences of instrumental pop music. In: Proceedings of the 14th International Conference on Music Perception & Cognition (ICMPC14), July 2016, San Francisco. Zanto, T.P. (Ed.). Adelaide: Causal Productions, p. 26.
- Margulis, E. H. (2017). An exploratory study of narrative experiences of music. Music Perception, 35(2), 235-248. https://doi.org/10.1525/mp.2017.35.2.235
- Margulis, E. H., Levine, W. H., Simchy-Gross, R., & Kroger, C. (2017). Expressive intent, ambiguity, and aesthetic experiences of music and poetry. PLoS ONE, 12(7). Article ID e0179145. https://doi.org/10.1371/journal.pone.0179145
- Medina, S. L. (1994). The impact of rhythm upon verbal memory, http://www.scribd.com/doc/48547756/The-Impact-of-Rhythm-Upon-Verbal-Memory#scribd
- Menninghaus, W., Bohrn, I. C., Knoop, C. A., Kotz, S.A., Schlotz, W. & Jacobs, A. M. (2015). Rhetorical features facilitate prosodic processing while handicapping ease of semantic comprehension. Cognition, 143, 48-60. https://doi.org/10.1016/j.cognition.2015.05.026
- Menon, V. & Levitin, D. (2005). The rewards of music listening: Response and physiological connectivity of the mesolimbic system. NeuroImage, 28, 175-184. https://doi.org/10.1016/j.neuroimage.2005.05.053
- Miall, D. & Kuiken, D. (1994). Foregrounding, defamiliarization, and affect response to literary stories. Poetics, 22, 389-407. https://doi.org/10.1016/0304-422X(94)00011-5
- Moussard, A., Bigand, E., Belleville, S. & Peretz, I. (2014). Learning sung lyrics aids retention in normal ageing and Alzheimer's disease. Neuropsychological Rehabilitation, 24, 894-917. https://doi.org/10.1080/09602011.2014.917982
- Msila, V. (2013). Reliving South African apartheid History in a classroom: Using Vuyisile Mini's protest songs. Creative Education, 4(12B). https://doi.org/10.4236/ce.2013.412A2008
- Müllensiefen, D., Gingras, B., Stewart, L. & Musil, J. (2014). The musicality of non-musicians: An index for measuring musical sophistication in the general population. PLoS ONE 9(2): e89642. https://doi.org/10.1371/journal.pone.0089642
- Noble, J. & McAdams (2018). Meaning beyond content: extra musical associations are plural but not arbitrary. In Parncutt, R. & Sattmann, S. (Eds). Proceedings of ICMPC15/ESCOM10. Graz, Austria: Centre for Systematic Musicology, University of Graz. 389-394.
- Patel, A.D. (2011). Why would musical training benefit the neural encoding of speech? The OPERA hypothesis. Frontiers in Psychology, 2:142. https://doi.org/10.3389/fpsyg.2011.00142
- Patel, A.D. (2014). Can nonlinguistic musical training change the way the brain processes speech? The expanded OPERA hypothesis. Hearing Research 308, 98-108. https://doi.org/10.1016/j.heares.2013.08.011
- Peretz, I., Gagnon, L. & Bouchard, B. (1998). Music and emotion: perceptual determinants, immediacy, and isolation after brain damage. Cognition, 68, 111-141. https://doi.org/10.1016/S0010-0277(98)00043-2
- Peretz, I. & Coltheart, M. (2003). Modularity of music processing. Nature Neuroscience, 6(7), 688-691. https://doi.org/10.1038/nn1083
- Poulin-Charronnat, B., Bigand, E., Madurell F. & Peereman, R. (2005). Musical structure modulates semantic priming in vocal music. Cognition, 94(3), 67-78. https://doi.org/10.1016/j.cognition.2004.05.003
- Proverbio, A.M., Manfrin, L., Arcari, L.A., De Benedetto, F., Gazzola, M., Guardamagna, M., Lozano Nasi, V., Zani, A. (2015). Non-expert listeners show decreased heart rate and increased blood pressure (fear bradycardia) in respons to atonal music. Frontiers in Psychology, 6, 1646. https://doi.org/10.3389/fpsyg.2015.01646
- Russell, J.A., Ward, L.M. and Pratt, G. (1981). Affective quality attributed to environments: A factor analytic study. Environment and Behaviour, 13, 259-288. https://doi.org/10.1177/0013916581133001
- Schotanus, Y. P. (2015). The musical foregrounding hypothesis: How music influences the perception of sung language, Ginsborg, J., Lamont, A., Philips, M. & Bramley, S. (Editors) Proceedings of the Ninth Triennial Conference of the European Society for the Cognitive Sciences of Music, 17-22 August 2015, Manchester, UK.
- Schotanus, Y.P. (2016). Well Tempered Tuning Cannot Account for Low Purity Ratings of Isolated Voice Parts, In: Zanto, T.P. (Ed.), Proceedings of the 14th International Conference on Music Perception & Cognition (ICMPC14), July 2016, San Francisco. Adelaide: Causal Productions, pp. 762-766.
- Schotanus, Y.P. (2016a). Music supports the processing of song lyrics and changes their contents: Effects of melody, silences and accompaniment (Abstract), In: Zanto, T.P. (Ed.). Proceedings of the 14th International Conference on Music Perception & Cognition (ICMPC14), July 2016, San Francisco. Adelaide: Causal Productions, p. 361. (Full text available on Researchegate and AcademiaEdu, and in Schotanus, 2017).
- Schotanus, Y.P. (2017). Supplemental materials for publications concerning three experiments with four songs, hdl:10411/BZOEEA, DataverseNL Dataverse, V1.
- Schotanus, Y.P. (2020). Singing as a figure of speech, music as punctuation: A study into music as a means to support the processing of sung language. Doctoral dissertation. Utrecht University.
- Schotanus, Y. P., Eekhof, L. S., & Willems, R. M. (2018). Behavioral and neurophysiological effects of singing and accompaniment on the perception and cognition of song. In Parncutt, R. & Sattmann, S. (Eds). Proceedings of ICMPC15/ESCOM10. Graz, Austria: Centre for Systematic Musicology, University of Graz. 389-394.
- Schubert, E. (2013). Emotion felt by the listener and expressed by the music: literature review and theoretical perspectives. Frontiers in Psychology, 4, 837. https://doi.org/10.3389/fpsyg.2013.00837
- Schwartzberg, E. T. & Silverman, M. J. (2012). Effects of pitch, rhythm, and accompaniment on short- and long-term visual recall in children with autism spectrum disorders. The Arts in Psychotherapy, 39(4): 314–320. https://doi.org/10.1016/j.aip.2012.05.001
- Shen, Y. (2007). Foregrounding in poetic discourse, between deviation and cognitive constraints. Language and literature 16; 169. https://doi.org/10.1177/0963947007075983
- Silverman, M. J. & Schwartzberg, E. T. (2014). Effects of voice timbre and accompaniment on working memory as measured by sequential monosyllabic digit recall performance. Journal of Music Therapy, 51(2): 171-185. https://doi.org/10.1093/jmt/thu009
- Simonton, D. K. (1984). Melodic structure and note transition probabilities: A content analysis of 15,618 classical themes. Psychology of Music, 12(1), 3-16. https://doi.org/10.1177/0305735684121001
- Sitomer, A. (2008). Yo, Hip-Hop got roots. The ALAN Review, 35(2), 23-25. https://doi.org/10.21061/alan.v35i2.a.3
- Sousou, S.D. (1997). Effects of melody and lyrics on mood and memory. Perceptual and Motor Skills, 85, 31-40. https://doi.org/10.2466/pms.1997.85.1.31
- Sridharan, J., Levitin, D. .J., Chafe, C.H., Berger, J., & Menon, V. (2007). Neural dynamics of event segmentation in music: Converging evidence for dissociable ventral and dorsal networks, in: Neuron, 55, 521-532. https://doi.org/10.1016/j.neuron.2007.07.003
- Stichting Accessibility. (2014). Accessibility leesniveau toetstool. Retrieved in July 2017, from: https://www.accessibility.nl/kennisbank/tools/leesniveau-tool.
- Straehley, I. C. & Loebach, J.L. (2014). The influence of mode and musical experience on the attribution of emotions to melodic sequences. Psychomusicology: Music, Mind and Brain. 24(1), 21-34. https://doi.org/10.1037/pmu0000032
- Stratton, V.N. & Zalanowski, A. H. (1994). Affective impact of music versus lyrics. Empirical Studies of the Arts, 12(2), 173-184. https://doi.org/10.2190/35T0-U4DT-N09Q-LQHW
- Strobl, C., Malley, J., & Tutz, G. (2009). An introduction to recursive partitioning: rationale, application, and characteristics of classification and regression trees, bagging, and random forests. Psychological methods, 14(4), 323–348. https://doi.org/10.1037/a0016973
- Sun, S. H. & Cuthbert, M. S. (2017). Emotion, painting: Lyric, affect, and musical relationships in a large lead-sheet corpus. Empirical Musicology Review, 12(3-4), 327-348. https://doi.org/10.18061/emr.v12i3-4.5889
- Swaminathan, S. & Schellenberg, E.G. (2015). Current emotion research in music psychology. Emotion Review, 7(2), 189-197. https://doi.org/10.1177/1754073914558282
- Thompson, W. F., Schellenberg, E.G., & Husain, G. (2001). Arousal, mood and the Mozart effect. Psychological Science, 12, 248-251. https://doi.org/10.1111/1467-9280.00345
- Tiemann, L & Huron, D. (2011). Beyond happiness and sadness: Affective associations of lyrics with modality and dynamics. Empirical Musicology Review, 6(3), 147-154. https://doi.org/10.18061/1811/52809
- Van den Tol, A. J. M., & Edwards, J. (2014). Listening to sad music in adverse situations: How music selection strategies relate to self-regulatory goals, listening effects, and mood enhancement. Psychology of music. 43(4), 473-494. https://doi.org/10.1177/0305735613517410
- Velleman, E. M., & Geest, T. van der, (2014). Online test tool to determine the CEFR reading comprehension level of text. Procedia Computer Science, 27, 350-358. https://doi.org/10.1016/j.procs.2014.02.039
- Winkler, I., Háden, G., Ladinig, O., Sziller, I., & Honing, H. (2009). Newborn infants detect the beat in music. Proceedings of the National Academy of Sciences, 106, 2468-2471. https://doi.org/10.1073/pnas.0809035106
- Wolfe, D. E., & Noguchi, L. K. (2009). The use of music with young children to improve sustained attention during a vigilance task in the presence of auditory distractions. Journal of Music Therapy, 46(1), 69-82. https://doi.org/10.1093/jmt/46.1.69
- Ziv, N. (2017). Reactions to "patriotic" and "protest" songs in individuals differing in political orientation. Psychology of Music, 46(3), 392-410. https://doi.org/10.1177/0305735617713119
APPENDIX
A. Stimulus complexity
As Table A.1 shows, the complexity of all songs was relatively high according to Simonton's (1984, see also Eerola & Toiviainen, 2004) index of melodic originality. Conversely, according to Eerola and North's (2000) Expectancy-based model of melodic complexity, the complexity of the songs was comparable to or lower than the average song in the Essen folksong collection, and the simplest songs were the most complex ones according to Simonton's measure. However, Eerola and North's measure is known to be less accurate for genres such as pop songs (Eerola & Toiviainen, 2004). Moreover, in a separate online survey, 42 participants aged between 24 and 66, recruited via Amazon Mechanical Turk (M 36.6; SD 10.5; 48.7 % male) rated the complexity of the two 'relatively simple' melodies consistently more complex than the other ones in both the vocalized and the accompaniment-only version. A regression on the complexity ratings with song, song version and song*song version did not show a significant effect (p = .066), although pairwise comparisons with Bonferroni correction did show some significant differences.
| Song | Online survey Accompaniment | Vocalized | Complete | Simonton Midi melodya | Eerola & North Midi melodya |
|---|---|---|---|---|---|
| LY | 4.44 (0.23) | 4.64 (0.23) | 8.7163 | 3.7501 | |
| KT | 4.12 (0.31) | 4.19 (0.23) | 8.0878 | 5.2175 | |
| JD | 4.77 (0.31) | 4.83 (0.23)* | 4.88 (0.32) | 8.5446 | 3.6234 |
| WS | 4.57 (0.20) | 4.21 (0.23) | 8.0181 | 4.8103 |
LY = 'Maar ik hou van jou' (But I Love You), KT = 'Hou'en zo' (Keep it Like That); JD = 'Lekker depressief' (Jolly Depressed); WS = 'Wat past' (What Suits).
Online survey: Mean rating (SD), seven-point scale; Simonton: ten-point scale; Eerola & North: complexity related to the Mean complexity score Essen folk collection (5), one scale-point is one standard deviation.
* Pairwise comparisons with Bonferroni correction reveal: JD vocalized is significantly different from KT accompanied and vocalized, and from 4 vocalized (p between .033 and .048).
a Midi files based on the lead sheets (see Schotanus, 2017), so repeated song sections are included once only.
B. Means and SDs for categories of condition for the variables in Study 1 and Study 2
| Focus M (SD) | Purity M (SD) | List. Comf. M (SD) | Voicelss I. M (SD) | Voice q. M (SD) | Lyric q. M (SD) | |
|---|---|---|---|---|---|---|
| S | 2.68 (1.27) | -0.29 (0.97) | 0.22 (1.06) | -0.27 (0.93) | -0.03 (1.03) | |
| AS | 3.06 (1.27) | 0.01 (0.95) | -0.23 (0.83) | 0.21 (0.95) | ||
| AC | 2.82 (1.23) | 3.00 (1,1) | -0.19 (0.91) | 0.15 (1.13) | -0.01 (0.92) | -0.05 (1.02) |
| C | 3.00 (1.15) | 3.30 (1.1) | 0.43 (0.93) | -0.25 (0.79) | 0.39 (0.97) | 0.11 (0.96) |
| V | 2.57 (1.26) | 2.96 (1.15) | -0.20 (1.00) | 0.02 (1.08) | -0.01 (1.12) | |
| AO | 3.51 (0.98) | 0.63 (0.86) | -0.14 (0.74) | -0.07 (0.98) | ||
| Clearness | Bad rhym. | M. rep. | Feeling up. | Em. load | ||
| S | -0.11 (1.08) | 0.14 (1.04) | -0.36 (1.08) | 0.81 (0.64) | 0.05 (1.10) | |
| AC(L) | 0.10 (0.96) | 0.05 (1.02) | 0.09 (0.91) | 0.23 (0.88) | 0.12 (1.02) | |
| ACM | 0.20 (0.91) | 0.00 (1.00) | ||||
| C(L) | 0.11 (0.86) | -0.17 (098) | 0.35 (0.89) | -0.22 (1.00) | 0.17 (0.90) | |
| C | -0.40 (1.03) | 0.09 (0.89) | ||||
| AS(L) | -0.22 (1.14) | -0.10 (0.83) | -0.18 (1.01) | -0.03 (0.91) | -0.08 (0.97) | |
| ASM | -0.43 (0.96) | -0.08 (0.89) | ||||
| V | -0.12 (0.94) | -0.26 (1.10) | ||||
| AO | -0.59 (0.94) | -0.14 (0.91) |
AC = a cappella, AO = accompaniment only, AS = Accompanied speech, C = complete, S = Spoken, V = Vocalized, M = music, L = lyrics.
| Purity | Focus | M. rep. | Voiceless int. | Feeling upbeat | Emotional load | ||||||
|---|---|---|---|---|---|---|---|---|---|---|---|
| M (SD) | M (SD) | M (SD) | M (SD) | M (SD) | M (SD) | ||||||
| S | 3.96 (1.55) | -0.28 (1.11) | 0.16 (1.07) | -0.82 (0.61) | 0.21 (0.89) | ||||||
| AC/ACL | 3.54 (1.18) | 4.29 | 1.49 | 0.00 | 0.87 | 0.32 | 1.05 | -0.46 | 0.79 | -0.04 | 1.06 |
| C/CL | 4.33 (1.46) | 4.88 | 1.23 | 0.29 | 0.97 | -0.60 | 0.73 | 0.33 | 0.87 | 0.35 | 0.84 |
| V | 4.08 (1.18) | 4.46 | 1.50 | 0.12 | 0.91 | 0.31 | 0.86 | -0.41 | 1.17 | ||
| ACM | -0.35 | 0.85 | -0.14 | 0.97 | |||||||
| CM | 0.99 | 0.85 | 0.02 | 0.95 | |||||||
M. Rep. = Meaningfulness of repetition, Voiceless int. = Voiceless intervals, AC = a cappella, AO = accompaniment only, AS = Accompanied speech, C = complete, S = Spoken, V = Vocalized, M = music, L = lyrics.
| S M (SD) | V M (SD) | AO M (SD) | CM M (SD) | CL M (SD) | ACM M (SD) | ACL M (SD) | ASM M (SD) | ASL M (SD) | |
|---|---|---|---|---|---|---|---|---|---|
| FU | |||||||||
| LY | 0.90 (0.54) | -0.14 (0.89) | -1.09 (0.75) | -1.03 (0.69) | -0.85 (0.61) | -0.07 (0.84) | 0.09 (0.79) | -1.13 (0.65) | -0.64 (0.82 |
| KT | 0.81 (0.64) | 0.49 (0.75) | -0.30 (0.83) | 0.34 (0.69) | 0.47 (0.67) | 0.88 (0.55) | 0.88 (0.69) | -0.11 (0.88) | 0.54 (0.67) |
| JD | 1.07 (0.48) | -0.53 (0.91) | 0.16 (0.78) | 0.15 (1.04) | 0.49 (0.79) | 0.25 (0.86) | 0.32 (0.70) | 0.55 (0.70) | 0.62 (0.60) |
| WS | 0.55 (0.73) | -0.67 (0.75) | -1.46 (0.48) | -1.12 (0.62) | -1.00 (0.72) | -0.53 (0.78) | -0.57 (0.84) | -0.46 (0.73) | -0.16 (0.78) |
| EL | |||||||||
| LY | -0.43(1.08) | -0.55 (1.16) | -1.07 (0.65) | -0.25 (0.74) | -0.11 (0 | -0.09 (0.90) | -0.01 (1.11) | -0.51 (0.84) | -0.50 (0.87) |
| KT | 0.39 (0.99) | 0.21 (0.97) | 0.16 (0.79) | 0.43 (0.88) | 0.40 (0.83) | 0.04 (0.95) | 0.01 (1.01) | 0.17 (0.79) | 0.05 (0.81) |
| JD | 0.50 (0.88) | -0.37 (1.18) | 0.29 (0.86) | 0.29 (1.04) | 0.25 (0.99) | 0.40 (1.04) | 0.62 (0.87) | 0.42 (0.83) | 0.44 (0.92) |
| WS | -0.37(1.12) | -0.44 (0.88) | -0.23 (0.74) | -0.15 (0.65) | 0.12 (0.99) | -0.46 (0.94) | -0.17 (0.90) | -0.09(0.85) | 0.09 (1.11) |
Fu = Feeling upbeat; EL = Emotional load; AC = a cappella, AO = accompaniment only, AS = Accompanied speech, C = complete, S = Spoken, V = Vocalized, M = music, L = lyrics.
C. Estimates for random intercepts in mixed model regressions in both Study 1 and Study 2.
| Focus Estimate | List. comf. Estimate | V. int. Estimate | Voice q. Estimate | Purity Estimate | Lyric q. Estimate | |
|---|---|---|---|---|---|---|
| Residual | 0.83*** | 0.45*** | 0.69*** | 0.45*** | 0.46*** | 0.44*** |
| Part.*group | 0.41*** | 0.26*** | 0.24*** | 0.37*** | 0.58*** | 0.44*** |
| Group | 0.00 | 0.11+ | 0.00 | 0.00 | 0.06 | 0.04 |
| Song | 0.00 | 0.03 | 0.00 | 0.00 | 0.00 | 0.01 |
| Clearness Estimate | Bad rh. Estimate | M. rep. Estimate | F. downb. Estimate | Em. load Estimate | ||
| Residual | 0.54*** | 0.57*** | 0.63*** | 0.49*** | ||
| Part.*group | 0.34*** | 0.28*** | 0.19*** | 0.10*** | ||
| Group | 0.06 | 0.01 | 0.06 | 0.03 | ||
| Song | 0.01 | 0.10 | 0.02 | 0.19 |
Part.*group = Participant*group; List. comf = Listening comfort; V.Int. = Voiceless intervals; Voice q. = Voice quality; Lyric q. = Lyric quality; Bad rh. = Bad rhyming; M. rep. = Meaningfulness of repetition; F. downb. = Feeling downbeat; Em. load = Emotional load.
*** = p < .001
| Focus Estimate | Purity Estimate | V. Int. Estimate | M. Rep Estimate | F. Upb. Estimate | Em. load Estimate | |
|---|---|---|---|---|---|---|
| Residual | 1.08*** | 1.03*** | 0.51*** | 0.79*** | 0.39*** | 0.58*** |
| Participant | 0.92** | 0.00 | 0.36* | 0.13 | 0.11* | 0.16* |
| Song | 0.02 | 0.20 | 0.00 | 0.02 | 0.13 | 0.00 |
V. int. = Voiceless intervals; M. rep. = Meaningfulness of repetition; F. upb. = Feeling upbeat; Em. load = Emotional load.
*** = p < .001; ** = p < .01 ; * = p < .05
D. Song-specific descriptive statistics purity.
| All songs Mean/SD | LY Mean (SD/N) | KT Mean (SD/N) | JD Mean (SD/N) | WS Mean (SD/N) | |
|---|---|---|---|---|---|
| Vocalized song | 2.957 (1,14) | 2.52 (1.27/72) | 3.35 ( .98/72) | 2.69 (1.15/46) | 3.02 ( .78/45) |
| A cappella | 3.004 (1.10) | 3.39 ( .94/63) | 2.63 (1.31/60) | 3.31 ( .94/58) | 2.53 ( .87/45) |
| Complete | 3.301 (1.00) | 3.13 ( .86/43) | 3.24 (1.03/49) | 3.20 (1.02/60) | 3.56 (1.01/62) |
