
EXTRA-MUSICAL aspects of music contribute to the perception of emotion in music (Juslin & Västfjäll, 2008). One such aspect is emotional stereotyping of music genres (Susino & Schubert, 2017). Stereotyping refers to a socially-constructed, spontaneous, generalized reaction to a stimulus, and can be applied to emotional associations, such as "all hip-hop music expresses negative emotion". Little is known about the cognitive processing of emotion stereotyping of music, and the present research aims to move knowledge forward on this matter.
The Stereotype Theory of Emotion in Music (STEM, Susino & Schubert, 2017) proposes that listeners can perceive emotion in music based on stereotyped associations held by the listener about the culture in which the music is thought to emanate (i.e., the culture representative of a particular music genre, such as Brazilian culture encoded in bossa-nova music). A listener who has a stereotyped association through the encoding culture of the music will filter out the otherwise intended emotion by the composer or performer and instead identify the music as expressing the stereotyped emotion. Caliente (hot, sexually aroused) is a common stereotype associated with Cuban culture (Simoni, 2013) and therefore some listeners will relate Cuban music genres, such as bolero, with sex, sensuality, and love, even if the music is intended to express different emotions. The theory builds on ideas concerned with cognitive fluency and ease of processing, where, in the absence of detailed knowledge about a domain, a simplified (stereotyped) processing strategy will be employed (e.g., Reber, Schwarz, & Winkielman, 2004; Undorf & Erdfelder, 2015).
In a recent study, Susino and Schubert (2018) asked participants to listen to music samples from eight distinct music genres (fado, koto, heavy metal, hip hop, pop, samba, bolero and Western classical) and report their spontaneous associations with the music. In another phase of the experiment, the same listeners were asked to report spontaneous associations with cultures assumed to be related with these genres (Portuguese, Japanese, heavy-metal, hip-hop, pop, Brazilian, Cuban and Western cultures). Corresponding emotion words were observed between music genres and their representative cultures, lending support to STEM, and suggesting that emotion in music may be determined not just by the music's psychophysical cues and the listener's individual experiences, but also by specific stereotyped cultural cues. Moreover, listeners less familiar with a music genre reported more stereotypical emotional responses in comparison to participants who were highly familiar with the given genre. This is another finding predicted by STEM. That is, listeners with limited fandom or expertise in a music genre will more likely apply a stereotyped emotion.
STEM may be seen as an extension of the Cue-Redundancy Model (Balkwill & Thompson, 1999), which proposes that emotion perception in music is informed by psychophysical and culture-specific cues. STEM further develops the cue-redundancy model because aspects of the cultural cues for emotion can now be specifically proposed in terms of stereotyping. STEM also falls under the umbrella of Juslin's (2013) Evaluative Conditioning mechanism of emotion in music, by providing a specific instance of such conditioning as being a stereotyped emotion. While STEM holds promise for better understanding sociocultural influences of music on emotion, it has not yet been tested on musical genre when controlling for lyrics. After all, music can convey emotional messages through contextual information imbedded within the lyrics of a song, which may or may not be congruent with musical features (Ali & Peynircioğlu, 2006; Mori & Iwanaga, 2014; Patel, 2010; Stratton & Zalanowski, 1994).
Negative Stereotypes Associated with Heavy Metal and Hip Hop
Heavy-Metal and hip-hop music are two representative genres of so-called "problem music" (Bodner & Bensimon, 2015; Lozon & Bensimon, 2014), often thought to be associated with emotion words such as anger and disgust, high arousal (energy) and negative valence emotions (that is, occurring in the extremes of the second quadrant of a two-dimensional emotion space, see Russell, 1980). Barongan and Hall (1995) studied the effects of misogynistic lyrics in rap (i.e., hip-hop) music on White American participants. Two groups of listeners were assigned to one of two conditions. Participants in Group 1 were asked to listen to misogynous rap music and Group 2 were asked to listen to non-violent rap (i.e., lyrics were non-misogynous). After listening to the music, the listeners were asked to choose a short film vignette portraying either a neutral, sexually-aggressive, or assaultive scene. The group of participants who listened to the misogynistic music chose the sexually-aggressive vignette significantly more than the participants who listened to the non-violent music. This suggests that misogynous rap music facilitates sexually aggressive behavior, consistent with the derogatory stereotypes of rap music (Neguţ & Sârbescu, 2014; Reyna, Brandt, & Viki, 2009).
Barongan and Hall's (1995) study suggests that sexually aggressive association with the music was informed by the semantic content of the lyrics. However, overall, these participants reported that they disliked the music, with mean scores for liking of less than 3 on a scale from 1 (strongly disliked) to 5 (strongly liked). The listeners therefore had low fandom for rap music, and, as STEM proposes, may have been more disposed to stereotyping rap with sexual aggression. Several studies investigating misogynistic and violent lyrics in "problem music" have argued that lyrics induce negative effects in a listener (Cundiff, 2013; Lennings & Warburton, 2011; Martino et al., 2006; Mast & McAndrew, 2011), including negative stereotyping effects regardless of the individual's relationship with and knowledge about the genre. However, the role of expertise has, to our knowledge, not been explicitly controlled.
Dunbar, Kubrin, and Scurich (2016) investigated whether Americans' perception of rap music was influenced by genre-specific stereotypes. Replicating a study conducted by Fried (1999), Dunbar and colleagues tested whether listeners presented with lyrics labelled as rap were perceived as more threatening, dangerous and in need of regulation in comparison to identical lyrics labelled as country. Participants were randomly assigned to either lyrics labelled as rap or labelled as taken from a country song. They were then asked to respond to 14 different items on a 9-point Likert scale from 1 (strongly disagree) to 9 (strongly agree), measuring the offensiveness of the lyrics, their threatening nature and if the song should be regulated. The findings suggested that when the lyrics were labelled as taken from a rap song, they were considered more negative and in need of more regulation, compared to when the same lyrics were labelled as taken from a country song, consistent with Fried's (1999) results. The authors concluded that rap music may overall be negatively stereotyped.
Associations with lyrics can therefore be influenced by their genre membership, suggesting that stereotypes of the music genre might inform other associations, including emotional responses to music. Furthermore, it may be that the individual's relationship with and knowledge of the music (e.g., fan versus non-fan) will influence the extent to which stereotyping occurs (e.g., because of the more filtered—or stereotyped—emotions availed to the non-fan). Heavy-metal and hip-hop music are ideal genres to study because of their identification in some literature as "problem music" (Lozon & Bensimon, 2014) and often assumed expression of negative, high-arousal emotions, based on the foregoing review of the literature. Consequently, these two genres provide material for investigating possible influence of fandom predicted by STEM and the influence of lyrics in particular.
AIM
This study investigated whether music genre stereotyping influences emotion perception to further investigate whether stereotyping is more likely to occur for individuals who are not fans of the genre. The investigation focusses on a comparison of heavy-metal and hip-hop music genres using pop music as a control. Two specific hypotheses, based on the Stereotype Theory of Emotion (STEM), were tested:
- H1. Music identified as heavy metal or hip hop is perceived as expressing high arousal/negative valence emotions in comparison to pop music with identical lyrics.
- H2. Participants with low fandom of a genre are more susceptible to emotion stereotyping than participants with high fandom.
METHOD
Participants
Two hundred and thirty-eight participants were recruited. Their ages ranged from 18 to 42 years (M = 22.3, SD = 3.76; 151 females and 87 males). Participants were distributed at random into one of two sets, A or B (explained in the Procedure section). Set A comprised 115 participants (M = 20.7, SD = 2.89 years; 86 females and 29 males) and Set B comprised 123 participants (M = 20.67, SD = 2.0 years; 65 females and 58 males). All participants were undergraduate students at a tertiary education institution in a multicultural city of Australia. Participants received course credit for participating in the study.
Materials
The stimuli were comprised of eight music excerpts each of approximately 24 seconds in duration and sharing lyrics across combinations of genre pairs, the genres investigated being heavy metal, hip hop, and, as a control, pop (see Table 1).
For each excerpt, we selected a continuous passage of lyrics that was either an entire verse or refrain (i.e., chorus). The lyric passages were of varying word length (range 22-57 words) with an average of 40.50 words per excerpt.
Design
Participant responses were collected using an online survey designed using Key Survey software (www.keysurvey.com). The music excerpts were divided into two sets of four. Each set consisted of two test excerpts and two control excerpts. Set A consisted of two hip-hop stimuli (test excerpts), and two pop stimuli (control excerpts). Set B consisted of two heavy metal stimuli (test), and two pop stimuli (control). The lyrics of the two pop control excerpts in Set A were matched with the lyrics of the two heavy-metal test excerpts in Set B. The lyrics of the two pop control excerpts in Set B were matched with the lyrics of the two hip-hop test excerpts in Set A. Using this design, participants heard excerpts with different lyrics, but the lyrics across the sets were identical. Only genre was manipulated across the sets.
| Music excerpt number and name | Control stimulus, music genre, and set membership | Test stimulus, music genre, and set membership | Lyrics | LIWC Positive Emotions % | LIWC Negative Emotions % | iFeel Most Frequent Emotion Polarity |
|---|---|---|---|---|---|---|
| 1. Lay Lady Lay | Bob Dylan (1969) Pop (Set A) | Ministry (1996) Heavy metal (Set B) | Why wait any longer for the world to begin You can have your cake and eat it too Why wait any longer for the one you love When he's standing in front of you | 2.86 | 0 | Positive |
| 2. Bitches Ain't Shit | Ben Folds (2005) Pop (Set B) | Dr. Dre (feat. Jewel, Tha Dogg Pound and Snoop Doggy Dogg) (1992) Hip hop (Set A) | I'm back to the motherfuckin' county jail Six months on my chest, now it's time to bail I get released on a hot sunny day My nigga D.O.C. and my homey Dr Dre Scooped in a coupe, Snoop we got news Your girl was trickin' while you was draped in your country blues I ain't been out a second And already gotta do some motherfuckin' chin checkin' | 1.75 | 1.75 | Positive Negative Neutral |
| 3. In-A-Gadda-Da-Vida | Iron Butterfly (1968) Pop (Set A) | Slayer (1987) Heavy metal (Set B) | Oh, won't you come with me And take my hand Oh won't you come with me And walk this land Please take my | 0 | 0 | Positive |
| 4. Sleazy | Ben Folds (2010) Pop (Set B) | Kesha Sebert (2010) Hip hop (Set A) | I don't need you or your brand-new Benz Or your bougie friends I don't need love, looking like diamonds | 4.17 | 0 | Positive |
Note. Target words for each stimulus are in bold font.
Sentiment Analysis of Lyrics
To document the nature of the emotion expressed by the lyrics (which were identical across Sets A and B), sentiment analysis software was used to examine the prevalence of positive emotion words and negative emotion words, generated by the Linguistic Analysis Word Count (LIWC) software 2007 (Pennebaker, Boyd, Jordan, & Blackburn, 2015; Pennebaker, Francis, & Booth, 2007). LIWC cross-analyzes text with a dictionary of almost 6,400 words, assessing the target text according to the degree to which it expresses positive and negative emotion (among other aspects of sentiment) (Tausczik & Pennebaker, 2010). To cross-check LIWC's output, we also used the output of 18 sentiment analysis tools generated by iFeel Sentiment Analysis Framework (http://blackbird.dcc.ufmg.br:1210). iFeel categorizes each of these outputs into positive, negative or neutral emotion polarity from which the most frequent polarity can be determined (Araújo, Gonçalves, Cha, & Benevenuto, 2014). Table 1 summarizes the LIWC and iFeel emotion valence results of the lyrics. Overall, three of four passages rated 0 on the LIWC negative emotion scale, while 1 passage (Stimulus 2, see Table 1) achieved equal percentages for both positive emotions and negative emotions (1.75%). Both analyses show that the lyrics in the stimuli were overall positive.
Procedure
Ethics approval was obtained from the host university's Ethics Advisory Committee. Participants were assigned at random to one of two excerpt sets: A or B. All participants completed the questionnaire online in their own time. The study was conducted in three stages. In the first stage, participants were asked to report their fandom for heavy-metal, hip-hop and pop genres on a scale from 1 (non-fan – never listen to it) to 5 (fan – listen to it all the time).
In the second stage, participants were presented with the four stimuli (one at a time) from their assigned set (Table 1) in a different random order for each participant. After listening to a stimulus, participants were asked what emotion they thought the music was trying to express: "Please listen to the following music excerpt only once. From your first impression, what emotion do you think the music is trying to express?" The answer options given to the participants were: anger; disgust; fear; happiness; sadness; and surprise. In addition to these six emotion options, we added two further possible responses, "none" and "other", to increase the likelihood that participants were able to report an emotion spontaneously, without necessarily being restricted to the emotions listed (for a discussion, see Russell, 1994). If the music expressed an emotion not mentioned in the list provided, participants were instructed to choose the option "other", and to type which other emotion was expressed by the music. After the emotion reporting task, participants were asked if they were familiar with the excerpt they just heard, provided with a yes/no answer option, and if they could name (or guess the name of) the song by typing their response.
In the third stage, participants were presented with a surprise memory task comprising a list of 11 words. Six of the words were target words that were featured in the lyrics for the music stimuli and five were foils that were not featured in the lyrics of the music. The target words were: cake, diamonds, hand, jail, land, and world, as indicated in bold in Table 1. The foil words presented were: beach, bloodthirsty, dope, prayer, and summer. Participants were asked to select the words they thought were sung: "Please check any of the following words you think you heard in the previous music excerpts." Two of the five foil words, bloodthirsty and dope, were selected because they were both words often associated with heavy metal (Noys & Schmitt, 2010; Roccor, 2000) and hip hop (Alim, 2006; Morgan, 2017), respectively, even though they appeared in none of the stimuli used.
RESULTS
Data Pre-Processing for Stage-Two Responses
To reduce the effect of emotion perception through explicit knowledge of the music excerpts, we identified and removed from further analysis participant responses that correctly recalled or guessed the name of the excerpts. Fifteen responses were removed. Of the 223 remaining participants, 107 responded to hip-hop test excerpts (Set A) and 116 to heavy-metal test excerpts (Set B), in addition to the respective pop control excerpts. Table 2 summarizes these participants' Stage-Two responses to each stimulus.
| Genre Condition | ||||||||
|---|---|---|---|---|---|---|---|---|
| Emotion | Test Condition | Control Condition | ||||||
| Heavy metal 1 | Hip hop 2 | Heavy metal 3 | Hip hop 4 | Pop 1 | Pop 2 | Pop 3 | Pop 4 | |
| Anger | 87 | 38 | 71 | 31 | 5 | 5 | 6 | 0 |
| Disgust | 11 | 40 | 11 | 23 | 5 | 3 | 23 | 3 |
| Fear | 2 | 1 | 3 | 3 | 4 | 6 | 1 | 1 |
| Happiness | 3 | 6 | 7 | 8 | 3 | 32 | 13 | 21 |
| Sadness | 5 | 0 | 1 | 5 | 85 | 13 | 33 | 56 |
| Surprise | 1 | 4 | 4 | 2 | 1 | 5 | 3 | 2 |
| None | 0 | 6 | 13 | 17 | 3 | 23 | 10 | 7 |
| Other | 7 | 12 | 6 | 18 | 10 | 20 | 27 | 17 |
| Total | 116 | 107 | 116 | 107 | 116 | 107 | 116 | 107 |
Note. Stimuli numbers after the genre (e.g. '4' in 'Hip hop 4') are explained in Table 1.
Data Pre-Processing for "Other" Emotions
Responses for "other" emotions totaled 117. These were pre-processed to identify the categories of emotions used in subsequent analysis. This involved eight data steps, based on Augustin, Wagemans, and Carbon (2012) and on Susino and Schubert (2018):
- Correction of spelling errors.
- Extraction of task-related parts from a sentence. For example: "Happy and sad" was coded as one count of "happy" and one count of "sad".
- Removal of function words (articles and pronouns).
- Removal of qualifiers. For example, "mostly angry" was coded as "anger".
- Consolidating of singulars and plurals for the same noun.
- Consolidating nouns and corresponding adjectives (such as, aggression, aggressive).
- Consolidating words that have the same stem (i.e., part of a word). For example, "hope" and "hopeful" have the same stem, "hope". The term chosen to represent emotions with the same stem, such as "hope/hopeful" was the one with the highest frequency. When this was not possible due to equal counts, it was based on the researchers' discretion.
- A total of 99 emotion responses were identified by author MS and checked by author ES. Of the 99 emotion responses identified, 18 were determined to be unique emotion terms and distributed in emotion space, as described below.
Categorization of Emotion Responses Based on Emotion Space Quadrants
We first examined the distribution of emotion responses for the test genres (heavy metal and hip hop) in comparison to the control genre (pop). Six categories were formed, and these categories constituted the dependent variable, of which five were emotion categories and one was a non-emotion category. Four of the five emotion categories were based on regions of the two-dimensional emotion space in which emotions are distributed along valence and arousal dimensions in a two-dimensional space (Russell, 1980; Schubert, 1999). To ensure that the high arousal/negative valence (referred to as 'Quadrant 2') region captured a reasonably homogenous set of emotions, the criterion for membership of that category was made narrower than "anywhere within Quadrant 2". The region was set based on empirical data of the emotion word exemplars on so-called "problem music," described in the literature review and as applied in the checklist of emotion words (specifically, anger, disgust, and fear). The same approach was taken to more tightly defining the regions for the other three quadrants as shown in Figure 1.
The quantification of the boundaries within these quadrants on the emotion space are reported in Table 3, based on the Affective Norms for English Words (ANEW, Bradley and Lang, 1999) database values for the emotions from the checklist belonging to each quadrant. The ANEW database lists empirically assessed valence and arousal values for English emotion words on a scale from 1 (low) to 9 (high). We used the scores for "happy" and "surprise" to determine the boundaries within which other words would be classified as Q1, meaning that to be a member of the Q1 region, words would require a valence score not lower than 7.47 (the lowest valence value of the checklist of Q1 words), and an arousal score not lower than 6.49 (the lowest arousal value of the initial checklist of the Q1 region words). All emotion terms for which arousal and valence values did not fit any of the Q1 to Q4 regions were categorized as "other emotion" (OE), such as "hope" (note that OE is not the same as the raw, self-reported "other"-category option collected in Stage 2 of the procedure). The location of the quadrant regions and the OE category boundaries can be visualized using the emotion-space shown in Figure 1. Furthermore, words were categorized as "no emotion" (NE) for participants who reported "none" in Stage 2 or when "other" consisted of a non-emotion term, such as "criticism."
| Category | Emotion | Emotion Space region boundary* | |
|---|---|---|---|
| Valence Mean | Arousal Mean | ||
| Q1 | Happy | 8.21 | 6.49 |
| Q1 | Surprised+ | 7.47 | 7.47 |
| Q2 | Anger | 2.34 | 7.63 |
| Q2 | Disgusted+ | 2.45 | 5.42 |
| Q2 | Fear | 2.76 | 6.96 |
| Q3 | Sad | 1.61 | 4.13 |
| Q4 | Relaxed** | 7.00 | 2.39 |
| OE (Other Emotion) | Other emotions that do not fit into one of the four rectangular regions as defined above. On those occasions when an emotion word did not fit any of rectangular regions Q1 to Q4, but were clearly emotions, they were classified as OE. | ||
| NE (No Emotion) | No emotion or reported as "other" but could not be placed into one of the above five categories. | ||
Note.
*The bold font, arousal-valence value shown is used to create the rectangular region within each quadrant by extending two perpendicular lines from the coordinate to the outer edges of the same quadrant to form the smaller rectangular region used for categorizing the emotions (see Figure 1). The value is based on checklist intra-quadrant words with mean arousal or valence with a value closest to the scale center (5, on a scale of 1 to 9) as according to ANEW database. For example, "surprised" has valence closest to 5 of the two Q1 representative words, and "happy" has the closest-to-5 arousal of the two Q1 representative words, and so that arousal-valence coordinate (7.47, 6.49) describes the vertex of the smaller, rectangular region within Quadrant 1 that constitutes the smaller Q1 region used for the purpose of the emotion category grouping for all reported emotion words.
**Most reported emotion from the "other" checklist response representing Q4.
+ While we used the noun for these two emotions, here we report the scores based on ANEW which uses the adjective of these two emotions.
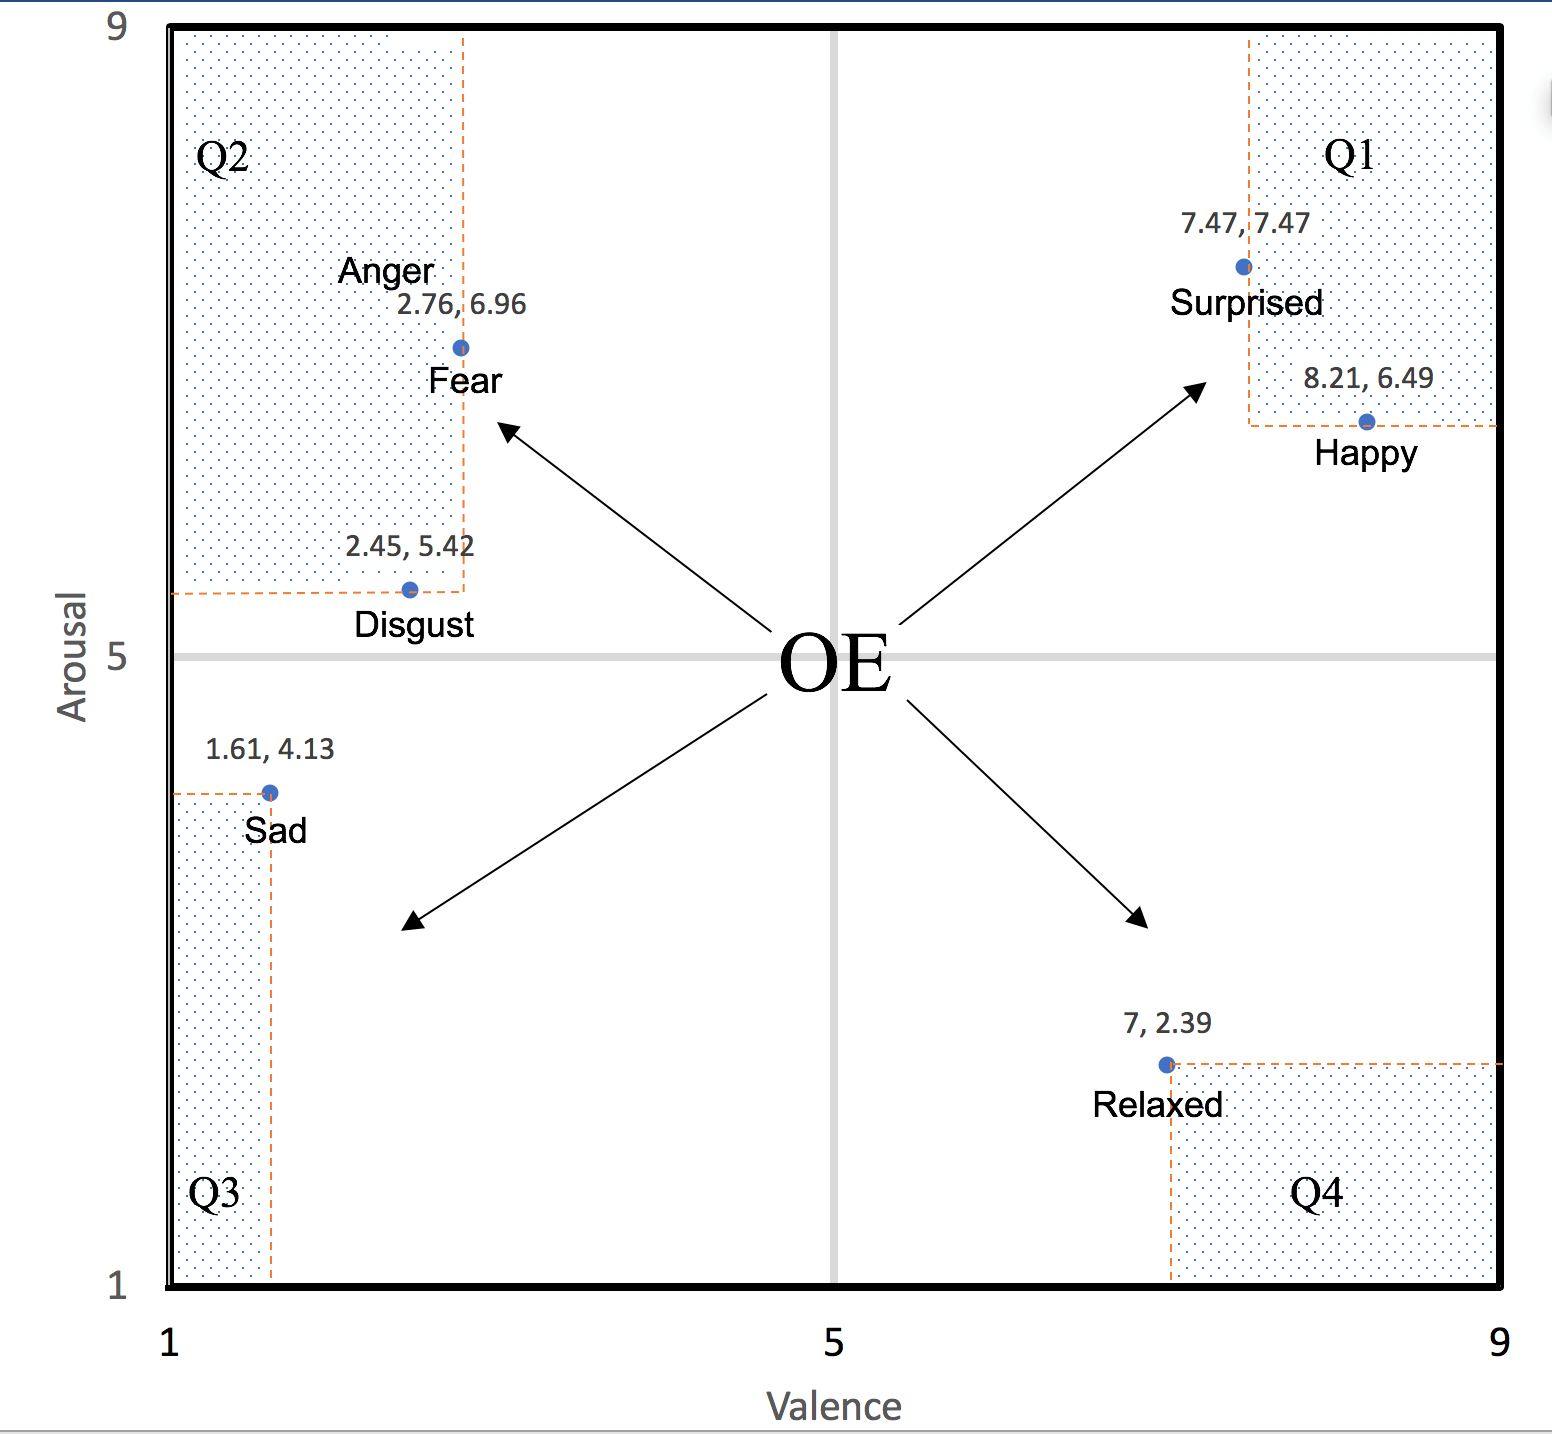
Figure 1. Two-dimensional emotion space showing regions used to define emotion categories described in Table 3. QX refers to the rectangular region within Quadrant X (see Table 1). OE refers to the remaining area of the emotion space, representing all other emotion words. The coordinates of the word "anger" (2.34, 7.63) are wholly captured within Q2 (see Table 1).
Using a chi-square analysis, we tested the distribution of each emotion category and non-emotion category for all the test stimuli (heavy metal and hip hop combined), using the control (pop) stimuli as the comparison distribution. There was a significant overall difference in distribution of test stimuli compared to control stimuli (χ2(5, N = 81) = 352.13, p < .001, Cramer's V = .397). As evident in Table 4, count of emotion words in Q2 (high arousal/negative valence) is considerably overrepresented in the test condition, in comparison to the other emotion categories. Note, too, that counts for each emotion category other than Q2 have similar or higher counts in the control condition, suggesting a wider range of emotions used to describe pop music in comparison to heavy metal or hip hop (combined).
| Category (sample emotion word) | Control counts | Test counts |
|---|---|---|
| Q1 (happy, surprised) | 86 | 38 |
| Q2 (anger, disgust, fear) | 66 | 324 |
| Q3 (sad) | 189 | 13 |
| Q4 (relaxed) | 8 | 3 |
| OE | 77 | 60 |
| NE | 20 | 8 |
To further test H1, we compared the proportion of Q2 (high arousal/negative valence) counts with the remaining five categories—Q1, Q3, Q4, OE and NE— that would be expected to occur by chance for the test conditions and again for the control conditions. Using a chi-square analysis, results showed no significant deviation from the distribution expected by chance for pop music control condition (χ2 (1, N = 65) = 0.542 p = 0.462, phi = .0913). However, a significant deviation was returned for the test condition (χ2(2, N = 323) = 283.553 p < 0.01, phi = .9369). Heavy-metal and hip-hop conditions had above-chance representation of high arousal/negative valence (Q2) emotions whereas pop did not, even though the lyrics were identical between the pop control and the test (heavy-metal and hip-hop) excerpts. This is consistent with H1.
High Arousal/Negative Valence Emotion Responses Based on Fandom
The overall fandom for each of the genres was examined. Low overall fandom was reported for genres that produced stereotyped emotions: Heavy metal (fandom M = 1.93, SD = 1.08) and hip hop (fandom M = 3.32, SD = 1.15) had the lowest means and pop had the highest (fandom M = 4.14, SD = 0.94). To test H2 we used fandom scores as the dependent variable, with the stimulus as the independent variable. A Kolmogorov-Smirnov test indicated that fandom scores did not follow a normal distribution, D(223) = 0.25, p < .0001 making parametric testing inappropriate. The distribution of fandom ratings for pop music was negatively skewed with a very small number of participants indicating 1 (n = 4) and 2 (n = 8) fandom scores (fandom scale ranged from 1 to 5), making pooled fandom scores potentially misleading because high fandom scores may be confounded by fandom for pop music, rather than fandom in general. We therefore decided to eliminate pop music responses for this analysis and conduct a Kolmogorov-Smirnov test comparing heavy-metal and hip-hop fandom scores.
We examined fandom scores for participants who perceived heavy metal and hip hop as expressing high arousal/negative valence emotions (Q2) in comparison to other quadrants, with emotion being the independent variable having two levels, Q2 and non-Q2 (i.e., combination of Q1, Q3, Q4, and OE). A Kolmogorov-Smirnov test showed a significant deviation from normality, D(447) = 0.95, p < .05 making parametric testing inappropriate. The distribution of fandom ratings on a scale range from 1 to 5 for heavy metal and hip hop combined was 1 (n = 85), 2 (n = 77), 3 (n = 33), 4 (n = 11), and 5 (n = 12). A Mann-Whitney test indicated that fandom scores were lower for participants reporting Q2 emotions (Mdn = 2, n = 324) than for non Q2 emotions (Mdn = 3, n = 122) (U = 17.48, p = .0055, χ2 = .59). The results confirm that low fandom towards a genre is better associated with Q2 (i.e. stereotyped) emotions than with any other emotions, lending support to H2.
Lyric Recall
To test if participants recalled the lyrics, we compared the number of target words and the number of the exclusive foil words selected for each of the four stimuli. We planned to list two target words for each stimulus, such that our expected counts would be divided with a ratio of 2:5 (target to foil), but we unintentionally chose one target word for stimulus 2 and stimulus 4 (with two target words for stimuli 1 and 3—see Table 1). Expected ratios were adjusted accordingly, that is 1:5 for stimuli 2 and 4. Using chi-square tests, we examined the proportion of target-to-foil words recalled. As shown in Table 5, target lyrics were recalled statistically above chance and foil words statistically below chance for each stimulus, except for Pop 2 where they were statistically recalled at chance levels only. With the exception of this excerpt, we concluded that listeners could discriminate the lyrics at above chance levels regardless of genre, but when there was no above-chance recognition, it was not due to any particular characteristic concerned with the intelligibility of the test genres.
| Stimulus | Observed target (and foil) counts | Expected target (and foil) counts | Chi-square test |
|---|---|---|---|
| Pop 1 | 106 | 65.625 | 39.744, p <.0001 |
| (69) | (109.375) | ||
| Metal 1 | 37 | 20.333 | 16.394, p <.0001 |
| (85) | (101.667) | ||
| Pop 2 | 25 | 18.333 | 2.909, p = .0881 |
| (85) | (91.666) | ||
| Hip hop 2 | 26 | 15.833 | 7.834, p = .0051 |
| (69) | (79.167) | ||
| Pop 3 | 80 | 49.666 | 46.071, p <.0001 |
| (69) | (99.334) | ||
| Metal 3 | 71 | 44.571 | 21.940, p <.0001 |
| (85) | (111.429) | ||
| Pop 4 | 192 | 79.143 | 225.306, p <.0001 |
| (85) | (197.857) | ||
| Hip hop 4 | 75 | 24 | 130.050, p <.0001 |
| (69) | (120) |
Note. Two-tailed p-values shown, with 1 degree of freedom. Stimuli numbers are explained in Table 1. There were five foil words in each comparison (See Stage 3 of Procedures).
DISCUSSION AND CONCLUSION
The aim of this research was to investigate whether heavy-metal and hip-hop music is stereotyped with negative emotions. The innovative aspects of the study design were that we used overall positively valenced emotion lyrics, and we used cover songs such that the same lyrics were available in a pop music (control, not emotion stereotyped) performance and either a heavy metal or a hip hop (test, emotion stereotyped) performance. We hypothesized that the test pieces would be rated as expressing negative emotions (compared to the control pieces), despite the matched lyrics. The results were consistent with the hypothesis, with both of the test genres expressing significantly more frequent high arousal/negative valence emotions compared to pop stimuli. These emotions included anger, disgust, and fear, emotions often associated with heavy-metal and hip-hop music and culture (Boyd, 2008; Butler, 2004; Scheel & Westfeld, 1999). We also hypothesized that stereotyping of high arousal/negative valence emotions would be more commonly observed in listeners with low fandom of the music genres in question. Statistical analysis was consistent with this hypothesis. We could eliminate the role of lyrics alone because they were identical across test and control excerpts, and the lyrics were recognized above chance, in comparison to fabricated, lure words.
These results are consistent with the STEM predictions (Susino & Schubert, 2017) that music can trigger an automated mental representation of emotion held by the listener about the music genre. Emotion perception was not solely a function of the content of lyrics because if they were, responses would have been the same, regardless of the genre in which the lyrics were presented. The differences must therefore be attributable to musical features, or extra-musical aspects. Of the extra-musical aspects, we propose that stereotyping is contributing a major role.
The limitations of our design meant that several aspects of STEM were tested only implicitly. STEM suggests that stereotyped emotions occur spontaneously, and so the presence of a list of emotion words may have thwarted the spontaneity of the task. Different ways of collecting emotion data to mitigate this issue will be required, such as open-ended responses of any kind (not limited to emotion), to see if emotions are spontaneously evoked (e.g., Susino & Schubert, 2018). However, it is worth mentioning that even though participants could select no emotion for the various stimuli, for the test stimuli this option was chosen for less than 2 % of responses (8 out of 438, see Table 4), suggesting the presence of spontaneous emotional responses. Limited (negative) emotional responses to one genre compared to another genre with identical lyrics provides evidence of automated genre emotion stereotyping. However, the design did not eliminate the possibility that musical features (which are also different across different genres) is also implicated in addition to stereotyping. Our analysis tested for extra-musical, stereotypical associations of music with specific emotions, however, it did not account for specific associations of emotion with psychoacoustic cues (Gabrielsson & Lindström, 2010). This is a complex matter, since meaning is woven into music in an intricate, multidimensional way. Dissociating lyrics from the non-lyric aspects of music is a complex area of research (Ali & Peynircioğlu, 2006; Besson, Faita, Peretz, Bonnel, & Requin, 1998; Brattico et al., 2011; Fedorenko, Patel, Casasanto, Winawer, & Gibson, 2009) and future research will need to consider this matter.
The use of computerized sentiment analysis to decipher the emotional valence of lyrics is another limitation because meaning can vary greatly between language, slangs, and cultures (Maas, Karsawa, Politi, & Suga, 2006). Although we produced evidence that lyrics were understood regardless of genre, more detailed investigation of how the lyrics are understood may also be beneficial to future research, in order to capture the subtlety of interpreting the meaning of the lyrics, rather than just the recognition of the words. Some kind of comprehension task could be one way to do this. Another possibility would be to consider cross-checking computerized text analysis with experts in the slang and culture of the lyrics being analyzed.
Finally, research into emotion stereotyping in music would benefit from investigating a broader number of music genres beyond the ones generally found in Western culture (Juslin, Barradas, Ovsiannikow, Limmo, & Thompson, 2016; Susino, 2015). Nevertheless, the present research supports the idea that emotion stereotyping for some music genres occurs with minimal influence due to non-stereotyped lyrics. Besides, if stereotyping may, under some circumstances, trigger high-arousal and negative-valence emotional responses to heavy metal and hip hop, it is plausible that it may also trigger stereotypical emotional responses to other genres. These may include positive emotions such as happy and calm in genres such as Western classical music or some traditional music genres. Recent empirical testing supports this proposition (Susino & Schubert, 2018). In sum, such studies, in addition to the present, are beginning to build a picture of our understanding of emotional stereotyping of music. Specifically, evidence is building that stereotyping plays a significant role in how we process emotion in music, pointing to new pathways in emotion research.
ACKNOWLEDGEMENT
The research supported in this article was supported by the Australian Government Research Training Program (RTP2016LO1602) and the Australian Research Council (DP160101470 and FT120100053). This article was copyedited by Niels Christian Hansen and layout edited by Diana Kayser.
NOTES
-
Correspondence can be addressed to: Marco Susino, College of Humanities, Arts and Social Sciences, Flinders University, Australia. E-mail: marco.susino@flinders.edu.au.
Return to Text
REFERENCES
- Ali, S. O., & Peynircioğlu, Z. F. (2006). Songs and emotions: are lyrics and melodies equal partners? Psychology of Music, 34(4), 511-534. https://doi.org/10.1177/0305735606067168
- Alim, H. S. (2006). Roc the mic right: The language of hip hop culture. New York, NY: Routledge. https://doi.org/10.4324/9780203006733
- Araújo, M., Gonçalves, P., Cha, M., & Benevenuto, F. (2014). iFeel: a system that compares and combines sentiment analysis methods. Paper presented at the 23rd International Conference on World Wide Web, Seoul, Republic of Korea. https://doi.org/10.1145/2567948.2577013
- Augustin, M. D., Wagemans, J., & Carbon, C.-C. (2012). All is beautiful? Generality vs. specificity of word usage in visual aesthetics. Acta Psychologica, 139(1), 187-201. https://doi.org/10.1016/j.actpsy.2011.10.004
- Balkwill, L. L., & Thompson, W. F. (1999). A cross-cultural investigation of the perception of emotion in music: Psychophysical and cultural cues. Music Perception, 17(1), 43-64. https://doi.org/10.2307/40285811
- Barongan, C., & Hall, G. C. N. (1995). The influence of misogynous rap music on sexual aggression against women. Psychology of Women Quarterly, 19(2), 195-207. https://doi.org/10.1111/j.1471-6402.1995.tb00287.x
- Besson, M., Faita, F., Peretz, I., Bonnel, A.-M., & Requin, J. (1998). Singing in the brain: Independence of lyrics and tunes. Psychological Science, 9(6), 494-498. https://doi.org/10.1111/1467-9280.00091
- Bodner, E., & Bensimon, M. (2015). Problem music and its different shades over its fans. Psychology of Music, 43(5), 641-660. https://doi.org/10.1177/0305735614532000
- Boyd, T. (2008). Young, black, rich, and famous: The rise of the NBA, the hip hop invasion, and the transformation of American culture. Lincoln, Nebraska: University of Nebraska Press.
- Brattico, E., Alluri, V., Bogert, B., Jacobsen, T., Vartiainen, N., Nieminen, S. K., & Tervaniemi, M. (2011). A functional MRI study of happy and sad emotions in music with and without lyrics. Frontiers in Psychology, 2, 308. https://doi.org/10.3389/fpsyg.2011.00308
- Butler, P. (2004). Much respect: Toward a hip-hop theory of punishment. Stanford Law Review, 56(5), 983-1016.
- Cundiff, G. (2013). The influence of rap and hip-hop music: An analysis on audience perceptions of misogynistic lyrics. Elon Journal of Undergraduate Research in Communications, 4(1), 1-4.
- Dunbar, A., Kubrin, C. E., & Scurich, N. (2016). The threatening nature of "rap" music. Psychology, Public Policy, and Law, 22(3), 280-292. https://doi.org/10.1037/law0000093
- Fedorenko, E., Patel, A., Casasanto, D., Winawer, J., & Gibson, E. (2009). Structural integration in language and music: Evidence for a shared system. Memory & Cognition, 37(1), 1-9. https://doi.org/10.3758/MC.37.1.1
- Fried, C. B. (1999). Who's afraid of rap: Differential reactions to music lyrics. Journal of Applied Social Psychology, 29(4), 705-721. https://doi.org/10.1111/j.1559-1816.1999.tb02020.x
- Gabrielsson, A., & Lindström, E. (2010). The role of structure in the musical expression of emotions. In P. Juslin & J. Sloboda (Eds.), Handbook of Music and Emotion: Theory, Research, Applications. Oxford, UK: Oxford University Press.
- Juslin, P. N. (2013). From everyday emotions to aesthetic emotions: towards a unified theory of musical emotions. Physics of Life Reviews, 10(3), 235-266. https://doi.org/10.1016/j.plrev.2013.05.008
- Juslin, P. N., Barradas, G. T., Ovsiannikow, M., Limmo, J., & Thompson, W. F. (2016). Prevalence of emotions, mechanisms, and motives in music listening: A comparison of individualist and collectivist cultures. Psychomusicology, 26(4), 293-326. https://doi.org/10.1037/pmu0000161
- Juslin, P. N., & Västfjäll, D. (2008). Emotional responses to music: The need to consider underlying mechanisms. Behavioral and Brain Sciences, 31(5), 559-575. https://doi.org/10.1017/S0140525X08005293
- Lennings, H. I. B., & Warburton, W. A. (2011). The effect of auditory versus visual violent media exposure on aggressive behaviour: The role of song lyrics, video clips and musical tone. Journal of Experimental Social Psychology, 47(4), 794-799. https://doi.org/10.1016/j.jesp.2011.02.006
- Lozon, J., & Bensimon, M. (2014). Music misuse: A review of the personal and collective roles of "problem music". Aggression and Violent Behavior, 19(3), 207-218. https://doi.org/10.1016/j.avb.2014.04.003
- Martino, S. C., Collins, R. L., Elliott, M. N., Strachman, A., Kanouse, D. E., & Berry, S. H. (2006). Exposure to degrading versus nondegrading music lyrics and sexual behavior among youth. Pediatrics, 118(2), 430-441. https://doi.org/10.1542/peds.2006-0131
- Mast, J. F., & McAndrew, F. T. (2011). Violent Lyrics in heavy metal music can increase aggression in males. North American Journal of Psychology, 13(1).
- Morgan, J. (2017). When chickenheads come home to roost: A hip-hop feminist breaks it down. New York, NY: Simon and Schuster.
- Mori, K., & Iwanaga, M. (2014). Pleasure generated by sadness: Effect of sad lyrics on the emotions induced by happy music. Psychology of Music, 42(5), 643-652. https://doi.org/10.1177/0305735613483667
- Neguţ, A., & Sârbescu, P. (2014). Problem music or problem stereotypes? The dynamics of stereotype activation in rock and hip-hop music. Musicae Scientiae, 18(1), 3-16. https://doi.org/10.1177/1029864913499180
- Noys, B., & Schmitt, C. (2010). 'Remain true to the earth!': remarks on the politics of Black Metal. Paper presented at the Hideous Gnosis: Black Metal Theory Symposium, Brooklyn, NY.
- Patel, A. D. (2010). Music, language, and the brain. New York, NY: Oxford University Press.
- Pennebaker, J. W., Boyd, R. L., Jordan, K., & Blackburn, K. (2015). The development and psychometric properties of LIWC2015. Retrieved from http://LIWC.net
- Pennebaker, J. W., Francis, M. E., & Booth, R. J. (2007). Linguistic inquiry and word count: LIWC [computer software]. Austin, TX. Retrieved from http://LIWC.net
- Reber, R., Schwarz, N., & Winkielman, P. (2004). Processing fluency and aesthetic pleasure: Is beauty in the perceiver's processing experience? Personality and Social Psychology Review, 8(4), 364-382. https://doi.org/10.1207/s15327957pspr0804_3
- Reyna, C., Brandt, M., & Viki, G. T. (2009). Blame it on hip-hop: Anti-rap attitudes as a proxy for prejudice. Group Processes & Intergroup Relations, 12(3), 361-380. https://doi.org/10.1177/1368430209102848
- Roccor, B. (2000). Heavy metal: Forces of unification and fragmentation within a musical subculture. The World of Music, 42(1), 83-94.
- Russell, J. A. (1980). A circumplex model of affect. Journal of Personality and social Psychology, 39(6), 1161-1178. https://doi.org/10.1037/h0077714
- Russell, J. A. (1994). Is there universal recognition of emotion from facial expressions? A review of the cross-cultural studies. Psychological Bulletin, 115(1), 102-141. https://doi.org/10.1037/0033-2909.115.1.102
- Scheel, K. R., & Westfeld, J. S. (1999). Heavy metal music and adolescent suicidality: An empirical investigation. Adolescence, 34(134), 253-273.
- Schubert, E. (1999). Measuring emotion continuously: Validity and reliability of the two-dimensional emotion-space. Australian Journal of Psychology, 51(3), 154-165. https://doi.org/10.1080/00049539908255353
- Simoni, V. (2013). Intimate stereotypes: The vicissitudes of being caliente in touristic Cuba. Civilisations, 62(2), 181-198. https://doi.org/10.4000/civilisations.3320
- Stratton, V. N., & Zalanowski, A. H. (1994). Affective impact of music vs. lyrics. Empirical Studies of the Arts, 12(2), 173-184. https://doi.org/10.2190/35T0-U4DT-N09Q-LQHW
- Susino, M. (2015). Which emotions are communicated by music cross-culturally? Unpublished master's thesis. The University of New South Wales.
- Susino, M., & Schubert, E. (2017). Cross-cultural anger communication in music: A framework towards a stereotype theory of emotion in music. Musicae Scientiae, 21(1), 60-74. https://doi.org/10.1177/1029864916637641
- Susino, M., & Schubert, E. (2018). Cultural stereotyping of emotional responses to music genre. Psychology of Music, 47(3). https://doi.org/10.1177/0305735618755886
- Tausczik, Y. R., & Pennebaker, J. W. (2010). The psychological meaning of words: LIWC and computerized text analysis methods. Journal of Language and Social Psychology, 29(1), 24-54. https://doi.org/10.1177/0261927X09351676
- Undorf, M., & Erdfelder, E. (2015). The relatedness effect on judgments of learning: A closer look at the contribution of processing fluency. Memory & Cognition, 43(4), 647-658. https://doi.org/10.3758/s13421-014-0479-x
