
INTRODUCTION
ACADEMIC studies of the early blues concur that its pitch scale has within it three microtonal "blue notes" not found in 12 tone equal temperament intonation (Evans, 1982; Kubik, 2008; McClary 2001; Titon, 1977). Furthermore, they find that these notes, together with their tonic, perfect fourth and fifth, constitute a minimal scale structure in the early blues that does not correspond to any of the scales characteristic of the 12 tone equal temperament tradition. It is widely acknowledged that the three blue notes must be "bent" in pitch from a standard note played on a host instrument using 12 tone equal temperament tuning (hereafter 12 tet) (Benward & Saker, 2003; Evans, 1982; Titon, 1977). Weisethaunet (2001) used this conception to define a blue note as representing a deviation from the standard 12 tet note. From the Africanist perspective of Gerhard Kubik (1999, 2008) this formulation belies a European musical bias toward 12 tet. Kubik, an ethnomusicologist/music theorist expert in the musical systems of Africa (2010), describes musical scales containing notes derived from the harmonic series, including those above the third harmonic, to be the norm in African music rather than the exception. Ethnomusicologists Kubik (1999) and Oliver (1970) provide compelling arguments that the blues is the result of a musical scale of west African origin, forced by the institution of slavery, into compromise with 12 tet instruments and harmony. They postulate that the outcome is a uniquely American music that not only continues today, but provides an important basal element in contemporary jazz and rock music.
This study will attempt to quantitatively characterize note pitch from the earliest recordings of the blues scale by its seminal practitioners with respect to 12 tet intonation. Given that the blues is likely a fusion of an African "world music" scale with the 12 tet system, that contrast will be utilized throughout this study. While any exponential ratio of note pitch over tonic system could have been used, this study employed the 12 tet cents system to numerically describe scale pitch (Ellis, 1884). This was done for several reasons: The human ear perceives pitch in a roughly logarithmic fashion; the cents format has an implicit transposition of different performances to a common tonic at zero cents; the blues is inextricably linked to 12 tet, and is a vitally important part of jazz and rock music which are invariably played on 12 tet instruments; and finally, while the major and minor third in rock music have been widely known to "blend" into an intermediate "neutral third", its numerical characterization in cents format has only recently been approached (Temperley, Ren & Duan 2017).
The blues are at the very foundation of jazz and rock music. Early New Orleans jazz was dominated by a blues repertoire (Gioia 2008; Kubik 2005). The blues remains the most common chord progression in the jazz repertoire today (Levine, 1995). Early rock and roll was also dominated by the blues progression (e.g. "Rock around the clock" by Bill Haley and the Comets, and "You ain't nothing but a hound dog" by Elvis Presley). Even the most sophisticated rock music, deeply infused with European harmonic practices, is often blended with a blues base (Doll 2009). A solid blues foundation is essential in building an eclectic understanding of today's jazz and rock music.
Music theorists have speculated extensively on the nature of the blue note and the blues scale. Unfortunately, application of the scientific method has not been possible due to the absence of a tool to empirically collect note pitches in a performance and statistically analyze the results. Peter van der Merwe (1989) identified three blue notes appearing above the tonic note in a "ladder of thirds", and felt that the penchant for the blues artist to sing a third somewhere between a major and minor third, explained the "bent" blue note. His view was that combining these notes with a perfect fifth above and below the tonic (i.e. the roots of the IV and V chords in the harmony) resulted in a hexatonic blues scale. A thorough theoretical discourse on the blues is provided by Kubik (2008, pp. 24-44), who describes the scale as likely derived from music of west central Sudan using harmonics 6, 7, and 8 from two tonics, I and IV; this results in a minor pentatonic base for the blues. He extends this framework to include a note between 12 tet IV and flat V based on the music of Skip James and others, and proposes that this is most likely the eleventh harmonic which is 49 cents flat of 12 tet flat V; this also results in a hexatonic blues scale. Inclusion of the fifth harmonic of I (386 cents) helps explain the large "margin of tolerance" for the flatted-third note of the scale, also called the "neutral third". Curry (2015, 2017) provides an extensive synthesis of these conceptions and adds chromatic elements from ragtime styles which occur later in the eclectic progression of the blues. Curry also points out a likely close association of the blues with the early African American derived barbershop quartet tradition based in just intonation (2015, pp. 258-9)
The most comprehensive empirical study of the blues to date was performed by Jeff Todd Titon (1977). He transcribed 48 blues performances from the late 1920s; this was done entirely by ear, as the computer tools required to do this analysis in a numerical manner were not available at that time. He used up and down arrows over the notes in 12 tet notation to indicate microtonal raising or lowering of notes. He transposed all performances to 'C' and noted three distinct microtonal note groups not found in the 12 tet system. He referred to these three "blue notes" as broad microtonal complexes near E, G and B. He presented his results in a quasi histogram, noting that the blues scale usually extended from the tonic to a tenth with notes in the upper octave being significantly different than those in the main octave (Titon, 1977 p. 155). Titon's book extends far beyond pitch considerations and is a major reference on the subject. David Evans also produced a major reference book on the blues (1982). He too identified three broad microtonal blues notes and referred to them as "tonal areas", which correspond with Titon's "complexes".
The empirical study reported herein examines the fundamental frequencies of blue notes relative to their tonic tone from original recordings of recognized early masters of the blues. A cluster analysis tool from the data mining and machine learning community suitable for interrogating dense, noisy data was selected for use in this study. Cluster analysis combined with computer-based frequency sampling was used to search for blue note clusters. Results will be discussed in the context of various theories proposed to explain the blues.
METHOD
The materials for this study were fifteen audio recordings of acknowledged early masters of the blues. Some of these recordings were produced by John and Alan Lomax (1933) for the Library of Congress in the 1930s, and others were on "race records" from the major recording labels in the late 1920s and 1930s. All artists were drawn from well-regarded ethnomusicology references on the subject (Evans, 1982; Gioia, 2008; Kubik, 1999, 2005; Titon, 1977). These recordings were chosen with a preference for unaccompanied recordings and those with sparse or minimal background instrumentation, to facilitate clean melodic sampling. Performances 2, 3, 7, and 11 were unaccompanied vocals and 14 was accompanied only by a bass guitar. Several later recordings by these same artists were used due to the marked improvement in audio quality. The recordings are listed in Table 1.
| NUMBER | ARTIST | TITLE |
|---|---|---|
| 1 | David "Honeyboy" Edwards (Petway, 1941) | Catfish blues |
| 2 | Vera Hall (1940) | Another man done gone |
| 3 | Vera Hall (1937) | Trouble so hard |
| 4 | John Lee Hooker (1948) | Sally Mae |
| 5 | Samuel "Lightnin" Hopkins (Williams, 1935) | Baby please don't go |
| 6 | Edward "Son" House (1930) | County farm blues |
| 7 | Edward "Son" House (1965) | Grinnin' in your face |
| 8 | Skip James (1931) | Hard time killin' floor blues |
| 9 | Lemon Henry "Blind Lemon" Jefferson (1927) | See that my grave is kept clean |
| 10 | Robert Johnson (1936) | Kind hearted woman blues |
| 11 | Huddie "Leadbelly" Ledbetter (Baker, 1933) | Black Betty |
| 12 | Charley Patton (1929a) | Down the dirt road blues |
| 13 | Charley Patton (1929b) | Pony blues |
| 14 | Alex Ford a.k.a. Sonny Boy Williamson II (1951) | Mighty long time |
| 15 | Chester "Howlin Wolf" Burnett (1951) | Smokestack lightnin' |
Acoustic analysis of the recordings was performed using Audacity (2014), using its 'Plot Spectrum' (i.e. fast Fourier transform) tool with a Hanning window (Ramirez, 1985), at 2048 size to extract frequency peaks from an audio clip. This tool was calibrated over the frequency range of the study (121 to 2,696 Hz) using a 12 tet synthesized triangular wave file, and was found to produce a standard deviation of +/- 0.404 percent, with a random distribution of error terms over the frequency range. Use of a Hanning window of 1024 size introduced unacceptable levels of error. A 4096 Hanning window reduced the error dramatically, but required a note duration which was unacceptably long and would have greatly reduced the number of notes collected. Inclusion of a note in the study required that the note be held for at least an eighth note (usually a syllable), not be part of a glide segment, and that strong guitar background not be present in the vocal sample. The first four harmonics of the spectrum of each vocal note were recorded and their frequencies divided by the harmonic number to calculate the fundamental frequency from each harmonic. These four fundamental measurements were averaged for each note. Sampling in performances where a guitar background was present required the investigator to "dodge" strong guitar strums. As a result, computer-based transcription was not possible. For this reason, no attempt was made to determine pitch trajectory into or out of a sampled note.
Determination of the instrumental harmonic background of a performance using the computer methods used in this study was not possible. The upper harmonics of a low string in a guitar chord merged together with the lower harmonics of the upper strings making determination of the fundamental of each string difficult. For this reason, attempts to examine the harmonic backgrounds of performances were abandoned and only isolated vocal notes were assessed.
Tonic tones were identified by the author by ear for each performance. Logarithms of tonic frequencies were averaged, then converted back to arrive at an average tonic frequency for each performance. Collected pitches were converted into 12 tet microtonal cents format with respect to the average tonic tone for each recording (cents = 1200*ln(noteFrequency/tonicFrequency)/ln(2.0)). In this way, all notes in this study were transposed to a common 12 tet pitch scale relative to their tonic (0 cents). Following Titon's (1977) early observations that blues performances usually spanned a range of a tenth above the tonic with data in the upper octave differing from the lower, data were organized in this fashion. Unlike the results of Titon's study, data were found multiple times up to -220 cents below the tonic. Given that Titon found that data outside the principal octave had a different character than the same note in the main octave, separate octave identity was preserved and the flat seven below tonic was not promoted up into the main octave for these performances. Three performances had the tonic in the middle of the range; in these three cases, lower notes were promoted up into the main octave. One performance presented as two split scale fragments with a 500 cent empty space between them. Raw range data before octave compression is presented in Figure 1.
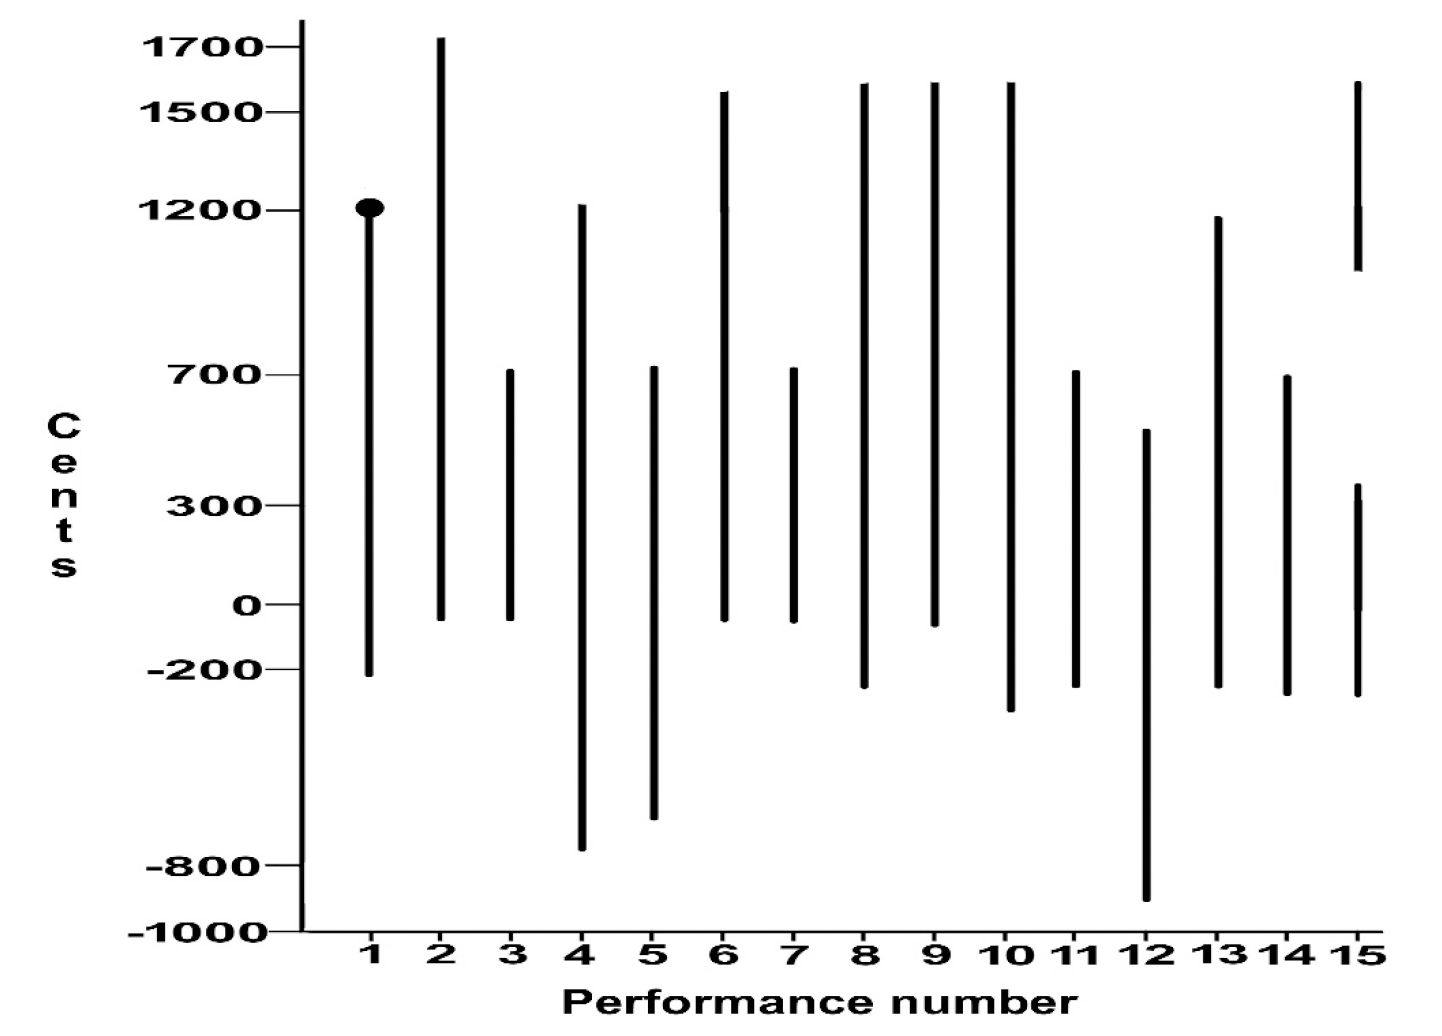
Figure 1. Raw pitch range data before compression for analysis.
Cluster analysis of the data was performed using the DBSCAN clustering algorithm designed for use with dense, noisy data (Schubert et al., 2017). This requires only a minimum cluster size and minimum neighbor distance as input parameters, and does not require the investigator to specify the number of clusters a priori. As a broad overview, its unidimensional variant begins with a single unvisited data point and agglomerates all points within a pitch distance neighborhood of each other; if this cluster reaches the minimum size, the cluster is kept or is otherwise labeled as noise. The next unvisited point in the data set is sequentially chosen and the process repeats until all clusters have been identified or labeled as noise. An open source DBSCAN clustering program (Yaikhom, 2012), originally written in C, was translated into the overarching C++ language by the author and dimensionality reduced to one for simple pitch distance clustering (source code is provided in the Appendix). If the two input parameters are too large, neighboring notes clump together; if these parameters are too small, many tiny sub-note clusters are produced. Overall tonic width was used to iteratively arrive at initial algorithm parameters that identified widely spaced notes (i.e. the fifth and flatted seventh). Fortunately, the range for these two parameters was relatively wide in revealing the note clusters identified by ear by Titon (1977) and Evans (1982).
If an initial coarse-grained clustering revealed a cluster significantly broader than the overall tonic width, performances were subset and/or clustering parameters narrowed to identify individual notes within the broader raw cluster. The rationale for this strategy was based on the concept that the tonic clearly represents a single intended pitch target by the artist. Fortunately, in the blues the tonic target is widely separated from its neighbors (usually a minor third from its upper neighbor and a whole step from its lower neighbor). If two notes in the rest of the scale were close together (e.g. minor and major third), the overall broad cluster was interrogated further for separable targets by subsetting the performances and lowering the initial clustering parameters. The specifics of this subsetting and narrowing of clustering parameters are given in the Results section, for each of the two broad clusters found.
From the outset, it was hoped that note target preferences could be identified for each individual artist; however, it quickly became evident that there was insufficient statistical power to find significant differences between artists. Density-based clustering would not have been possible and it would have been necessary to retreat to a k-means clustering algorithm. A minimum of 5-10 performances for each artist would have been required. While this is a desirable goal for future work, a more global approach was pursued.
For the purposes of this study, it was deemed more important to identify notes that unify all artists in the group rather than to look for individual differences. Once overall clustering was done, each individual cluster was examined to determine if a particular performer(s) dominated the cluster. Notes that were idiosyncratic to a performer are reported in the results for that cluster.
RESULTS
Data from 1,101 notes collected from all 15 performances are summarized in the histogram in Figure 2. The overall cluster analysis results are presented in Table 2. As the sparse upper octave was represented by only six performers, a less stringent density criterion was applied to prevent much of it being labelled noise.
| Mean | Median | Count | Range Low | Range High | Std. Dev. |
|---|---|---|---|---|---|
| -205.8 | -203.4 | 14 | -221.1 | -194.0 | 9.67 |
| -181.3 | -181.0 | 8 | -187.7 | -171.7 | 5.39 |
| -0.31 | -1.47 | 190 | -54.6 | 56.7 | 25.52 |
| 352.2 | 353.0 | 235 | 267.7 | 448.0 | 43.27 |
| 534.3 | 537.2 | 153 | 453.1 | 607.9 | 42.41 |
| 693.3 | 696.5 | 174 | 618.8 | 761.6 | 32.5 |
| 930.1 | 930.0 | 17 | 917.2 | 941.0 | 6.16 |
| 979.1 | 982.6 | 14 | 964.3 | 993.1 | 9.70 |
| 1037.9 | 1034.5 | 49 | 1006.7 | 1071.7 | 17.42 |
| 1094.7 | 1096.5 | 8 | 1086.5 | 1101.3 | 5.46 |
| 1204.2 | 1206.2 | 99 | 1150.9 | 1258.0 | 25.78 |
| 1518.3 | 1520.1 | 38 | 1473.2 | 1559.1 | 23.24 |
| 1582.0 | 1582.6 | 14 | 1561.6 | 1602.6 | 11.73 |
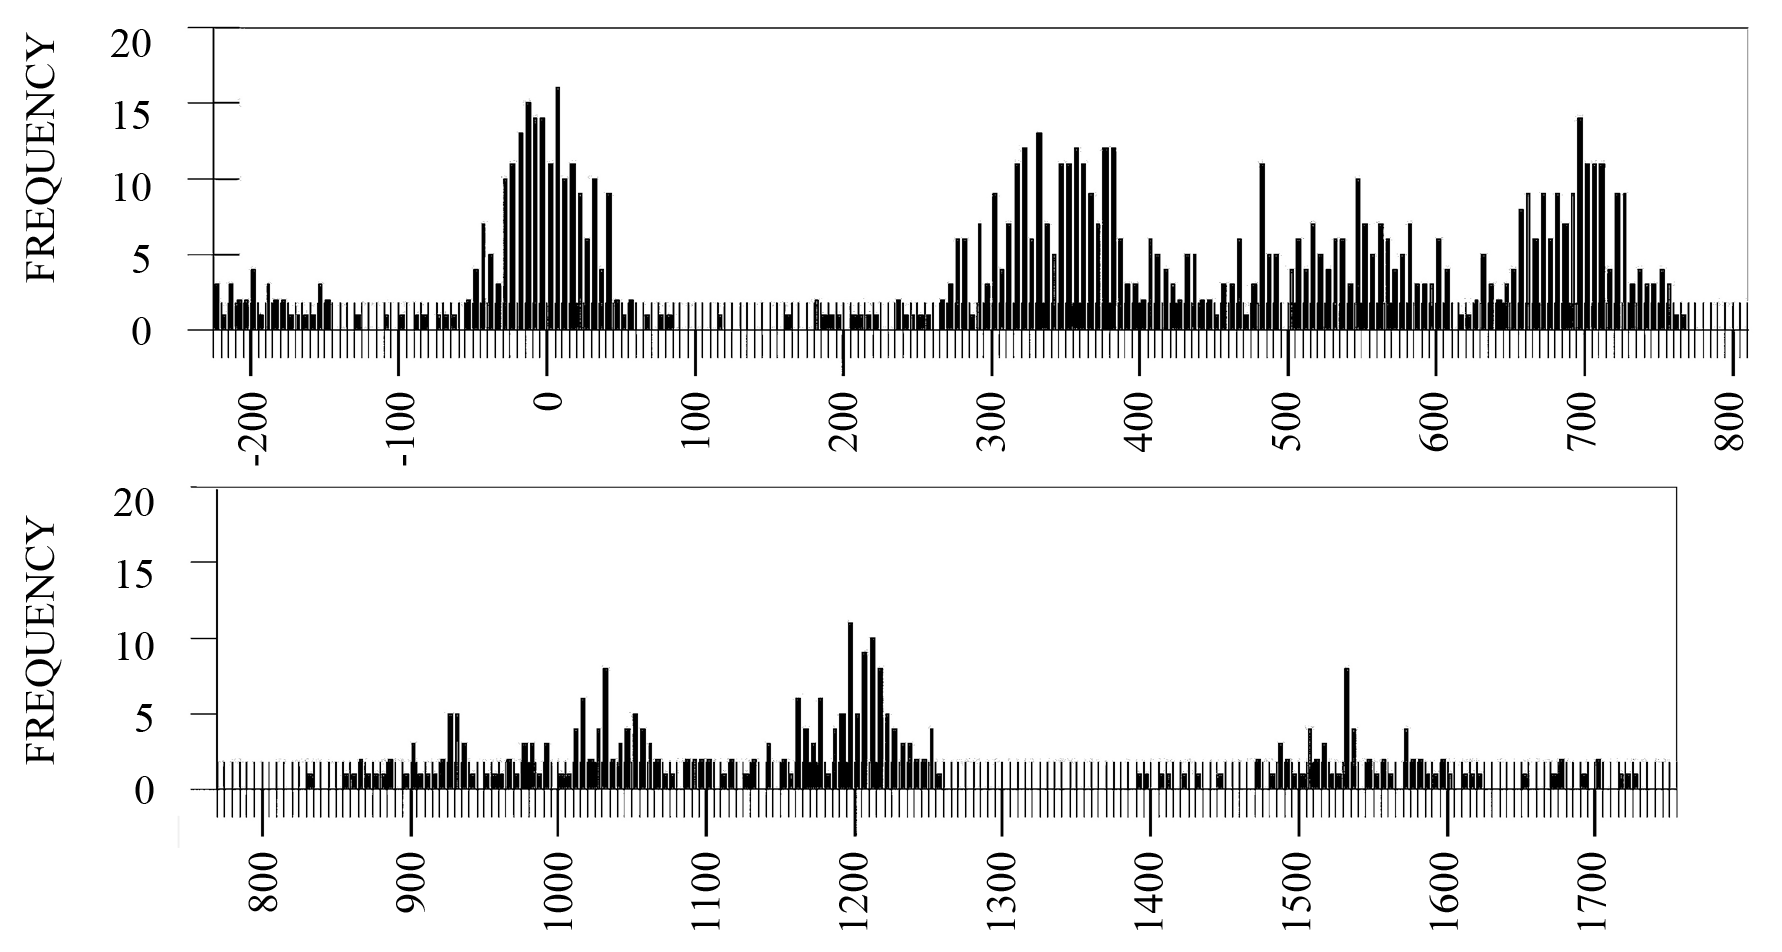
Figure 2. Coarse histogram of entire sample compressed into -225 to 1760 cents.
Reporting of results will proceed by clustered note groups from zero to twelve hundred cents (an octave). The small number of notes occurring above and below this range will be reported along with the corresponding note of the main octave and any differences from notes in the main octave discussed, as suggested by Titon (1977).
The upper and lower register tonic clusters had a similar octave adjusted range and mean pitch. Individual tonic ranges were within +/- 60 cents of the intended target and had generally the same shape as the overall histogram, except for Huddie Ledbetter, whose tonic range was -71.30 to 66.58. Vera Hall had the narrowest tonic range in performance 3 at -37.15 to 27.74, along with Skip James at -32.04 to 34.37. A histogram combining all tonic notes is shown in figure 3 along with a normal distribution with the same standard deviation and number of elements. The tonic distribution roughly conforms to the bell curve of a normal distribution. The standard deviation for the entire sample range was 27.85 cents; Ledbetter had the largest standard deviation at 38.96, and the smallest deviations (16.36, 18.20 and 18.46) were by Hall #3, James, and Patton #13.
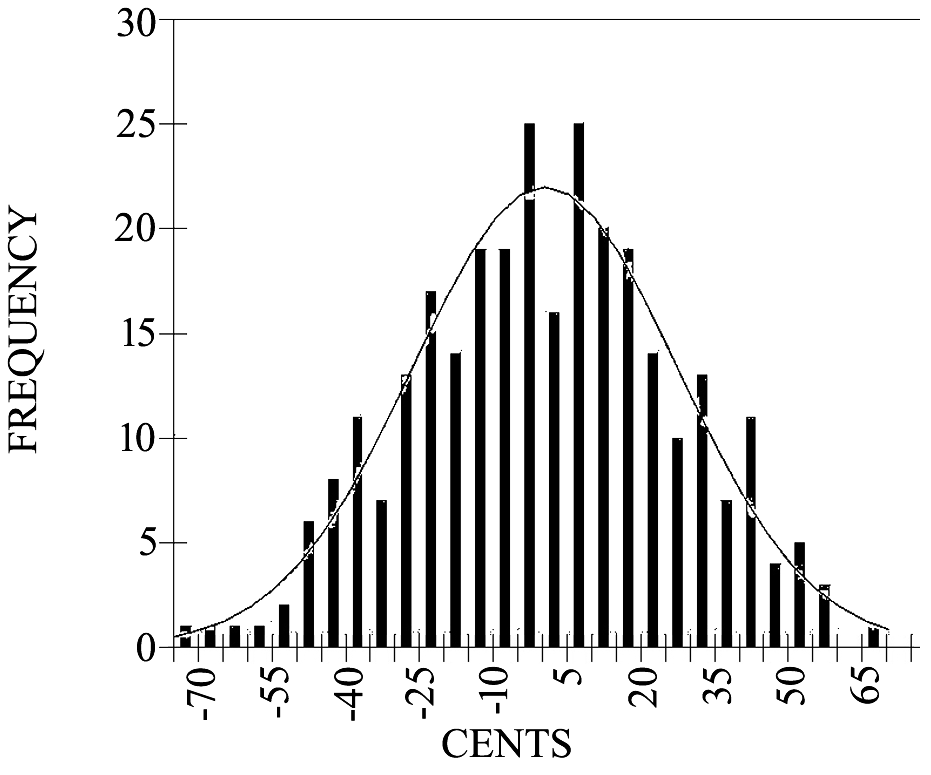
Figure 3. Both tonic tone octaves transposed and combined into a single histogram; the line is a normal distribution for this range.
The cluster range from 267.7 to 448.0 cents was the second most commonly produced set of pitches after the tonic. Analysis of the tonic tone suggests that this range was too broad to represent a single acoustic target (cluster std. dev. = 1.69 * tonic), but instead, was likely some mixture of a minor and major third. To dissect this complex further, the minor third could be isolated in three ways. Performances 5, 12, and 15 lacked any pitches above 370 cents, and were thus deemed to lack a significant major third. Titon (1977, p. 155) noted that performances with this cluster appearing as a tenth usually lacked a major third; in this study, a cluster was identified from 1473.2 to 1559.1 cents (mean = 1518.3). A second cluster in this upper octave had a range of 1561.6 to 1602.6 cents (mean = 1582.0). Individual cluster analysis of performances 6 and 13 revealed a wide split in this cluster with only 3 and 4 major thirds respectively. These approaches produced 77 minor thirds in isolation with a mean of 319.1 cents and range of 256.8 to 359.1 cents. No isolation of the major third was possible in the lower octave as there was no performance with only a major third. A fine-grained histogram of all data compressed into a single octave within the range of the minor + major third is shown in figure 4. No obvious separation into two clusters is evident in this overall histogram. Similarly, a more fine-grained cluster analysis did not provide any simple clustering into two groups in the main octave.
The cluster range of 453.1 to 607.9 cents was also too broad to represent a single acoustic target (cluster std. dev. = 1.66 * tonic). A fine-grained histogram of all data compressed into a single octave is shown in figure 5. The lower portion of the range is almost certainly the perfect fourth as it is the root of the IV chord used to harmonize the blues. The upper part of this cluster range must be some form of tritone. Groupings of different performances were examined for possible subdivisions of this cluster. The only significant subdivision segregated performances with large spaces between notes beginning at 550 cents (the upper range limit of a perfect fourth). Performances 1, 2, 3, 5, 6, 7, 8, 12, 13, and 14 all exhibited an open space of at least 10 cents above 550 before the next note, suggesting the presence of a separate note above a fourth. The cluster analysis of this subset of performances is presented in Table 3.
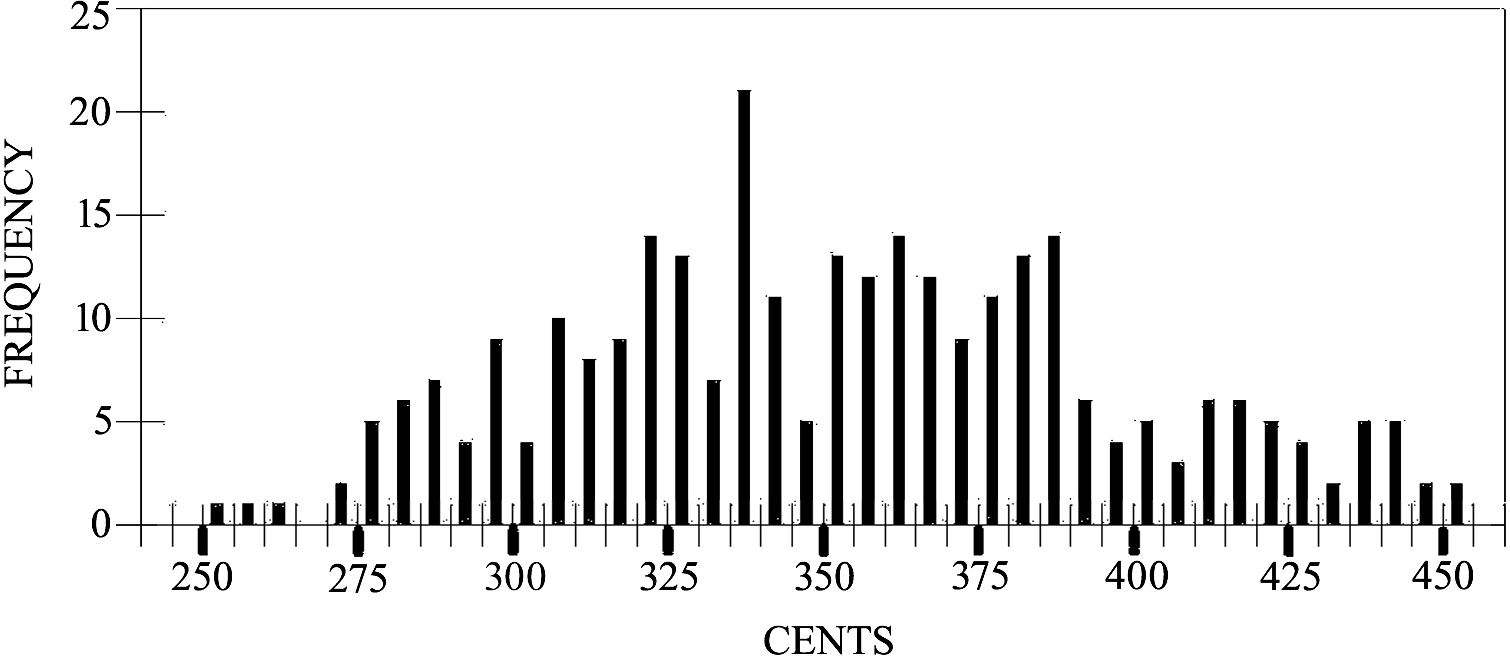
Figure 4. Data in the range of a major + minor third from the entire study compressed into a single octave.
| Range Low | Range High | Count | Mean | Median |
|---|---|---|---|---|
| 469.6 | 493.0 | 14 | 481.9 | 480.9 |
| 500.8 | 552.3 | 49 | 529.4 | 529.0 |
| 562.6 | 606.3 | 34 | 582.8 | 580.9 |
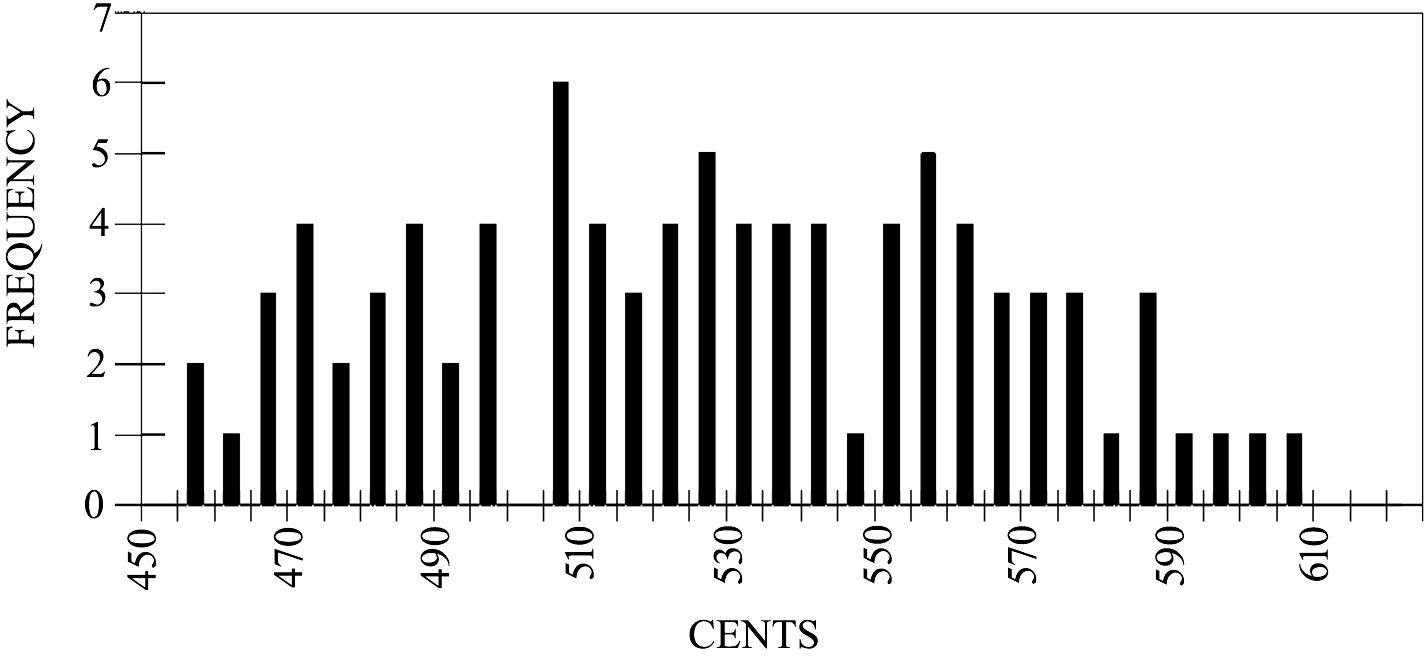
Figure 5. Fine-grained histogram of data in the range of a fourth through a tritone.
The cluster range of 618.8 to 761.6 cents (mean = 693.3) is likely the perfect fifth in isolation. The shape of this cluster in Figure 2 resembles the cluster shape of the tonic in Figure 3, except that the fifth appears to have a distribution skewed slightly toward the left.
An isolated cluster appears in the range of 917.2 to 941.0 cents (mean = 930.1), and appears to be some form of sixth. It should be noted that 13 of the 17 notes in this cluster came from a single performance: Charley Patton's "Pony blues". Several other performances added one or two notes to the range between 850 to 950 cents. James had a subcluster of 6 notes within this range (range 863.3 to 921.2 mean 890.2).
A cluster appears in the range of 964.3 to 993.1 cents (mean = 979.1). This cluster comes from performances 5, 8, 10, 13, 14, and 15, and numbers 14 notes.
A cluster in the range of 1006.7 to 1071.7 cents (mean = 1037.9) has 49 notes and was used in every performance that has a note in its range except for Wolf, whose flat seven came only from the previously discussed cluster. A cluster from -187.7 to -171.7 of 8 notes has an octave promoted mean of 1019.7 in this range.
A cluster of 14 notes from -221.1 to -194.0 cents (mean = -205.8) with an octave promotion spanned the clusters reported in the previous two paragraphs. Octave promotion does not make it clear to which of the two subgroups it should be assigned.
A cluster of 8 notes in the range of 1086.5 to 1101.3 cents (mean 1094.7) was dominated by Blind Lemon Jefferson who produced 7 of the notes. Hall produced a 3 note subcluster in this range. For this reason, this cluster should be considered idiosyncratic.
The cluster analysis process just described labelled 88 notes in this study as noise. These are of two types: 1) most were at the statistical tail of an identified cluster but weren't sufficiently dense to be counted with that cluster, and 2) subclusters that did not rise to the level of a cluster. Subclusters are important and can be appreciated visually in Figure 2. Subclusters were usually found to be idiosyncratic to specific performer(s). Sonny Boy Williamson frequently used a major second (12 notes range 183.4 to 244.5 cents, mean = 210.3) and was the only artist to do so. A number of notes in the range of a major ninth were produced in the upper octave by Hall and James, but these did not rise to the level of a cluster. Of interest neither Hall nor James produced a major second. Notes surrounding the perfect fourth can be seen in the upper octave.
DISCUSSION
Comparisons with Previous Empirical Work
Empirical measurement of note pitch in the early blues scale has been reported previously using several approaches. Titon (1977, p. 155, Figure 46) performed an analysis of 48 early blues performances by ear and presented results in a quasi-histogram, using up and down arrows to denote microtonal deviations from 12 tet. His histogram is remarkably similar to the numerically derived visualization in Figure 2 with two exceptions: Titon's natural sixth appears more frequently and his tritone is seen to fuse with the fifth, while in the current study the tritone clusters with the fourth, and the fifth appears in an independent cluster.
A novel heuristic method for measuring the microtonal characteristics of blue notes in a Robert Johnson recording has been reported by Monzo (1998). While the method used is not described in detail, it appears that blue notes were matched by ear to synthesized MIDI pitch bend data. The level of pitch bend for the blue notes was then converted into cents format and a blue note microtonal chart generated. Monzo reported that Johnson's blue notes correspond to just intonation with a major third at 5/4, the tritone at multiple levels including 11/8, and the flat seventh at both 7/4 and 9/5. Multiple other notes were identified in the performance, including a variety of sixths and several major sevenths.
Monzo's work was extended by Hayashi, Bachelder and Nakajima (2014), who used voice analysis software to extract the primary vocal frequency of the first chorus of "Me and the Devil Blues" by Robert Johnson, and presented an equal temperament transcription with microtonal deviations reported in cents. The software appears to force all tonics to zero cents and individual notes to relatively discrete values at approximately one fourth to one third of a semitone. Calibration and measurement precision details are not provided by the authors or the manufacturers of the software (VoiceBase Development Team, 2010).
Cluster Analysis
The principal tool used in evaluating the pitch data collected was cluster analysis. This is one of the algorithms derived from the mathematics of probability which is finding increasing use in music theory (Temperley, 2007). K-means clustering is the algorithm most commonly used (Ellis et al., 2016; Samplaski, 2000; Savage & Brown, 2014; Temperley & de Clerq, 2013); this algorithm has the disadvantage that it requires the investigator to specify the number of clusters a priori, but has the advantage that it will yield a result even with sparse data, by forcing the data into the desired number of clusters. A further disadvantage is that its random initial seeding can produce slightly different results on different runs. With heavily populated data, more sophisticated clustering algorithms based on data density, such as OPTICS and DBSCAN, can be applied (Everitt, 2011). Clusters are determined entirely automatically based on minimum cluster density criteria, greatly reducing the potential for investigator bias. The DBSCAN algorithm used in this study (Schubert et al., 2017) won the coveted "Test of Time Award" from the data mining community (KDD, 2014).
Tonic Tone
The distribution of the tonic tone resembled the normal distribution of probability theory (see Figure 3). Given the lack of nearby tones in the blues, its distribution represents the artists' attempt to produce a single mentally projected auditory target. The feedback loop between the ear and larynx dictate the outcome (Burns, 1999, pp. 245-6). The just noticeable difference studies in human pitch perception suggest that a singer will be unable to detect an error that is within a range of 5 to 25 cents depending on test conditions, pitch, and level of musical experience (Burns, 1999; Burns & Campbell, 1994; Burns & Ward, 1978; Geringer & Worthy, 1999; Houtsma, 1968; McDermott, Keebler, Micheyl, & Oxenham, 2010; Warrier & Zatorre, 2002; Zarate, Ritson, & Poeppel, 2012). This would lead one to expect a probability distribution spanning both sides of this radius based only on auditory perception. Imperfections in laryngeal ability to produce the desired tone may lead the singer to accept a less than logarithmic falloff in the tonic tone produced, once the auditory threshold has been exceeded. The least precise singer in this sample was Ledbetter with a standard deviation of 38.96 cents, and the most precise was Hall #3 with a standard deviation of 16.36 cents. The high level of variability seen in this single target vocal data argues strongly for the use of statistical tools such as cluster analysis in the pursuit of mentally projected auditory targets.
Perfect Fourth and Fifth
The perfect fifth and fourth are clearly a part of the blues scale in every performance in this study, except for number 15 where notes in this range were not present. The fifth appears in its own isolated cluster with a mean of 693.3 cents. The distribution of the fifth skews slightly to the left revealing a tendency to flatten it slightly. The fourth appears as part of a broad cluster from 453.1 to 607.9 cents (a cluster subset from this range appears in Table 3). The lower pair clearly span a fourth. There is a seven cent gap between these two subclusters; this may be due to the vagaries of statistical sampling. The author can offer no plausible explanation for this gap. Burns (1999, p. 249) has noted that musical scales from most world cultures usually contain notes a perfect fifth above and below the root of the scale.
Idiosyncratic Notes
This study identified note groups that were idiosyncratic to individual performer(s), but were not universal. Williamson was the only artist to use notes in the range of a major second, whereas Jefferson and Hall were the only artists to use notes a half step below the tonic. An upper octave subcluster in the range of a major ninth was produced by Hall and James. A 17 note cluster was found in the range of a major sixth; thirteen of these notes came from a single performance: "Pony Blues" by Charley Patton. The performance by James used six notes below and within this cluster. Several other artists used 1-2 notes within the range of a major sixth. These findings contrast with those of Titon (1977), who found the sixth to commonly occur in the blues scale. One possible explanation is in the difference between the artist populations studied. Performers in this study were chosen from what Titon (1977, p. xvi-xvii), Cohen (2008) and Kubik (2008, p. 14) referred to as the "kernel Mississippi Delta" or "Deep South" style. Titon's study included piano blues and songs with more folk and Vaudeville influence where a major sixth would be more likely. Another explanation may be the methodology used in this study; Titon notes that the sixth principally functions as a passing tone (1977, p. 160), and thus may have been under represented due to the sustained note requirement for inclusion in this study. A major third was found so frequently in this study it should be considered an integral part of the blues scale as suggested by Titon (1977). The variable inclusion of idiosyncratic notes with a universal blues base results in a number of different blues scales as suggested by Evans (1982, p. 24).
Three Blue Notes
The remaining clusters conform to what ethnomusicologists Titon (1977) and Evans (1982) refer to as the three principal "blue notes". Titon called these clusters the 3, 5, and ♭7 "complexes", as he found them to be microtonal in character and were clearly broader than a single note; David Evans (1982) described these as "tonal areas". Music theorist Peter van der Merwe (1989) embraced the notion of a neutral third and created a "ladder of thirds", which roughly corresponds to the three blue note complexes described by Titon. In this study, Titon's 3 complex likely appears in Figure 4, the 5 complex in Figure 5, and the ♭7 complex by blending together the three independent clusters found in this study from 964.3 to 1071.7 cents.
Music theorists van der Merwe (1989), Kubik (1999, 2005, 2008), and Curry (2015, 2017) propose that the three blue notes are ranges surrounding acoustic targets of just intonation derived from the harmonic series. This study largely confirms this overarching hypothesis. The flat three isolated in this study had a mean of 319.1 cents which is quite close to the just intonation minor third 6/5 = 315.6 cents. The flat five isolated herein in Table 3 had a mean of 582.8 cents which is nearly just intonation 7/5 = 582.5 cents. The flat seven was identified in three separate clusters; mean 979.1 near 7/4 = 968.8 cents, mean 1037.9 cents near 9/5 = 1017.6 cents, and -205.8 cents which is likely either 12 tet or a blend of the previous two. The flat seven at 1037.9 cents, with its promoted low octave cluster at 1018.7 cents is five times more common than either of the other two. The most thorough theoretical discourse on the blues scale is provided by Gerhard Kubik (2008), whose extensive study of the music systems of Africa reveals that they are usually derived directly from the harmonic series, completely devoid of European 12 tet origin. Kubik (1999, 2005, 2008) and Oliver (1970) make the case that the blues scale is of African origin, forced into a compromise with the 12 tone equal temperament system. Van der Merwe's (1989) "neutral third" from 300-350 cents encloses the ♭3 cluster isolated in this study. Kubik's 11th harmonic tritone (2008, p. 34 & 42) is at the center of the ♭5 complex in Figure 5. All three authors suggest that the blue ♭7 is the seventh harmonic (968.8 cents). While an isolated cluster was found containing this note, it represents only a fifth of the ♭7 notes. More frequent was the ♭7 cluster found at mean 1037.9 cents. While Kubik (2008, p. 29) provides one explanation for this note, it seems the just intonation ratio of 9/5 = 1017.6 cents is more likely.
New Blue Note Conception
One explanation of the blue notes is derived from the observation that the likely just intonation ratios of blue notes isolated in this study (i.e. 6/5, 7/5, and 9/5) share a common denominator. A simple representation of the "blue note chord" would be the harmonic half diminished seventh chord (i.e. 1, ♭3, ♭5, ♭7) (Wright, 2009), with integer multiples of 5:6:7:9 (audio example in the Appendix). This is the next chord up in the harmonic series from the harmonic dominant seventh chord with integer multiples 4:5:6:7 commonly heard in barbershop quartet harmony (Averill, 2003). Curry (2015) and Henry (2000) discuss in detail the close relationship of the blues to barbershop quartet harmony, which is also likely of African American origin (Abbott, 1992). The half diminished seventh chord is frequently heard in barbershop quartet arrangements as a rootless dominant ninth chord (Barbershop Harmony Society, 1980; Krumbholz, 2015; personal communication, May 1, 2017).
The "Neutral" Third and Tritone
The broad cluster from 267.7 to 448.0 cents represents some form of blend between major and minor thirds. Its cluster standard deviation is 1.69 times that of the tonic strongly suggesting the presence of two blended targets. Temperley, Ren and Duan (2017) describe this as a music with a "mediant mixture" third. These authors further go on to describe a "neutral" or "blue note" third as a blending between the two. It has long been observed that the blues artist frequently slurs between major and minor thirds (Jones, 1951; Kubik, 1999, 2005, 2008; Niles, 1972; Stoia, 2010; von Hornbostel (as cited in Kubik, 2008, p. 16); Weisethaunet, 2001). Temperley et al. (2017) postulate that the distributions of two distinct auditory targets (like Figure 3) separated by a half step should have an additive overlap between tones, but the resultant curve should present as two peaks with a definite "valley" between them, if the two notes were sung as independent vocal projections. Examination of the histogram in Figure 4 suggests no such valley; for this reason, it seems reasonable to conclude that the "neutral" third is present in the blues.
A similar blending can be seen between the fourth and the tritone in Figure 5 (cluster std. dev. = 1.66 * tonic). Isolation of the tritone in this study suggests it is likely just intonation 7/5 = 582.5 cents. Kubik (2008, p. 34 & 42) makes a strong case that the eleventh harmonic (11/8 = 551.3 cents) may represent the "blue tritone". It is possible that 11/8 and 7/5 combined with the perfect fourth (i.e. 4/3) account for the broad cluster from 453.1 to 607.9 cents found in this study. It may also represent a "neutral" blend between two extremes as discussed in the previous paragraph. Data from this study do not resolve this ambiguity.
Two Forms of the Blue Flat Seven
Titon (1977) and Evans (1982) describe a broad, flat seven blue note "complex" or "tonal area". It is likely that accumulating the three ♭7 clusters identified in this study would account for these observations. It is serendipitous that two just intonation ♭7 clusters (7/4 and 9/5) appear in the principal octave in this study, with 7/4 (968.8 cents) being five times less frequent than 9/5 (1017.6 cents). In the less populated octave below the tonic they may be clustering together to average at the 12 tet ♭7 (-200 cents).
CONCLUSION
Computer aided measurement of sustained note frequencies, with conversion to logarithmic pitch representation (cents) referenced to the tonic, was used to study 1,101 notes from 15 classic blues performances. Cluster analysis was used to identify note groups. When note clusters were broader than a single acoustic target suggested by the tonic distribution, rational subsetting was performed to identify individual note targets within the broader cluster.
Data from this study suggest that the early blues scale may be characterized by a root, fourth and fifth, three broad "blue note" clusters, as well as several idiosyncratic notes in the range of a major second, major third, major sixth, and major seventh. Subsetting and clustering further dissected the three "blue note" clusters identifying individual note targets; these targets are most likely the just intonation minor third (319.1 ≈ 6/5 = 315.6 cents), tritone (582.8 ≈ 7/5 = 582.5 cents), and two forms of a minor seventh (most common 1037.9 ≈ 9/5 = 1017.8 cents, and 979.1 ≈ 7/4 = 968.8 cents). Just intonation blue note targets have been predicted previously by music theorists/ethnomusicologists van der Merwe (1989), Kubik (1999, 2005, 2008) and Curry (2015, 2017). The common denominator of these frequency ratios suggests the "blue note chord" may be represented as the harmonic half diminished seventh chord (Wright, 2009), with integer multiples 5:6:7:9.
The broad blue note clusters found in this study correspond to the three blue note "complexes" (3, 5, & ♭7) identified by ear by Titon (1977) as microtonal blends. Data from this study suggest that Titon's blue 3 complex is a blend of a just intonation minor third and some form of a major third. While the former could be isolated and characterized in this study, the latter could not. Examination of the histogram suggest that this cluster is not simply two separate notes but also contains numerous "neutral" or "blue note" thirds spanning the interspace between two peaks. This study also identified a broad cluster spanning the range of a fourth and a just intonation tritone (7/5 = 582.5 cents). Examination of the histogram does not suggest the presence of two individual distributions; this may be due to the presence of the eleventh harmonic (11/8 = 551.3 cents) as suggested by Kubik (2008), or simply a "neutral" tritone similar to the neutral third. Titon's ♭7 complex likely represents a combination of the three separate clusters in the range of the minor seventh found in this study.
ACKNOWLEDGEMENTS
The author wishes to thank R. Kim Collins, director of the Santa Barbara Jazz Workshop, for his focus on the importance of the blues in contemporary jazz and for his suggestions regarding barbershop quartet as an exemplar of just intonation. Thanks also to Jay Krumbholz PhD, for his clarifications on the use of the rootless dominant ninth chord in barbershop quartet arrangement. This article was copyedited by Scott Bannister and layout edited by Kelly Jakubowski.
NOTES
- Correspondence can be addressed by email to: Court Cutting at ccuttingmd@gmail.com
Return to Text
REFERENCES
- Abbott, L. (1992). Play that barber shop chord: A case for the African-American origin of barbershop harmony. American Music 10(3), 289-325. https://doi.org/10.2307/3051597
- Audacity Team. (2014). Audacity(R): Free Audio Editor and Recorder (Version 2.1.3) [Software]. Available from https://sourceforge.net/projects/audacity/
- Averill, G. (2003). Four parts, no waiting: A social history of American barbershop harmony. Oxford, UK: Oxford University Press. https://doi.org/10.1093/acprof:oso/9780195116724.001.0001
- Baker, J. (1933). Black Betty [Recorded by H. Ledbetter]. On Lead Belly - Negro Sinful Songs [78 rpm]. New York, NY: Musicraft - Album 31. (1939). URL: https://www.youtube.com/watch?v=sYrK464nIeY
- Barbershop Harmony Society. (1980). Barbershop Arranging Manual – Definition of barbershop harmony: ninth chords (p 18). Kenosha, WI: Society for the Preservation and Encouragement of Barbershop Quartet Singing in America Inc. Available from https://github.com/raficus/Arr-Manual/blob/master/Original.pdf
- Benward, B., & Saker, M. (2003). Music: In theory and practice, Seventh Edition Volume I (p.359). Columbus, OH: McGraw Hill.
- Burnett, C. (1951). Smokestack lightnin'. On Howlin' Wolf - Moanin in the Moonlight [33 1/3 rpm]. Chess LP 1434. (1962). URL: https://www.youtube.com/watch?v=9Ri7TcukAJ8
- Burns, E. (1999). Intervals, scales, and tuning. In D. Deutsch (Ed.) The psychology of music (pp. 216-64). San Diego, CA: Academic Press. https://doi.org/10.1016/B978-012213564-4/50008-1
- Burns, E. M., & Campbell, S. L. (1994). Frequency and frequency-ratio resolution by possessors of absolute and relative pitch: Examples of categorical perception. Journal of the Acoustical Society of America, 96, 2704-19. https://doi.org/10.1121/1.411447
- Burns, E. M., & Ward, W. D. (1978). Categorical perception--phenomenon or epiphenomenon: Evidence from experiments in the perception of melodic musical intervals. Journal of the Acoustical Society of America, 63(2), 456-68. https://doi.org/10.1121/1.381737
- Cakewalk Team. (2016). Dimension Pro: Microtonal capable software synthesizer (Version 1.2) [Software]. Available from https://www.cakewalk.com/Support/Knowledge-Base/2005302/Dimension-Pro-1-2-update
- Cohen, A. (2008). The hands of blues guitarists. In D. Evans (Ed.), Ramblin' on my mind: New perspectives on the blues (pp. 152-178). Urbana, IL: University of Illinois Press.
- Curry, B. (2015). Blues music theory and the songs of Robert Johnson: Ladder, level and chromatic cycle. Popular Music, 34, 245-73. https://doi.org/10.1017/S0261143015000276
- Curry, B. (2017). Two approaches to tonal space in the music of Muddy Waters. Music Analysis 36(1), 37-58. https://doi.org/10.1111/musa.12084
- de Coul, M. O. (2001). Scala: Microtonal file format. [Computer file format description]. Retrieved from http://www.huygens-fokker.org/scala/scl_format.html
- Doll, C. (2009). Transformation in rock harmony: An explanatory strategy. Gamut, 2, 1-44. https://doi.org/10.7282/T31J9CD8
- Ellis, A., & Hipkins, A. (1884). Tonometrical observations on some existing non-harmonic musical scales. Proceedings of the Royal Society of London, 37(232-234), 368-385. https://doi.org/10.1098/rspl.1884.0041
- Ellis, B., Hwang, H., Savage, P., Pan, B. Y., Cohen, A., & Brown, S. (2016). Identifying style-types in a sample of musical improvisations using dimensional reduction and cluster analysis. Psychology of Aesthetics, Creativity, and the Arts, 12(1), 110-122. https://doi.org/10.1037/aca0000072
- Evans, D. (1982). Big road blues: Tradition and creativity in the folk blues. Berkeley, CA: University of California Press.
- Everitt, B. (2011). Cluster analysis. Chichester, West Sussex, U.K: Wiley. https://doi.org/10.1002/9780470977811
- Ford, A. (1951). Mighty long time. On Sonny Boy Williamson - King Biscuit Time [CD]. Washington, D.C.: Arhoolie CD 310. (1989). URL: https://www.youtube.com/watch?v=RskDf5jqcIw
- Geringer, J. M., & Worthy, M. D. (1999). Effects of tone-quality changes on intonation and tone-quality ratings of high school and college instrumentalists. Journal of Research in Music Education. 47(2), 135-149. https://doi.org/10.2307/3345719
- Gioia, T. (2008). Delta blues: The life and times of the Mississippi masters who revolutionized American music. New York, NY: W. W. Norton & Co.
- Hall, V. (1937). Trouble so hard. On Southern Folk Heritage Series; field recordings by Alan Lomax [33 1/3 rpm]. Los Angeles, CA: Atlantic Records SD 1346. (1960). URL: https://www.youtube.com/watch?v=r9SENzRLk_M
- Hall, V. (1940). Another man done gone. On Field Recordings Vol.4 Mississippi & Alabama 1934-=1942; field recordings by Alan Lomax [ 33 1/3 rpm]. Bladnoch, Newton Stewart, UK: Document Records DODC-5578. (1960). URL: https://www.youtube.com/watch?v=749523cHwyc
- Hayashi, M., Bachelder, S., Nakajima, M. (2014). Microtone Analysis of Blues Vocal: Can Hatsune-Miku sing the Blues? Paper presented at NICOGRAPH International 2014. Retrieved at: https://uu.diva-portal.org/smash/get/diva2:756608/FULLTEXT01.pdf
- Henry, J. (2000). The origins of barbershop harmony: a study of barbershop's musical links to other African-American musics as evidenced through recordings and arrangements of early black and white quartets (Doctoral dissertation), Washington University, St. Louis, MO. Retrieved from WorldCat.org (OCLC number: 52893209)
- Hooker, J. L. (1948). Sallie Mae. On John Lee Hooker - The Ultimate Collection (1948-1990) [33 1/3 rpm]. Burbank, CA: Rhino Entertainment R2 70572. (1991). URL: https://www.youtube.com/watch?v=7AS-Rbu-XJs
- House, S. (1930). County farm blues. On Son House and JD Short - Delta Blues [33 1/3 rpm]. Washington, DC: Folkways FTS 31028. (1968). URL: https://www.youtube.com/watch?v=QggIz0JxmGE
- House, S. (1965). Grinnin in your face. On Son House -Father of Folk Blues [ 33 1/3 rpm]. New York, NY: Columbia CL 2417. URL: https://www.youtube.com/watch?v=QA8-ZOuKetU
- Houtsma, A. J. (1968). Discrimination of frequency ratios. Journal of the Acoustical Society of America, 44, p. 383. https://doi.org/10.1121/1.1970636
- James, S. (1931). Hard time killin' floor blues. On Skip James - The Complete Early Recordings 1930 [CD]. New York, NY: Yazoo 2009. (1994). URL: https://www.youtube.com/watch?v=UNftrsCMiQs
- Jefferson, B. L. (1927). See that my grave is kept clean. On Blind Lemon Jefferson - See that my grave is kept clean [33 1/3 rpm]. Firenze, Italy: Monk MK 330LP. (2010). URL: https://www.youtube.com/watch?v=zXMhnYNzWaM
- Johnson, R. (1936). Kind hearted woman blues. On Robert Johnson - The Complete Recordings [33 1/3 rpm]. New York, NY: Columbia C2K 46222. (1990). URL: https://www.youtube.com/watch?v=82yNxiF-T4A
- Jones, A. M. (1951). Blue notes and hot rhythm. African Music Society Newsletter, 1(4), 9-12. Stable URL: http://www.jstor.org/stable/30250364
- KDD. (2014). Assoc. for Computing Machinery - SIGKDD Test of Time Award: A Density-Based Algorithm for Discovering Clusters in Large Spatial Databases with Noise [KDD 1996] [ACM award]. Retrieved from http://www.kdd.org/News/view/2014-sigkdd-test-of-time-award
- Krumbholz, G. (2015). 9th chords. Retrieved from https://apps.spokane.edu/InternetContent/AutoWebs/geraldk/9th%20chords.pdf
- Kubik, G. (1999). Africa and the Blues. Jackson, MS: University of Mississippi Press.
- Kubik, G. (2005). The African matrix in jazz harmonic practices. Black Music Research Journal, 25(1), 167-222. Stable URL: http://www.jstor.org/stable/30039290
- Kubik, G. (2008). Bourdon, blue notes, and pentatonicism in the blues: An Africanist perspective. In D. Evans (Ed.), Ramblin' on my mind: New perspectives on the blues (pp. 11-48). Urbana, IL: University of Illinois Press.
- Kubik, G. (2010). Theory of African Music: Volumes I & II. Chicago, IL: University of Chicago Press.
- Levine, M. (1995). The Jazz Theory Book. Petaluma, CA: Sher Music.
- Lomax, A. (1933). The Lomax family collection at the American folklife center. United States National Library of Congress. Retrieved from https://www.loc.gov/folklife/lomax/alanlomaxcollection.html
- McClary, S. (2001). Conventional wisdom: The content of musical form. Oakland, CA: University of California Press.
- McDermott, J., Keebler, M., Micheyl, C., & Oxenham, A. (2010). Musical intervals and relative pitch: Frequency resolution, not interval resolution, is special. Journal of the Acoustical Society of America, 128(4), 1943-1951. https://doi.org/10.1121/1.3478785
- Monzo, J. (1998). A microtonal analysis of Robert Johnson's "Drunken Hearted Man". Retrieved from http://tonalsoft.com/monzo/rjohnson/drunken.aspx
- Niles, A. (1972) [1926]. Introduction and notes. In W. C. Handy (Ed.), Blues: An anthology (pp. 27-28). New York, NY: Macmillan Company.
- Oliver, P. (1970). Savannah syncopators: African retentions in the blues. London, UK: Studio Vista.
- Open Source Initiative. (1998). The MIT license. [Computer program license]. Retrieved from https://opensource.org/licenses/MIT
- Patton, C. (1929a). Down The Dirt Road Blues. On Charley Patton - Complete Recorded Works, Vol. 1 (1929) [33 1/3 rpm]. Bladnoch, Newton Stewart, UK: Document Records DOCD-5009. (2000). URL: https://www.youtube.com/watch?v=kxO2752Zt7A
- Patton, C. (1929b). Pony Blues. On Charley Patton - Complete Recorded Works, Vol. 1 (1929) [33 1/3 rpm]. Bladnoch, Newton Stewart, UK: Document Records DOCD-5009. (2000). URL: https://www.youtube.com/watch?v=zoKKJjf-oQA
- Petway, R. (1941). Catfish blues [Recorded by David "Honeyboy" Edwards]. On Original David Honeyboy Edwards - Mississippi Delta Bluesman [33 1/3 rpm]. Washington, DC: Smithsonian Folkways FS 3539. (1979). URL: https://www.youtube.com/watch?v=t4m4oQHADTM
- Ramirez, R. W. (1985). The FFT; Fundamentals and Concepts, Englewood Cliffs, NJ: Prentice-Hall.
- Samplaski, A. (2000). A Comparison of Perceived Chord Similarity and Predictions of Selected Twentieth-Century Chord-Classification Schemes, Using Multidimensional Scaling and Cluster Analysis (Doctoral dissertation), Indiana University, Bloomington, IN. Retrieved from WorldCat.org (OCLC number: 45440385)
- Savage, P., & Brown, S. (2014). Mapping music: Cluster analysis of song-type frequencies within and between cultures. Ethnomusicology, 58(1), 133-155. https://doi.org/10.5406/ethnomusicology.58.1.0133
- Schubert, E., Sander, J., Ester, M., Kriegel, HP., & Xu, X. (2017). DBSCAN Revisited, Revisited: Why and How You Should (Still) Use DBSCAN. ACM Trans. Database Syst. 42 (3), 1-21. https://doi.org/10.1145/3068335
- Stoia, Nicholas. (2010). Mode, harmony, and dissonance treatment in American folk and popular music, c. 1920-1945. Music Theory Online, 16 (3). Retrieved from http://www.mtosmt.org/issues/mto.10.16.3/mto.10.16.3.stoia.html
- Temperley, D. (2007). Music and probability. Cambridge, MA: MIT Press.
- Temperley, D., & de Clercq, T. (2013). Statistical analysis of harmony and melody in rock music. Journal of New Music Research, 42, 187-204. https://doi.org/10.1080/09298215.2013.788039
- Temperley, D., Ren, I., & Duan, Z. (2017). Mediant mixture and "blue notes" in rock: An exploratory study. Music Theory Online, 23 (1). Retrieved from http://mtosmt.org/issues/mto.17.23.1/mto.17.23.1.temperley.html
- Titon, J. T. (1977). Early downhome blues: A musical and cultural analysis. Chicago, IL: University of Illinois Press.
- Van der Merwe, P. (1989). Origins of the popular style - the antecedents of twentieth-century popular music. New York, NY: Oxford University Press.
- VoiceBase Development Team. (2010). Version 3 API Docs. Retrieved at: https://voicebase.readthedocs.io/en/v3/how-to-guides/voice-features.html?highlight=frequency
- Warrier, C. M., & Zatorre, R. J. (2002). Influence of tonal context and timbral variation on perception of pitch. Attention, Perception & Psychophysics, 64 (2), 198-207. https://doi.org/10.3758/BF03195786
- Weisethaunet, H. (2001). Is there such a thing as the "blue note"? Popular Music, 20(1), 99-116. https://doi.org/10.1017/S0261143001001337
- Williams, J. (1935). Baby please don't go [Recorded by Lightnin Hopkins]. On Lightnin' Hopkins- Rare Performances 1960-1979 [DVD]. Sparta, NJ: Vestapol 13022. (2014). URL: https://www.youtube.com/watch?v=lK5zYI86wIw
- Wright, D. (2009). Mathematics and Music - Chapter 11: Rational numbers as intervals (pp 131-132). Washington, DC: American Mathematical Society. https://doi.org/10.1090/mawrld/028
- Yaikhom, G. (2012). The DBSCAN clustering algorithm. (Version 1.0)[Computer program]. Available from https://github.com/gyaikhom/dbscan
- Zarate, J. M., Ritson, C. R., & Poeppel, D. (2012). Pitch-interval discrimination and musical expertise: Is the semitone a perceptual boundary? Journal of the Acoustical Society of America, 132(2), 984-993. https://doi.org/10.1121/1.4733535
APPENDIX
An audio file of a just intonation hexatonic blues scale suggested by the cluster means of the principal blues notes isolated in this study can be heard in: BluesScale_5thHarmonicRoot.mp3 (available at: http://hdl.handle.net/1811/86952)
This audio demonstration file was prepared using a microtonally capable synthesizer (Cakewalk, 2016) and a custom Scala microtonal description file (de Coul, 2001). The audio begins with an arpeggio of the harmonic half diminished seventh chord (Wright, 2009) with frequency multiples 5:6:7:9:10 on a C3 root. The second arpeggio heard adds a perfect fourth and perfect fifth above C3 to the previous arpeggio creating a just intonation hexatonic blues scale. This scale closely approximates the cluster means of the notes isolated in this study.
Source code for the cluster analysis program used in this study is provided in the 2 files dbScan1D.cpp & dbScan1D.h (available at: http://hdl.handle.net/1811/86952). This is a unidimensional variant of the DBSCAN algorithm originally written by Gagarine Yaikhom (2012) in the C language. It has been implemented as a C++ class for modular use by the author. This program is open source software available to the reader for any purpose under an MIT open source license (Open Source Initiative, 1998) as was Yaikhom's original code.
Return to Top of Page
