Introduction
Ohriner's (2014) experiment aims to elucidate musicians' perception of expressively timed piano performances by employing a tapping paradigm in which music undergraduates tapped 9 times to 6 different performances of two excerpts from Chopin Mazurkas. As some of the musical performances were explicitly selected to represent interpretations that are maximally different from an average of several performances, tapping to those idiosyncratic renditions poses high demands to the music undergraduates. This uncertainty is reflected in the quality of the tapping data containing quite different numbers of taps per trial than to be expected from the stimuli. To overcome these frequent missing data and some added taps, Ohriner introduces a complex (and not easily reproducible) way of condensing individual taps of repeated trials to one clustered and averaged tap sequence. These averaged tap sequences per participant and performance are analyzed, and over the course of the paper, exemplary parts of this data are presented and discussed in relation to a thorough structural analysis of the two excerpts. The graphical means to present performance and tapping data in combination with musical notation are novel and also beautiful (particularly Figures 2, 5, and 11) and reflect a careful examination of the data.
The introductory overview discusses also two empirical tapping studies involving expressive music, namely one by Bruno Repp (2002) where he found musically trained tappers to exhibit a tracking behavior when confronted with unknown music (reflected in higher lag-1 cross correlations of inter-tap intervals than lag-0 cross correlations) which developed more into a predictive behavior after repeated tapping to the same music material (reflected in higher lag-0 cross correlations). The other study is by Dixon, Goebl, and Cambouropoulos (2006) who tested a "smoothed tempo perception hypothesis" in a series of experiments of which one employed a tapping paradigm. The authors showed that musicians tend to produce inter-tap profiles that are somewhat smoother than the original inter-onset profiles of the musical stimulus material that they tapped to. Ohriner refers to both approaches during his analysis of the tapping data and concludes that none of them applies to his data: "…listeners place taps to create inter-tap intervals much shorter [than] previous inter-beat intervals, in contrast to Repp's model of lag-1 correlation. And the data collected in this experiment does not conform to Dixon et al.'s model of perceptual smoothing." (Ohriner 2014, page 17). However, these two hypotheses were not tested in any detail except for selectively eye-balling some exemplary data which is certainly not enough for backing such statements. As Ohriner has provided the raw tapping data and the onset data of the 6 performances, for which I want to thank him sincerely, I want to test these hypotheses briefly in the following by proposing an alternative way of analyzing and interpreting the data.
Ohriner's methodology of condensing the 9 repetitions of a participant into one stream of clustered and averaged tap onsets is problematic in several ways. He generates a histogram of tap frequency over time by sliding a 100-ms window across the tap data. Individual peaks in this multi-modal distribution are identified by a rough heuristic and manual post-correction to arrive at a sequence of averaged taps per participant for further analysis. He accepts that the number of extracted average taps may not correspond to the number of beats in the performance. This averaged tap sequence is then matched to the stimulus onsets with a dynamic time warping algorithm to be able to compute the asynchrony between them. In a last step, the DTW output is pruned and the averaged taps readjusted to the mean onsets of the taps that constituted the cluster (a step that is hard to understand). This quite complex procedure is not reproducible, because of the manual intervention in between. Furthermore, it generates an averaged sequence that does not reflect what the participants actually did. Importantly, this way of condensing the data makes it harder to test the two hypotheses mentioned above, because of the missing data in the clustered sequences.
Re-Analysis
Ohriner's data set consists of 3 performances of 2 excerpts of Chopin Mazurkas by 6 different renowned pianists. They were virtuously selected to contain two very idiosyncratic renditions (namely by Poli and by Bunin), while the others are closer to prototypical performances (by Oborin, Ogava, Chie, and Sztompka). Each participant had to tap to each of the 6 performances 9 times, thus totaling in 54 trials. The excerpts consisted of 47 and 74 onsets, respectively, so each participant had to produce (47 + 74) x 3 x 9 = 3267 taps. The tapping data as provided by Ohriner, however, contained quite some missing cells as revealed by a tabular overview of the data set: a total of 14 individual tappers tapped 18-54 trials (as mentioned by Ohriner, he had to remove quite some trials due to technical difficulties during the experiment). The three performances of the first excerpt (Op. 50 No. 1) were fully tapped by 11 participants; the second excerpt (Op. 63 No. 3) only by 6. However, cumulating all data, each performance was tapped by 10-12 (in part different) participants. Moreover did the participants produce quite different numbers of taps than beats contained in the musical stimuli. The number of taps ranged from 54.2% to 127.1% of the expected number of beats (M = 94.4%, SD = 8.5%), with more missing taps than inserted (superfluous) taps. The tap sequences contained occasional double bouncing onsets; 394 onsets that occurred within 30 ms of another onset were removed.
In order to be able to test particularly Repp's (2002) hypothesis, I propose a different way of analyzing the tapping data. Instead of matching a clustered sequence of taps, I match each individual tap sequence to the expected beat onsets of the stimuli, also using a dynamic time warping algorithm (Ellis, 2003; Turetsky & Ellis, 2003) based simply on absolute time differences between taps and performed onsets (without any restriction to a maximum asynchrony). The rationale here is that we should expect from each participant to tap a sequence close to the performed onsets and thus a perfect match could theoretically be obtained from each trial (rather than from 9 trials combined as in Ohriner's paper). The DTW output is pruned so as to remove repeated matches by keeping the match with the lowest asynchrony. The algorithm identifies successful matches, misses (where no tap could be matched for a performed onset), and insertions (where a tap could not be matched to a performed onset). The matches, misses, and insertions are displayed on individual plots of all performances and participants for careful visual inspection of obvious matching errors, of which none occurred.
The tapping data is quite incomplete: the best participant had only 17 of 54 trials matched without missing taps or insertions, while 3 participants had no single trial without a missing or inserted tap. Missing taps were far more frequent (M = 3.7, SD = 3.6, 0-22) than inserted taps (M = 0.8, SD = 1.6, 0-13), suggesting that participants tapped less often than beats present in the stimuli. (Some participants tapped on even after the piece stopped; these 880 insertions were removed prior to the analysis.) Moreover, there was no significant effect of trial, neither on the number of misses nor on the number of inserted taps, suggesting that the participants did not improve over the course of the experiment which casts doubt on the validity of the experiment. Did the participants really try to tap along with the beat of the performances, as instructed?
To demonstrate the current trial-based analysis approach and to allow direct comparison to Ohriner's clustering approach, the same excerpt of Poli's performance tapped by participant "Q" as in Ohriner's Fig. 2 is plotted in Figure 1. In the upper panel, the taps of the 9 trials are plotted as blue dots, the stimulus onsets as grey vertical lines, and the matches indicated by horizontal lines connecting the taps with the onsets. Missing taps are indicated by red open circles and inserted taps by red dots (see also legend). Below the individual trials, an averaged tap sequence is plotted in black derived from averaging the onsets of the successful matches of a given beat. The first apparent difference between this trial-based analysis and Ohriner's clustering method is at m. 73 (3rd beat of bar 7) where Ohriner is identifying a missing tap for the entire data of this participant, while the trial-based procedure provides a reasonably good tap. Both methods agree in the too early tap in m. 92, but disagree in the first two taps of m. 10 where the trial-based method outputs a late-early tap combination, while Ohriner's method a late-late. Thus, these two analysis methods come up to quite different interpretations of what a participant actually did. The more a participant tapped closely and "correctly" to a stimulus, the more the two methods converge in their results. The trial-based method tends to give complete average taps (except when there are misses for a given tap in all 9 repetitions) allowing us to further test the correlational hypotheses by Repp (2002).
The average inter-tap intervals are plotted in the lower panel of Figure 1 against the inter-onset intervals of the performance by Poli together with the clustered taps derived from Ohriner's Figure 2 (the onset values of Ohriner's clustered tap sequence were extracted from the vector-based coordinates in Ohriner's Figure 2). It is apparent in this example that the trial-wise method preserves the temporal structure of the stimulus onsets, revealing a tendency to follow the inter-onset intervals by a lag of one. On the other hand, Ohriner's clustering method, despite the missing 3rd beat, creates an even more smoothed version of what one individual tapped in individual trials to a given expressive performance. Thus, it seems, the clustering method through its clustering nature manipulates the tapping data in a way that tends to support the "smoothed tempo perception hypothesis" by Dixon et al. (2006). It would be worthwhile to analyze the entire inter-tap interval data derived through the clustering method in this regard.
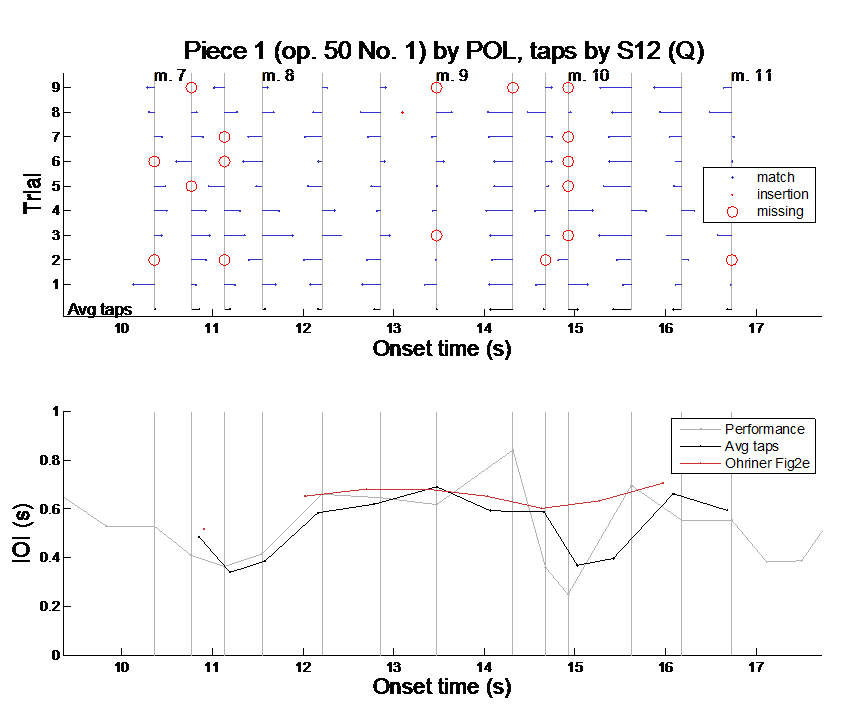
Fig. 1. Onset data of Poli's performance tapped by "Q", same excerpt as in Ohriner's (2014) Figure 2. Upper panel: Blue dots denote taps by "Q" of the 9 trials successfully matched to the onsets of Poli's performance, red open circles are missing taps, and red dots are inserted taps not matched to a performed onset. Grey vertical lines denote performed onsets by Poli. The averaged tap sequence is plotted in black below the individual taps. Lower panel: inter-onset intervals (IOI) of the performed onsets (grey), the averaged taps according to the trial-based matching method presented above, and the data from Ohriner's Figure 2 (including the missing value on m. 73).
To give an overview on the tapping data, the inter-tap interval profiles of all available participants are plotted for each of the 6 performances (Figure 2). From these overview plots, we can visually estimate the potential validity of the two hypotheses to be tested. Particularly, the tapping profiles for piece 2 seem to follow the performance with a delay of one beat, thus potentially supporting tracking observation made by Repp (2002). Also, the smoothed tempo perception hypothesis does not seem to be reflected in the data. In the following, I briefly test these two hypotheses on the basis of the tapping presented in Figure 2.
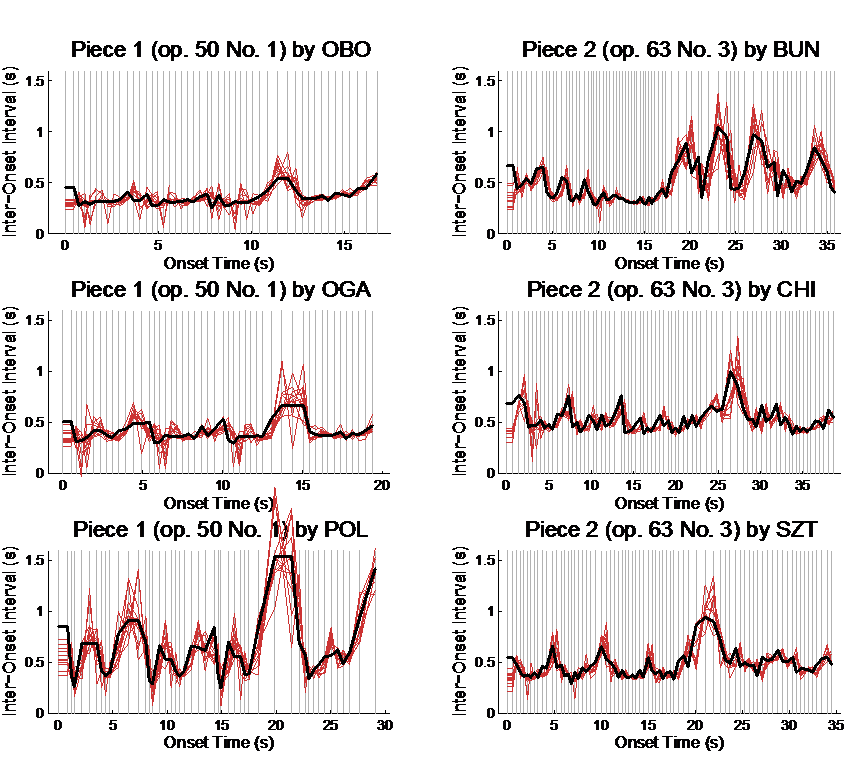
Fig. 2. Inter-tap interval profiles of individual participants (red) together with the inter-onset interval profile of a performance (black) for each of the 6 excerpts. Grey vertical lines denote performed onsets. Each first interval is doubled for the first onset so that the interval curves follow the onsets.
Each average inter-tap interval sequence was correlated with the inter-onset intervals of the stimulus sequence (the expressive performances) either with a lag of zero or a lag of 1 beat such that a tapping sequence following the stimulus sequence would result in a high correlation coefficient. Repp (2002) proposed to normalize these correlation coefficients (r0 and r1 respectively) by the lag-1 auto-correlation coefficient (ac1) to come up with a tracking index r1* = (r1 — ac1) / (1 — ac1) and a prediction index r0* = (r0 — ac1) / (1 — ac1). These indices were computed for each participant's average tap profile for the 6 performances. Figure 3 presents the average indices separately by performance and behavior (prediction versus tracking). The individual performances entail quite different overall tapping behavior by the participants: while the two first performances by Oborin and Ogava show comparably low index values, the eccentric performance by Poli features a particularly large prediction aspect. The performances of piece 2 depict large tracking indices that are far larger than the prediction indices. These findings can be verified by the raw data in Fig. 2. The larger prediction indices for the two idiosyncratic performances by Poli and Bunin may be attributed to their large variability in timing which may have dominated the correlational analyses. Thus, we find tracking behavior when the participants tapped to the performances of piece 2, but not for piece 1.
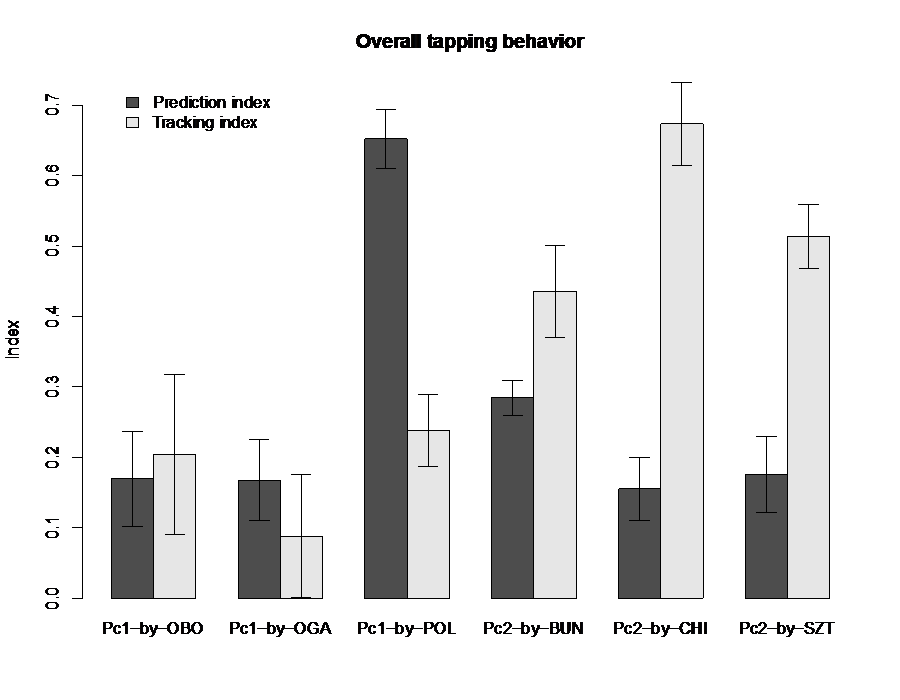
Fig. 3. Overall tapping behavior for the individual performances of the two pieces: mean prediction tracking indices across all participants. Error bars denote standard errors of the mean.
Repp (2002) additionally found that the prediction indices increased over trial. Due to the large numbers of missing taps, I compared tapping sequences averaged across the first 4 trials (1-4) with those averaged across the last 4 trials (6-9) to test a possible familiarity effect over the course of the experiment: Participants should get acquainted with a particular performance so that they could develop from tracking a novel performance to predicting a known performance. The average data is not showing decreased tracking or increased prediction across all participants. However, to demonstrate this behavior, I show the data of one participant "A" where this behavior is nicely reflected in Fig. 4. The tracking indices decrease from the first 4 trials to the last 4 trials, while the prediction indices increase in piece 1, but not in piece 2. In piece 1, this participant learns the idiosyncratic timing profiles of the pianists and is able to predict those better than in the first 4 trials. This analysis would have been more convincing, if it were performed across individual trials, as in Repp (2002), but the numerous missing values makes this analysis impossible.
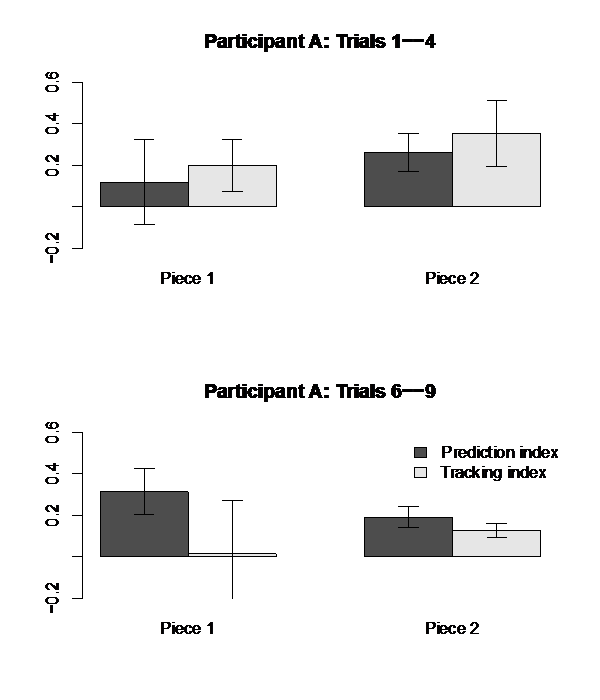
Fig. 4. Tapping behavior of participant "A": prediction and tracking indices averaged across pieces for tapping profiles averaged across trials 1-4 (top panel) and 6-9 (bottom panel).
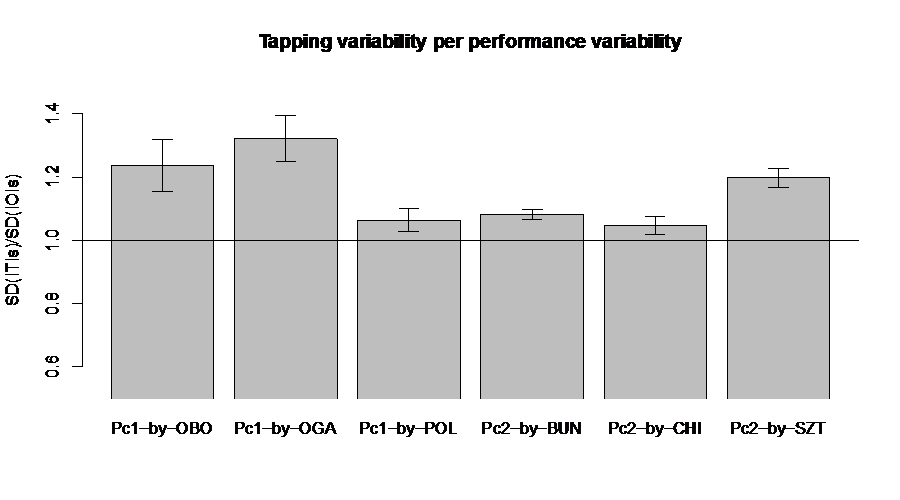
To test the smoothed tempo perception hypothesis, we analyze the temporal variability of the average taps per participant relative to the variability of the performances. These ratios are shown in Fig. 5. Values above one indicate that the taps are more variable than the performed onsets, values below the opposite. As the smoothed tempo perception hypothesis would imply values below one, we have to reject this hypothesis in the context of the current data. It is interesting to note that the two idiosyncratic performances have lower ratios than the more common ones by Oborin and Ogava.
Conclusions
Inspired by Ohriner's quantitatively unbacked claim that the hypotheses by Repp (2002) and Dixon et al. (2006) could not be supported by his tapping data, I provided a brief quantitative re-analysis of his tapping data finding support for the first by Repp, but no support for the second by Dixon et al. Using a trial-based matching procedure, averaged tap sequences without missing values were extracted from the individual trials of the participants, preserving more closely what participants did in a given trial. I demonstrated how this way of analyzing the data leads to quite different levels of results compared to Ohriner's clustering method which comes up with an even smoother rendition of what a participant did on average (compare Fig. 1 and Ohriner's Fig. 2). I speculate that with Ohriner's method, Dixon et al.'s "smoothed tempo perception hypothesis" could have received sound support; however, this still remains to be tested.
One concern in Ohriner's data is certainly the low quality of the tapping data. The frequent missing and several additional taps suggest that the participants had quite a hard time in accomplishing the experiment as instructed, either because the stimulus material was too demanding for their level of expertise (how many were classically trained pianists?) or they simply lacked concentration and focus during the task (the lack of a learning effect speaks to this). In a future experiment, efforts have to be made to match the participants' level of expertise to the demands of the stimuli and to motivate them to perform the task as focused as possible.
Two aspects mentioned by Ohriner are particularly interesting and worthwhile to be experimentally tackled in future work. One regards the positive emotional valence that an anticipated and successfully accomplished tap generates in participants (Huron, 2006) or vice versa a negative valence arising from a failure to do so. A future experimental protocol should include an experimental variable assessing the extent to which participants were satisfied with a given tapping trial, which then could be related to measures of synchronization. The other regards Ohriner's assumption that a late tap has "a different and more severe affective consequence" than an early tap (Ohriner 2014, p. 4 ), because tapping early can only be evaluated when the actual (later) stimulus event occurs, but tapping late becomes already clear when the (earlier) stimulus event had occurred, even before the tap is executed. This "early—late asymmetry" might even be considered in the discourse on the mean negative asynchrony usually found in tapping paradigms (Repp, 2005). Thus, tappers may prefer to be ahead of the stimulus to have the evaluation of their actions after their taps rather than ahead. However, this asymmetry assumption should be empirically tested in future work.
To conclude, listener-performer synchronicity in expressively performed music is certainly determined by more complex mechanisms than simply described by a lag-1 tracking hypothesis or a smoothed tempo perception hypothesis, as Ohriner states. However, these processes do not necessarily be mutually exclusive and may be present despite more high-level behavior determined by the complexities of the musical structure and diverse performed interpretations thereof. Combining theories from sensori-motor synchronization with knowledge and scholarship from music theory to explain the perception of highly expressively performed music promises a rich strand of empirical work to be accomplished in the future.
ACKNOWLEDGEMENTS
The author acknowledges support by the Austria Science Fund (FWF P24546).
END NOTES
- Address of correspondence. Werner Goebl, Institute of Music Acoustics, University of Music and Performing Arts Vienna, Anton-von-Webern-Platz 1, 1030 Vienna, Austria, goebl@mdw.ac.at
Return to Text
REFERENCES
- Dixon, S., Goebl, W., & Cambouropoulos, E. (2006). Perceptual smoothness of tempo in expressively performed music. Music Perception, 23(3), 195-214. doi: 10.1525/mp.2006.23.3.195
- Ellis, D. (2003). Dynamic Time Warp (DTW) in Matlab Retrieved 25-Sept-2014, from http://www.ee.columbia.edu/~dpwe/resources/matlab/dtw/
- Huron, D. B. (2006). Sweet Anticipation: Music and the Psychology of Expectation. Cambridge, MA: MIT Press.
- Ohriner, M. (2014). Listener-performer synchronicity in recorded performances of Chopin's Mazurkas. Empirical Musicology Review, current volume.
- Repp, B. H. (2002). The embodiment of musical structure: effects of musical context on sensorimotor synchronization with complex timing patterns. In W. Prinz & B. Hommel (Eds.), Common mechanisms in perception and action: attention and performance (Vol. XIX, pp. 245-265). Oxford, UK: Oxford University Press.
- Repp, B. H. (2005). Sensorimotor synchronization: A review of the tapping literature. Psychonomic Bulletin and Review, 12(6), 969-992.
- Turetsky, R., & Ellis, D. (2003). Ground-Truth Transcriptions of Real Music from Force-Aligned MIDI Syntheses 4th International Conference on Music Information Retrieval (pp. 135-141).

