
INTRODUCTION
ECHOING the words of Farbood (2012), the phenomenon of tension is key to the listening experience and can be informally described in qualitative terms: increasing tension as the feeling of "rising intensity" or "impending climax and decreasing tension as relaxation or resolution.
Understanding how one perceives musical tension can vary significantly depending on the readers' lens, a music-theoretical or psychological perspective. On the one hand, Bigand, Parncutt and Lerdahl state that musical tension from a purely theoretical perspective can be generally explained by a few variables, such as the function of chords within a tonal context (Riemann, 1893; Schenker, 1979), acoustical or sensory consonance (Rameau, 1971) and its melodic organization (Bigand, Parncutt and Lerdahl, 1996). On the other hand, a psychological perspective of musical tension investigates other factors such as cognitive approaches that justify the importance and role of tonal contexts (how chords have specific functions in tonal contexts) (Bharucha, 1984; Bigand, 1990; Krumhansl, 1990; Lerdahl, 1988; Lerdahl, 2001), and theories in musical perception that reveal the chords' psychoacoustical features (Parncutt, 1989; Roberts & Shaw; 1984). This psychological approach can also be extended to the study perceptual aspects of auditory perception and its impact in music perception such as dynamics and timbral elements such as pitch register, roughness, brightness and density (Burnsed & Sochinski, 1988-2001; Granot & Eitan, 2011; Hutchinson & Knopoff, 1978; Ilie and Thompson, 2006; Krumhansl, 1996; Misenhelter, 2001; Pressnitzer, McAdams, Winsberg, & Fineberg, 2000; Plomp & Levelt, 1965).
One common trait between these perspectives is the emphasis of establishing a stable tonal center to derive sentiments of musical tension. These studies and observations have undoubtedly stemmed from the analysis of tonal repertoire and although some work has been extended to atonal repertoire (Dibben, 1994; Lerdahl, 1989), understanding musical tension in repertoire that embodies both tonal and atonal elements, such as neoclassical repertoire, is an area of research that remains to be explored.
Tonal and Atonal Tension
The notion of tension and release is a fundamental concept to tonal music, a core component in the analyses of Western repertoire and this has been thoroughly explored through theoretical ideologies, music perception and empirical findings. As seen in Schenker's ideologies (1979), his principles of identifying the hierarchical levels within the music, resulting in deriving the fundamental Ursatz 2 can be seen as similar to the notion of tension and release. This schema has been explored from a cognitive psychological perspective, in the renowned text, Generative Theory of Tonal Music (GTTM), by Lerdahl and Jackendoff (1983), to understand the musical events. Supporting Schenker's ideas, their work revealed hierarchical organization as the driving factor, understanding the relationship between pitches, keys of tonal hierarchy and rhythmic structure as a way to understand tonal music's structure and processes. The claims made from GTTM are supported by empirical studies, all of which emphasizes the importance of tonal hierarchies, the close relationship between metric-rhythmic and pitch structure, and the combination of structure and hierarchical relationships to represent stability (Bharucha & Krumhansl, 1983; Bigand, 1990; Dibben, 1994; Krumhansl, 1979; Krumhansl & Kessler, 1982; Palmer & Krumhansl, 1987; White, 2017). These findings have also revealed the close relationship between such hierarchies to the notion of tension and release (Bigand, 1993; Bigand, Parncutt, & Lerdahl, 1996). For instance, in a Mozart case study, Krumhansl (1996) suggests that there is a high correlation between completeness and judgements of tension, where tension increases upon approaching the end of a section approached, and a decrease of tension at the end of the piece. And in subsequent studies, Lerdahl explored the prolongational component from the GTTM and developed a methodological approach to quantify sequential and hierarchical harmonic tension as well as an algorithm that accounts for stability, proximity and directed motion (Lerdahl & Krumhansl, 2007; Lerdahl, 1988; Lerdahl, 1996).
However, extending these theories to atonal music may not yield the same outcomes. The notion of tension and release in atonal music has been developed by Lerdahl (1989), who proposes an atonal prolongational theory as a way to comprehend twentieth-century music, using Schoenberg as case studies. He proposes that the perception of atonal music relies more on salience conditions (such as register and parallelism 3) and creating an atonal pitch space than stability conditions (as established in GTTM). Additionally, a reductional hierarchy of atonal music is more dependent on time span reduction, particularly in its metrical and grouping structure. And whilst Lerdahl emphasizes a strong level of congruence between rhythmic structure and hierarchical events, a study by Krumhansl, Sandel and Sargeant (1987) focusses on using pitch sets and serial structure rather than hierarchy to investigate the perception of atonal music by listeners. Using Schoenberg's Wind Quintet and String Quartet No. 4 as case studies, they uncovered that listeners have the ability to internalize serial compositional techniques such as mirror transformations, octave transpositions of tones and variations of rhythm and phrasing, and they are able to listen to the music without reference to tonal structures (Krumhansl, Sandel, & Sargeant, 1987). A more recent study by Esteve-Faubel, Francés-Luna and others (2016) investigates the cognition of stability of atonal music in non-musicians. Their findings revealed that listeners were able to perceive atonal music through the structural stability and metrical contents of the music's events, which thus reinforces the works carried out by Dibben (1999) and Lerdahl (1997), aligning the predictions of atonal prolongational theory with the results from experienced listeners of atonal music.
Harmony, Roughness and Tension
Nonetheless, a unifying theme to understand musical tension amongst both tonal and atonal music is the influence of harmony, as one of the primary means to create a coherent progression in musical events (Lerdahl & Jackendoff, 1983; Meyer, 1956; Schenker, 1979). In tonal music, it has been argued that some chords 4 suggests stronger or lesser tension (Lerdahl & Jackendoff, 1983; Meyer, 1973). This claim is further supported by Schenker's theory, where tonal centric pieces can be analyzed as "elaborations of a fundamental tensing-relaxing relation defined by tonic-dominant-tonic chords" (Bigand, Parncutt and Lerdahl, 1996) all of which relates back to a theoretical understanding on how we perceive stability in musical events. Additionally, the notion of musical expectancy also comes into play when investigating musical tension. As stated by Bigand, Parncutt and Lerdahl, "musical tension and relaxation, created by chords, appears to be linked to the musical expectancies governed by harmonic structures." 5
Exploring musical tension with a focus in harmonies has been examined by several authors. Although it is known that meter and duration will undoubtedly influence listeners' perceptions, the following works however, localizes specific musical elements, some of which focus on manipulating certain musical factors (e.g. pitch, rhythm, timbre), exploring the concept of horizontal motion, the impacts of intervallic distance, dissonance and roughness. A study by Paraskeva and McAdams (1997) investigates the influence of musical factors such as timbre, the absence of tonal hierarchy on the perception of musical tension and relaxation. With a focus on pitch, rhythm and timbre, the stimuli set was created using a computer and synthesizer to avoid the intervention of parameters to represent the same rhythmical structure, intensity, tempo and duration. 6 Their study concluded that timbre has a direct implication, and understanding the musical context influences listeners in determining tension and relaxation.
Another element that could influence one's perception of tension and release is through horizontal motion. The concept of horizontal motion as a perceptual phenomenon can be traced back to Huron (1995) but its influence on the perception of stability has been discussed by Schoenberg (1911) where he encourages an understanding on the perceptual independence of voices. Furthermore, this has been explored in two case studies by Dibben. Dibben's study (1994), which sought to locate structural stability in nontonal contexts, highlights salience, voice-leading and dissonance as important factors to locate structural importance. Whilst her results correlate with Lerdahl's atonal prolongational theory, it is interesting to point out that her results also reveal that horizontal (or voice-leading) motion and dissonance influences participants when rhythmic, timbral, dynamic and metric information is absent. Her work also uncovered that larger intervals between events correlate with less stability, especially for outer voices, demonstrating perceptual significance of horizontal motion in music. Dibben also observed that the occurrence of certain intervals, ones where listeners will have a preconceived notion as being 'dissonant', predicts listeners' judgements of stability (e.g. leaning quality of certain intervals such as minor 2nds and tritones). This therefore suggests the importance of examining horizontal motion between voices in chord sequences and the influence of dissonance in non-tonal music. Another study by Dibben (1999) also suggests that voice-leading could be a more important factor in perceiving tension in atonal music (marking a change in the traditional balance of harmonic and contrapuntal considerations), and this could potentially help to explain the instability of particular melodic intervals and preference for types of linear movement within voices. Additionally, her study also revealed that chords containing high roughness values were perceived to be more unstable than its context in tonal music.
Additionally, Bigand, Parncutt and Lerdahl's (1996) studies revealed the effects of interval size between successive chords on the perception of tension, where interval size is particularly significant for the movement within outer voices – where the larger the interval was in each voice, the greater the perceived tension. This is however context dependent, as their hypothesis states that an event, which is preceded by a large interval is perceived as less stable than an event which is preceded by a smaller interval. 7 Their studies (Bigand, Parncutt, Lerdahl, 1996; Bigand & Parncutt,1999) also focus on the internal and external influences (by utilizing short and long chord sequences as the stimuli set) to better account for perceived tension through a cognitive approach (echoing the works of Lerdahl and Krumhansl) and applying a sensory model, examining the roughness and dissonance of individual chords. 8 Their results reported that the examination of horizontal tension and its roughness will better account for musical tension and chords that contain high roughness values are perceived to be more tense. 9 However, one limitation from these two studies is the emphasis on analyzing chords within a strictly tonal context. As such, this could be further developed into a study that examines tension in harmonies that do not have to be related back to a specific tonality and the tension of these chords will be assessed at face value.
Other studies have explored roughness as a key factor to assist with determining tension in nontonal music. Roughness, as a concept, can vary depending on the context and its application in research. First introduced by Hermann von Helmholtz in 1885, a high level of roughness for instance was associated with pitch instability, amplitude fluctuations and high ratio partials. In more recent studies, there are varying approaches to defining and calculating roughness. Lartillot and Toiviainen (2007), for instance, portray roughness as 'sensory dissonance' and this was calculated by "adding the beating provoked by each couple of energy peaks in the spectrum" (p. 238). Arnal, Flinker, Kleinschmidt, Giraud, and Poeppel (2015) describe roughness in a different manner, measuring this phenomenon through the Modulation Power Spectrum (MPS) – a two-dimensional fast Fourier transform of a spectrogram – and focussing on rough sounds that "correspond to amplitude modulations ranging from 30 to 150 Hz [in the MPS] and typically induce unpleasant, rough auditory percepts" (p. 2051).
One such study by Pressnitzer and others (2000) focuses on treating roughness as a "dimension of timbre," to open a new avenue of perceiving tension nontonal harmonies. The results suggest that although roughness participates in intrinsic consonance in tonal context, it does also extend to nontonal contexts and ultimately, the results demonstrate that rough instrumental sounds evoke tension in listeners. 10 Other studies also revealed that the analysis of timbre, combined specifically with the examination of roughness, does have an impact on how we perceive tension in both tonal and nontonal music, as a means to support the harmonic changes (McAdams & Pressnitzer, 1996; Paraskeva & McAdams, 1997). Although theories of nontonal tension are less numerous, it has been suggested that composers have proposed theories of nontonal tension that is however, only related to their own musical styles, like a "codification or personal practices" (Pressnitzer, McAdams, Winsberg, &Fineberg , 2000).
More recent studies in musical tension have sought to formalize musical tension, the application to other musical disciplines (e.g. performance) and the development of a more inclusive model to account for musical tension. One such study incorporates the examination of the predictability of musical structure and expressive timing in performance to perceived musical tension (Gingras, Pearce, Goodchild, Dean, Wiggins, & McAdams, 2016). Based on a tonal-centric work, their findings suggest that there is a close interconnection between the dimensions of pitch (melodic structure) and time (expressive timing) in music when the notated meters and durations are removed. 11 A similar study by Farbood and Upham (2013) investigates how performances can be interpreted through listeners' judgements of musical tension. 12 Additionally, another study by Farbood (2012) proposed a quantitative model of musical tension, one that accounts for the dynamic and temporal aspects of listening. Their findings revealed that two parameters in particular have a significant impact on listeners' perception of tension, dynamics and pitch height. 13
Despite the large body of research that has delved the various different aspects of music that attribute to our perception of tension, there is no work that describes or explores the perception of post-tonal chords, but more specifically, how these chords will be perceived without reference to a tonal center. The appraised literature therefore points out two key points: one, a lack of research into understanding and measuring post-tonal tension, a series of chords that encompass atonal and tonal elements and two, the importance of using psychoacoustical factors such as roughness to support empirical analyses into chordal tension. This study therefore seeks to explore a different way to measure musical tension in post-tonal repertoire, by taking the approach of calculating the total amount of voice-leading movement between chords 14 – and extending Lerdahl's model of calculating tonal tension (Lerdahl & Krumhansl, 2007; Lerdahl, 1988; Lerdahl, 1996). The aim of the experiment is to establish if the values from the model approach have a direct relationship to how we perceive tension and release specifically in post-tonal repertoire. It is predicted that listeners' tension ratings are closely related to its musical context, and to the composers' harmonic idioms. Furthermore, without reference to a tonal context however, listeners may be more likely give higher tension ratings based on the movement between the first and last "pitch collections" (PCns) 15, as well as accounting for preconceived notions of consonance/dissonance and other parameters such as register, and voice-leading movement. As for the model, it is predicted that a larger value denotes tension and a smaller value correlates with relaxation.
METHOD
Design
The design of this experiment derives from one component from a "hybrid" theoretical model, which encompasses elements from three different theories – Schenkerian method, neo-Riemannian theory and pitch-class set theory. This model was created to address the harmonic issues posed by post-tonal repertoire, more specifically neoclassical works, as these works contains vestiges of tonality as well as post-tonal elements. 16 Rather than applying the conventional Roman numeral labelling, calculating the total amount of minimal movement between each voice in the chords or more loosely, pitch collections (PCns)will provide a different and concise representation of the harmonies. This will be known as the Aggregated Voice-Leading (AVL) movement. (The AVL differs to voice-leading movement as AVL is the sum of all the voice-leading movement whilst voice-leading movement denotes the individual movements.) This aspect of the model suggests that there are potentially correlations between tension and release to the numerical fluctuation within the harmonic contents. In order to test this empirically, a number of extracts – taken from the model's application – are tested for listeners to rate the amount of tension through the use of a tension rating scale, from 1 to 5.
In addition, several commonly used descriptors of music associated with measuring tension were extracted to provide an alternative or broader account of the tension within the music. Tonal stability 17, roughness 18, and several variables denoting other characteristics of the pitch collections such as mean pitch 19, median range 20, and the number of notes in a PCn 21. Tonal stability and roughness 22 were extracted from the last pitch collection of the clip using MIR Toolbox (Lartillot & Toiviainen, 2007). The other calculations of the other properties of the pitch collections was carried out with MIDI toolbox (Eerola & Toiviainen, 2004).
Stimuli
The stimuli set was selected from a small number of neoclassical works that contain post-tonal harmonies. As the three case studies – Hindemith's Piano Sonata No. 2, Ravel's Sonatine and Stravinsky's Concerto for Piano and Wind Instruments – have already been analyzed from a music theoretical perspective, assessing "real-life" responses by participants could potentially shed more light on the correlation or interaction between music theory and music perception.
These pitch collections (or "vertical sonorities" or "chords") in the stimuli set were generated by Sibelius and played with piano sounds produced by Sibelius at a tempo of 100 crotchet beats per minute. Tempo and dynamics (set to forte) are a constant factor across all sound clips, providing listeners with the same rate of change between pitch collections and its decay rate of sound. There are no rests or silences between successions of pitch collections. Three excerpts of varying lengths from each of the three works are selected and they are segmented into smaller fragments/clips (see Appendix B for the scores and the model's results):
- Hindemith
- Bars 12–17 (10 clips)
- Bars 22–27 (9 clips)
- Bars 56–63 (14 clips)
- Ravel
- Bars 3–5 (8 clips)
- Bars 24–27 (9 clips)
- Bars 39–42 (10 clips)
- Stravinsky
- Bars 1–4 (7 clips)
- Bars 39–43 (10 clips)
- Bars 64–69 (12 clips)
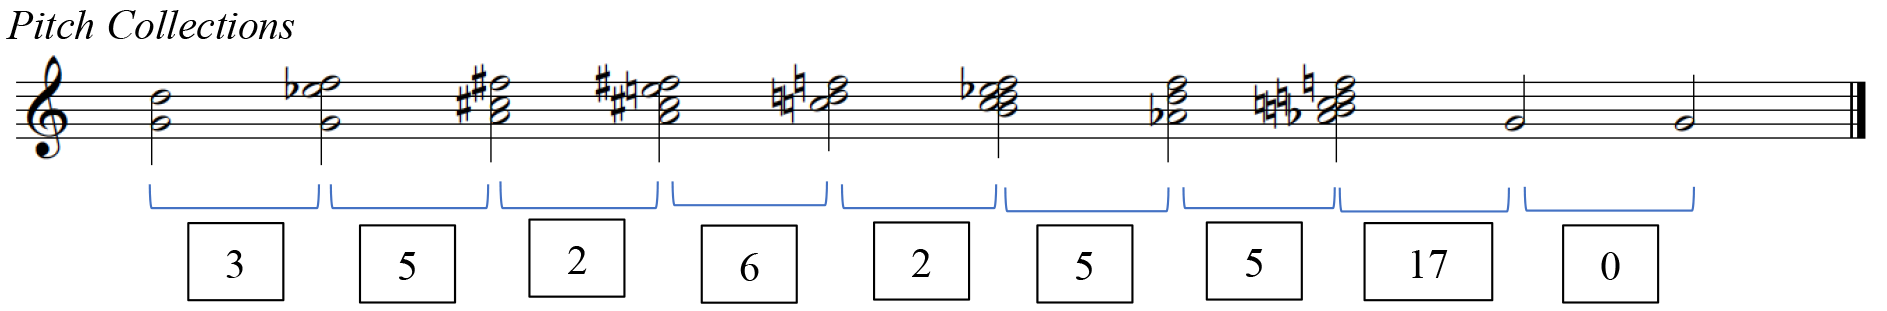
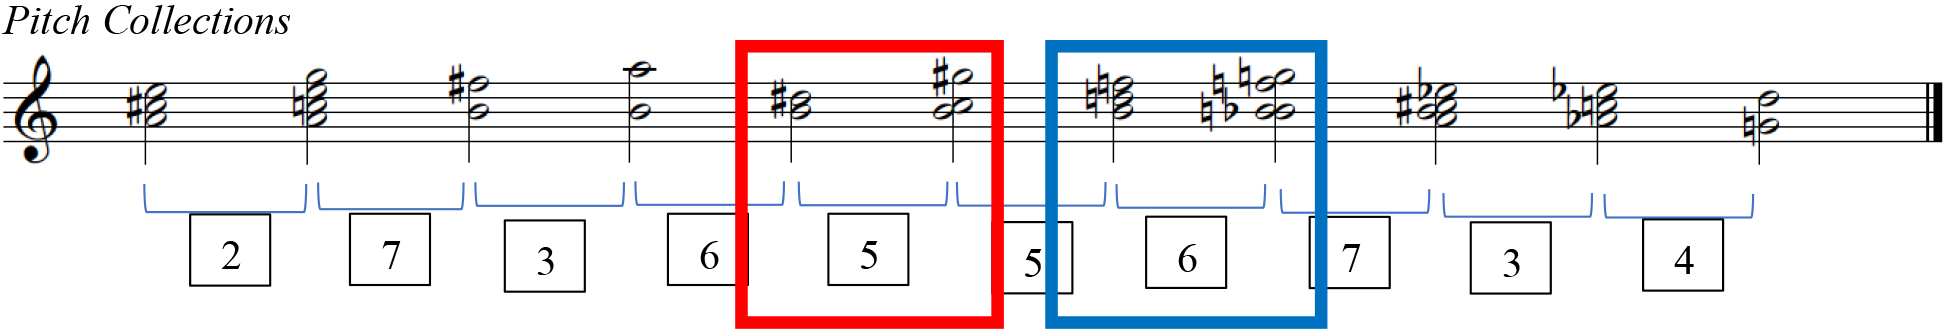
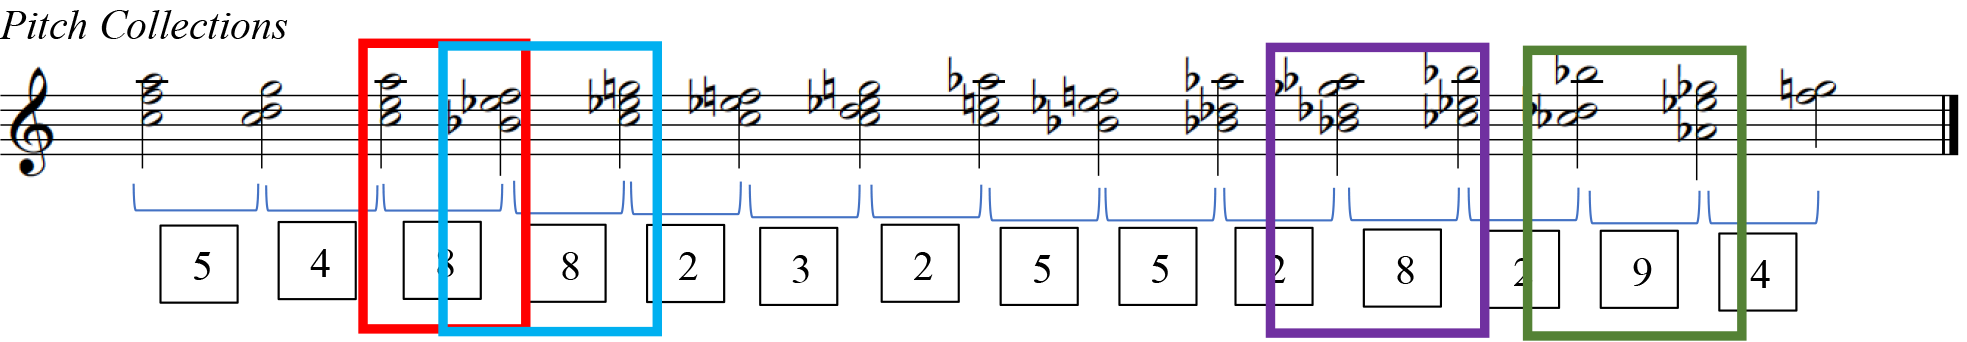
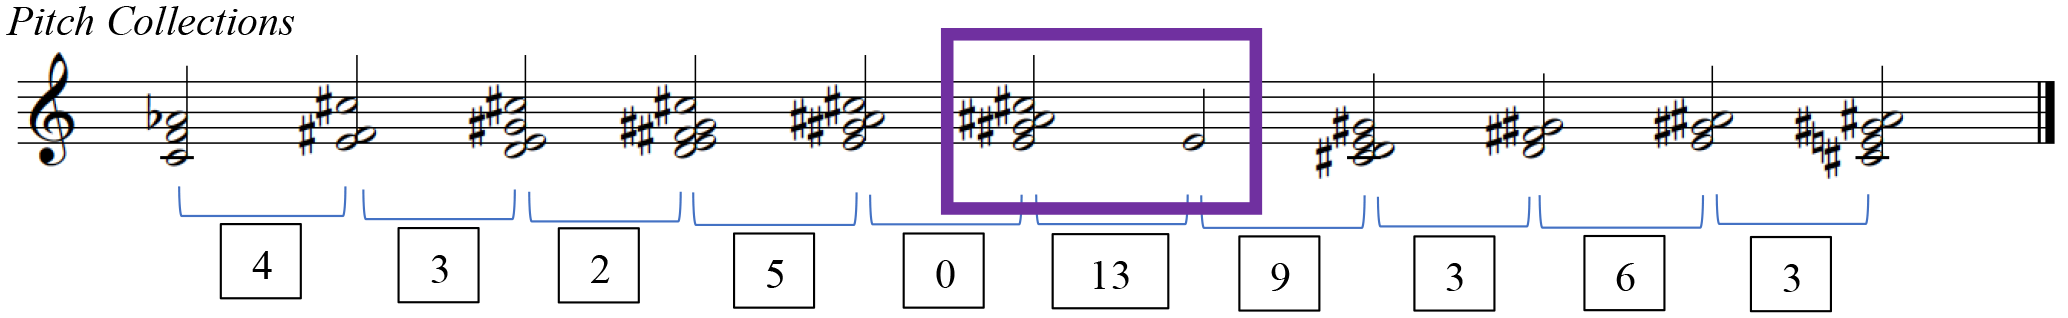
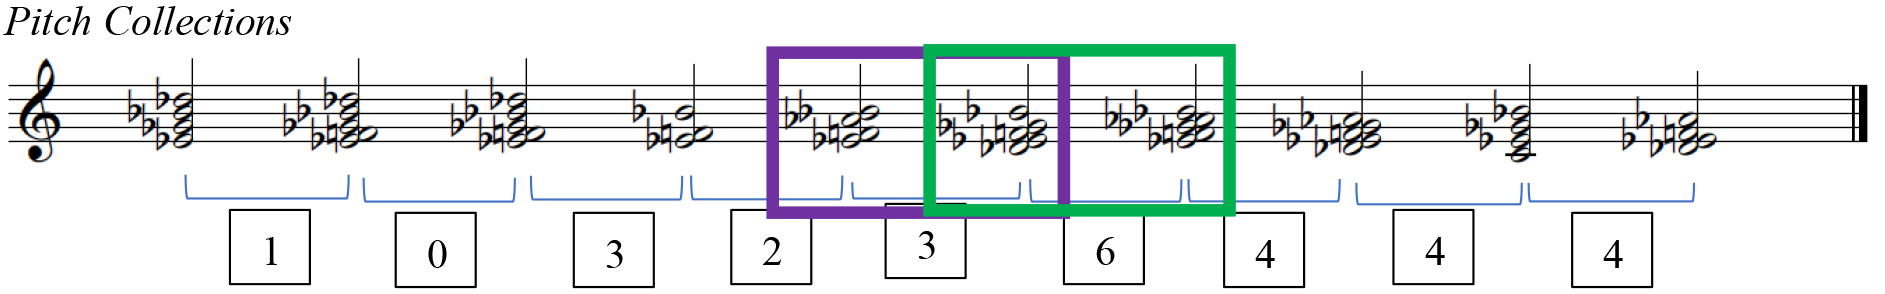
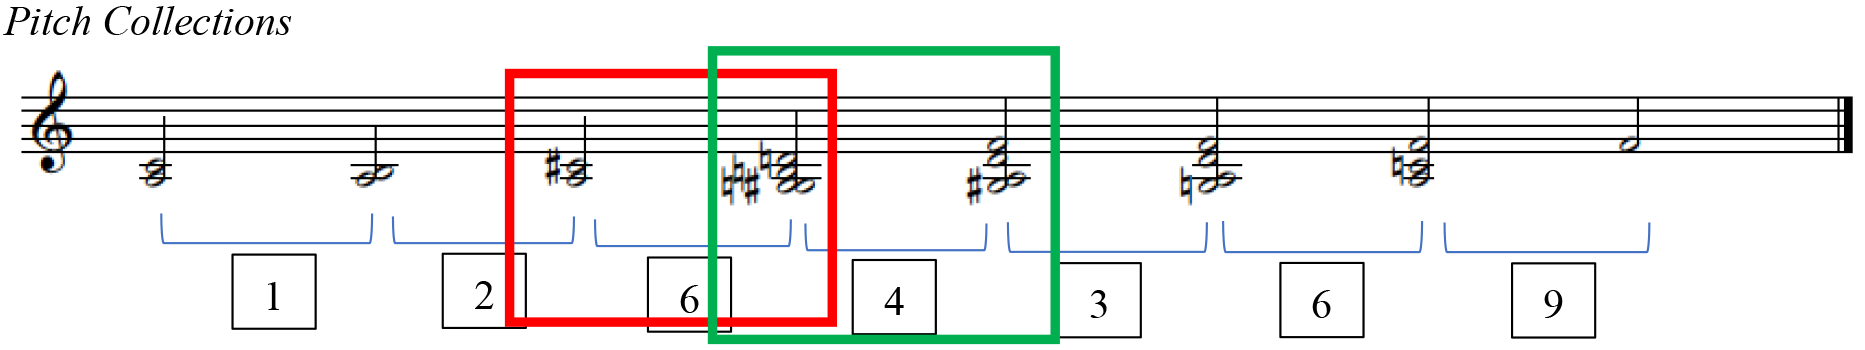
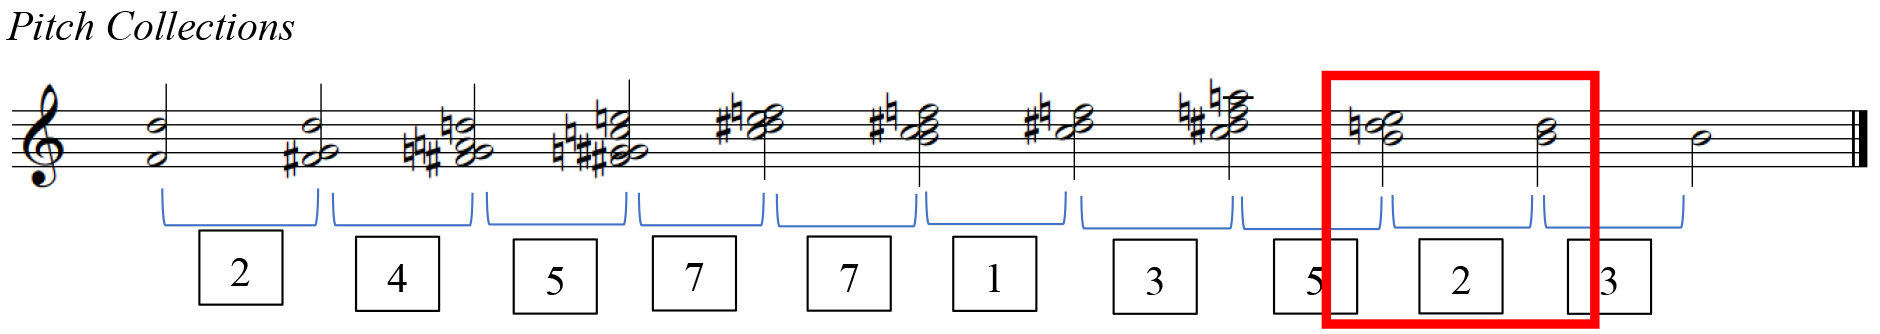
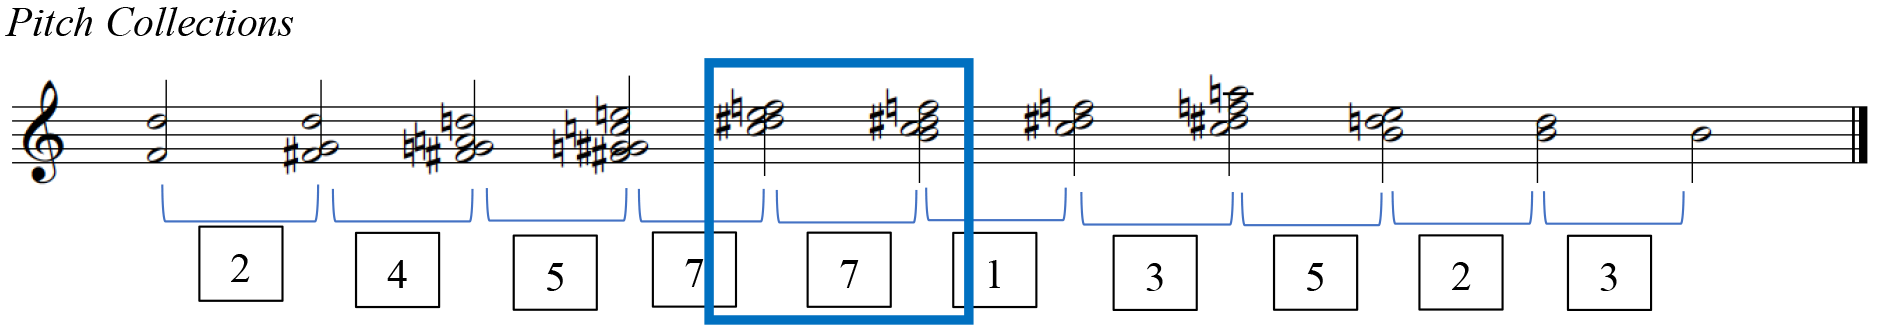
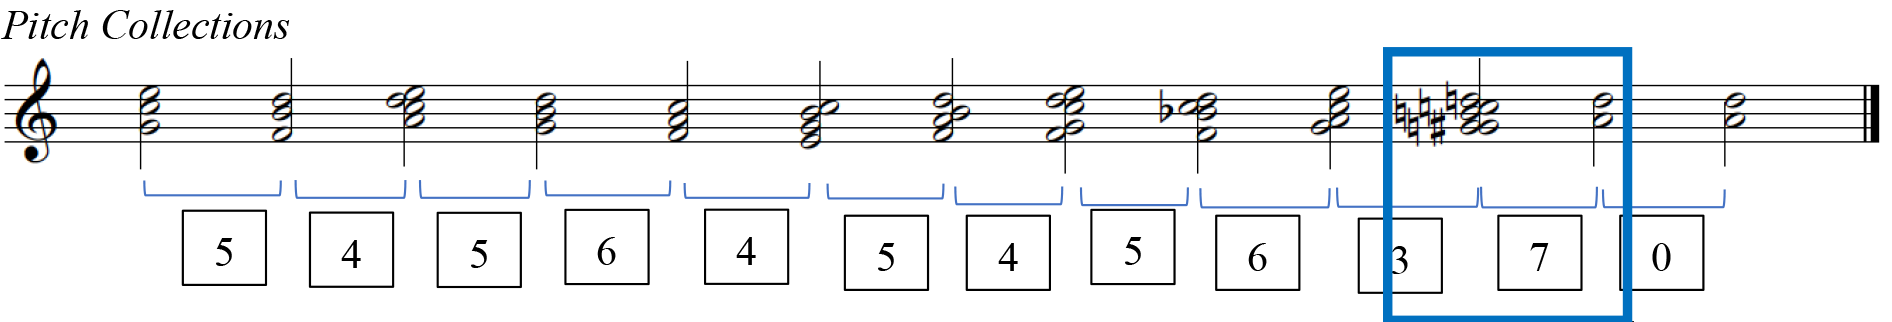
Figures 1, containing the third Hindemith excerpt, exemplifies how meaningful segmentation 23 occurs and Figure 2 lays out these segments as pitch collections into a separate stave for voice-leading analysis. The numbered segments in Figure 1 correspond with the PCns in Figure 2 and the brackets under the PCns in Figure 2 denote the smaller segments, the sound clips.
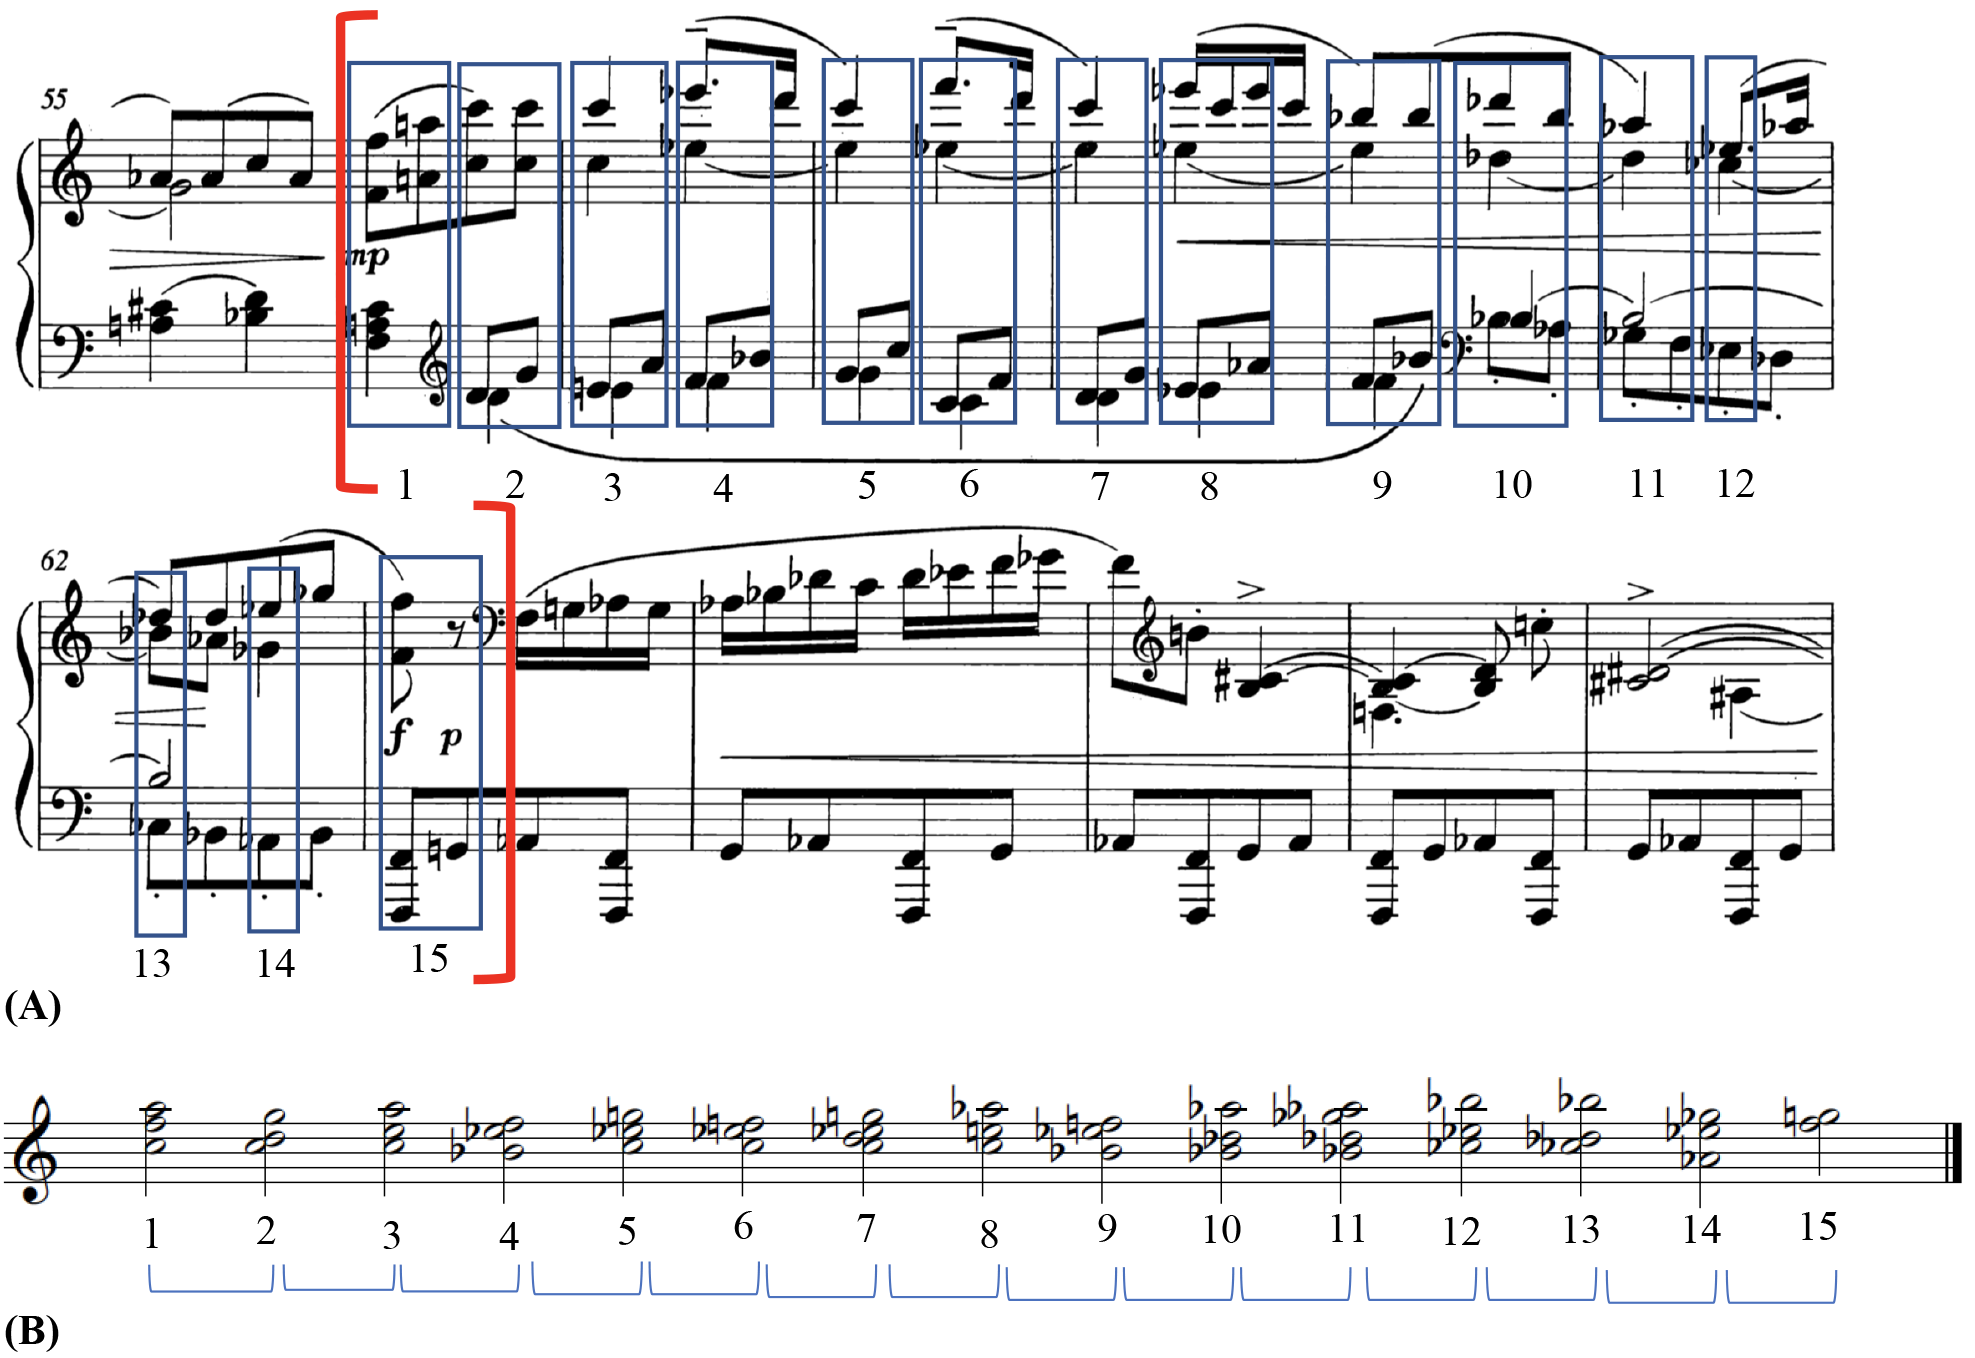
Fig. 1. Hindemith Excerpt – Bars 56–63: (A) Segmentation; (B) PCns.
Task and Procedure
This online experiment was conducted via Qualtrics and distributed through a mixture of different media: University mailing lists; social media; and word of mouth. Data quality was based on three factors: completion of the survey; rate of speed; and consistency of results. For instance, in scenarios where participants left the survey incomplete or completed it in a very short amount of time (e.g. 5 minutes) given the number of questions, their results were eliminated.
Set in the form of an online survey, the study firstly required participants to answer a series of general questions, adapted from the Ollen Musical Sophistication Index (OMSI) such as age, gender, country of origin and residence, musical expertise. The first part of the experiment then consists of a practice trial for the participants to familiarize with the format. This comprises 3 sound clips that do not reoccur in the study, and participants are asked to assess how tense the second sound is: using a 5-point scale, ranging from 1 (weak) to 5 (strong). No answer or feedback was given. In the second part of the experiment, each participant was instructed to firstly, listen to the musical excerpt (comprising a longer series of PCns); and secondly, in a randomized order, participants are to listen to a musical clip drawn from the excerpt – two sets of "sounds" or for a better term, PCns – and rate the tension of the second sound. Figure 2 illustrates an example, the first clip from Hindemith, and a brief explanation of the clip labels. This is repeated for every musical clip within the musical excerpt and the entire process is repeated for all nine musical excerpts (three excerpts each from Hindemith, Ravel, and Stravinsky). For each participant, the presentation of the musical clips within the larger musical extracts are presented in a randomized order. Participants are allowed to replay the extract if necessary. The experiment took 15 to 20 minutes to complete.
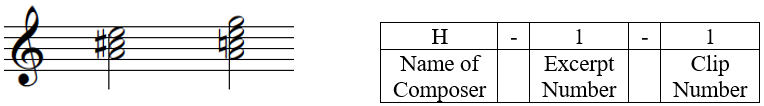
Fig. 2: H-1-1.
Participants
Participants greatly varied in age range, countries, gender and musical backgrounds. Of the 121 recorded responses, only 63 responses were valid. The participants in the experiment included 16 non-musicians, 41 music-loving musicians, 18 amateur musicians, 10 serious amateur musicians, 13 semi-professional musicians, 16 professional musicians, with more female (63%) than male (37%) participants.
RESULTS
Analysis Methods
A preliminary examination of the frequency distribution of the tension ratings (use of the rating scale) in each of the case studies highlights that in accordance with Cronbach's (1951) alpha, the internal consistency of the ratings was high, producing a reliability coefficient of 0.725, based on accounting for other variables (Tonal stability, roughness, mean pitch, range, and chord size). The mean and standard deviation across all three excerpts are 2.60 and 0.71 respectively.
The main results from the experiment are presented through various modes of graphical representation in two components: "Aggregated Voice-Leading (AVL) and Mean Tension Rating (MTR)" and "Roughness and Mean Tension." Appendix B provides the respective scores that the segmentation is based upon, as well as the pitch collections and data.
Aggregated Voice-Leading (AVL) and Mean Tension Rating (MTR)
The following diagram represents the results from the model (AVL) against the mean ratings (MTR) of participants' responses.
EXCERPT 1: HINDEMITH, PIANO SONATA NO. 2
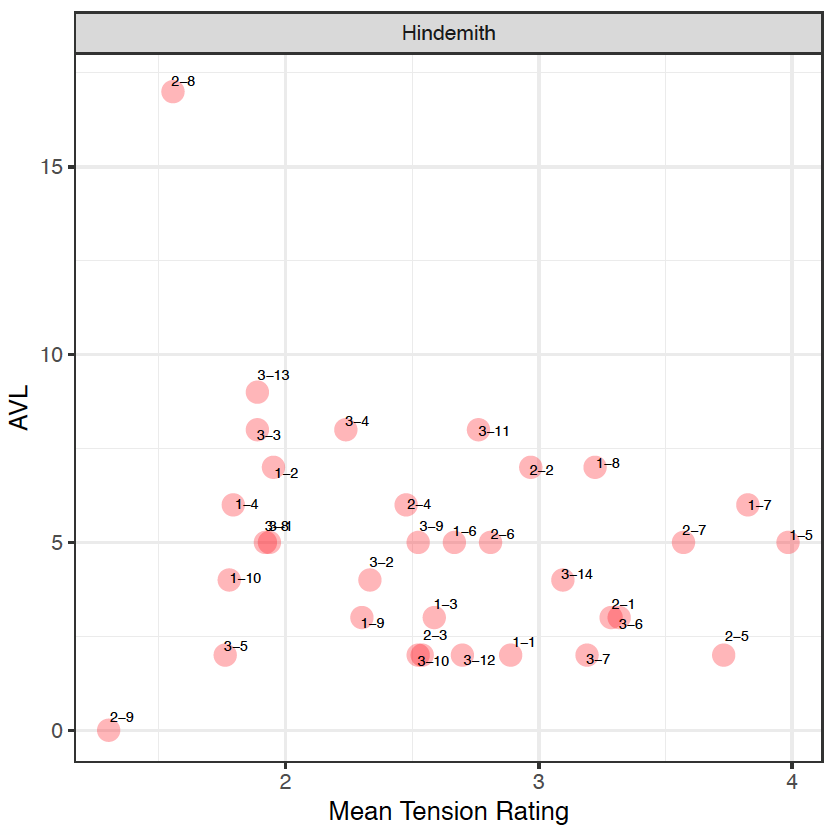
Fig. 3: Model VS Mean Tension – Hindemith.
In the Hindemith extracts, an initial observation reveals that participants identified the extracts with a lower tension rating rather than a higher one. This can firstly be attributed to the registral placement of the sound clips. As the PCns are organized and presented in a manner that moves by small (or "smooth") voice-leading movement, this may be challenging for participants to identify points of tension. This can be seen in 20 out of 33 clips, where the soprano voice – the outer voice that most listeners tend to immediately identify with – moves by a semitone (1) or a tone (2) or retains its note (0).
When comparing the mean tension rating (MTR) to the aggregated voice-leading values (AVL) in the Hindemith excerpts, the results firstly reveals that larger values from the model does not necessarily mean more tension, (as there is no correlation between the ratings and the model, r[31]= -0.227, p=0.2028), but it does act as a prompt to invite the analyst to re-examine the particular moment in the music. For example, sound clips H-2-8 and H-2-9 have been identified by participants as a small MTR, between 1 and 2. The model indicates that H-2-8 is supported with AVL17, so despite the large value, the smaller tension rating in fact coincides with a movement from a "cluster" chord to a unison note. And whilst H-2-9 is supported with AVL0 from the model, correlating closely with the results from the study, it actually represents the movement between two identical notes – a unison – which suggests that listeners associate movement by unison with a small tension rating.
| Clip | H-2-1 | H-2-2 | H-2-3 | H-2-4 | H-2-5 | H-2-6 | H-2-7 | H-2-8 | H-2-9 |
|---|---|---|---|---|---|---|---|---|---|
| AVL | 3 | 5 | 2 | 6 | 2 | 5 | 5 | 17 | 0 |
| MTR | 3.29 | 2.97 | 2.54 | 2.48 | 3.73 | 2.81 | 3.57 | 1.55 | 1.30 |
The two largest tension rating identified in all three Hindemith sound clips, H-1-5 and H-1-7, coincides with a shift from a consonant interval to a more dissonant pitch collection, which comprises of more than one layer of consecutive semitonal movement (e.g. H-1-7 contains a movement of B♭ to B and F to G). An interesting point that arises from this observation is that when putting this back in context with the music, the results align with the climactic moment of the phrase (bars 15–16), where there is a driving quaver pattern in the LH against the descending melody of the RH, played forte. This reinforces the relationship between the musical contour (examining the melody, dynamics and rhythm) and the harmonic contents.
| Clip | H-1-1 | H-1-2 | H-1-3 | H-1-4 | H-1-5 | H-1-6 | H-1-7 | H-1-8 | H-1-9 | H-1-10 |
|---|---|---|---|---|---|---|---|---|---|---|
| AVL | 2 | 7 | 3 | 6 | 5 | 5 | 6 | 7 | 3 | 4 |
| MTR | 1.95 | 2.89 | 2.59 | 1.79 | 3.98 | 2.67 | 3.82 | 3.22 | 2.30 | 1.78 |
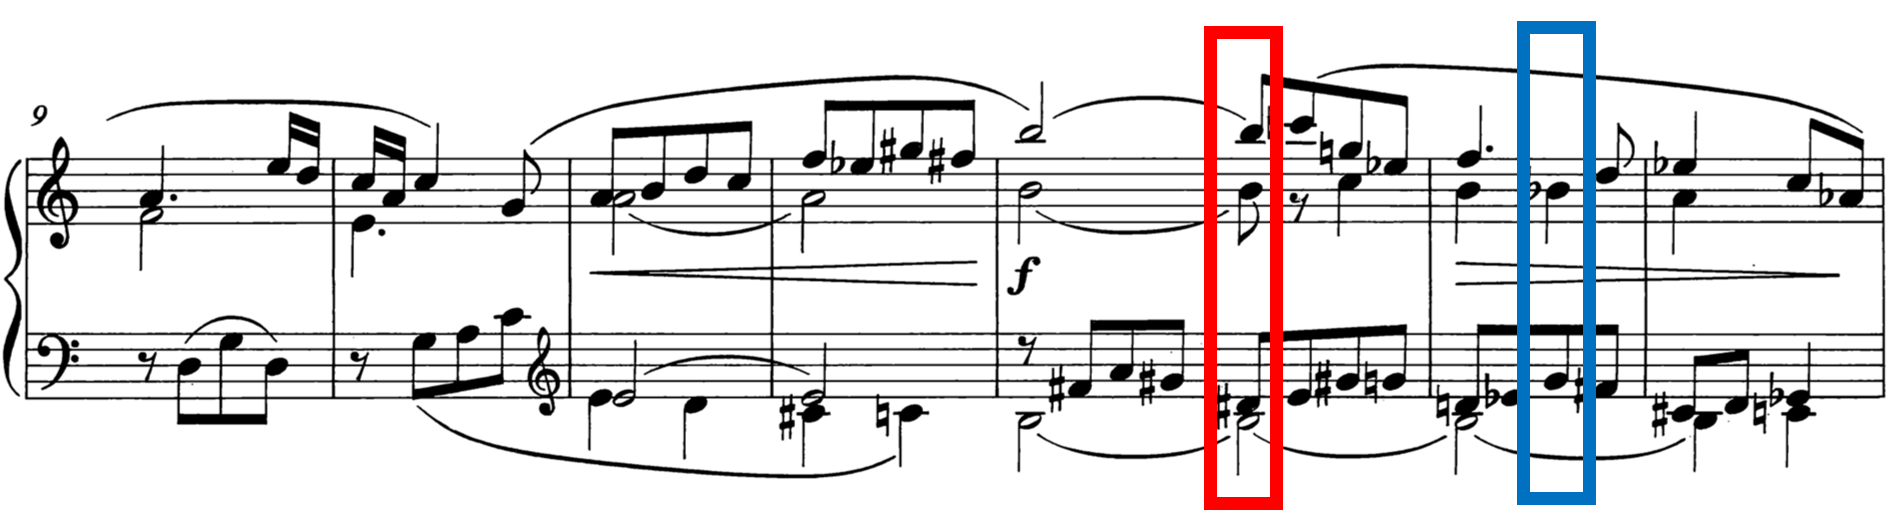
Fig. 6: Hindemith, Bars 9–16.
With H3, although the MTR value identified from participants are around the 2.4 range, the model indicates much larger values on certain clips, such as H-3-3, H-3-4, H-3-11, and H-3-13. In all four instances, the following observations can be noted:
| Sound Clip | AVL | MTR | Contour | Movement – Soprano Voice |
|---|---|---|---|---|
| H-3-3 | 8 | 1.88 | Descending | M3 |
| H-3-4 | 8 | 2.23 | Ascending | M2 |
| H-3-11 | 8 | 2.76 | Ascending | M2 |
| H-3-13 | 9 | 1.88 | Descending | m3 |
It is interesting to observe the contour or direction from the first to the second PCn in each of these four instances as the this may have had an impact on listeners' perceptions. For instance, in H-3-3 and H-3-13, despite the large value from the model, the descending contour and intervallic movement of a 3rd may have attributed to the smaller tension rating. H-3-3 in particular disproves the earlier statement that a consonant triad to a less consonant sonority may contain a higher tension rating. This therefore suggests that the direction of the notes plays a part in how listeners would determine more or less tension. With H-3-4 and H-3-11, despite their large model value, this is represented with MTR values that are larger than H-3-3 and H-3-13. This can perhaps be attributed to its ascending contour as there is a slight ascent in the soprano voice between the first to the second PCn. On the whole, it can be seen that through these examples that large values calculated from the model does not necessarily have to correlate with a higher perceived tension rating and there are other musical factors that will have an influence on listeners.
| Clip | H-3-1 | H-3-2 | H-3-3 | H-3-4 | H-3-5 | H-3-6 | H-3-7 | H-3-8 |
|---|---|---|---|---|---|---|---|---|
| AVL | 5 | 4 | 8 | 8 | 2 | 3 | 2 | 5 |
| MTR | 1.94 | 2.33 | 1.89 | 2.24 | 1.76 | 3.32 | 3.19 | 1.92 |
| Clip | H-3-9 | H-3-10 | H-3-11 | H-3-12 | H-3-13 | H-3-14 |
|---|---|---|---|---|---|---|
| AVL | 5 | 2 | 8 | 2 | 9 | 4 |
| MTR | 2.52 | 2.52 | 2.76 | 2.70 | 1.89 | 3.09 |
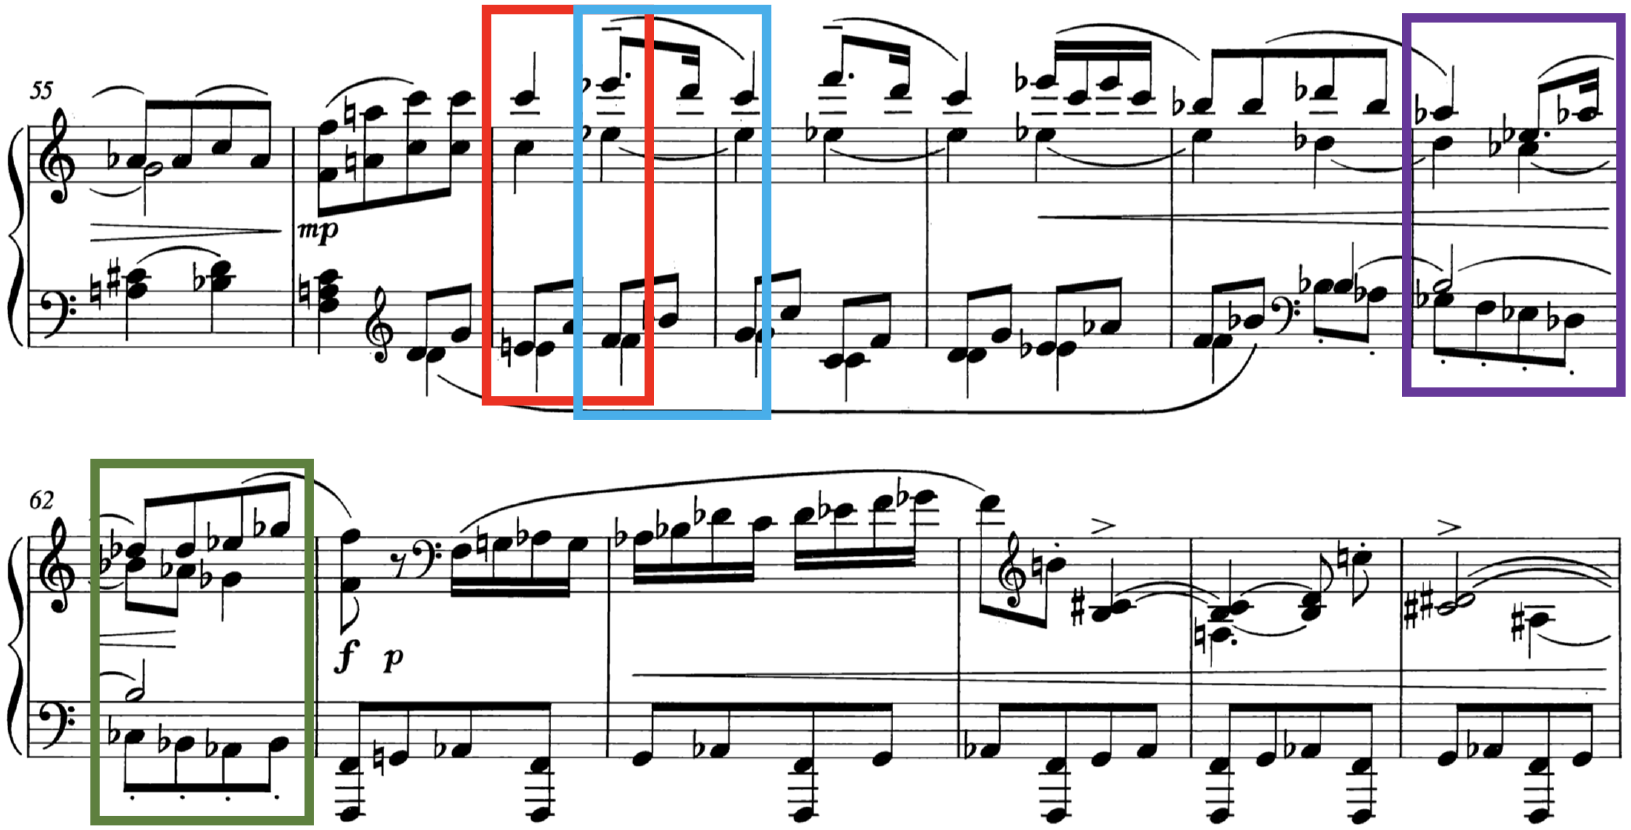
Fig. 8: Hindemith, Bars 55–67.
EXCERPT 2: RAVEL, MOUVEMENT DE MENUET FROM SONATINE
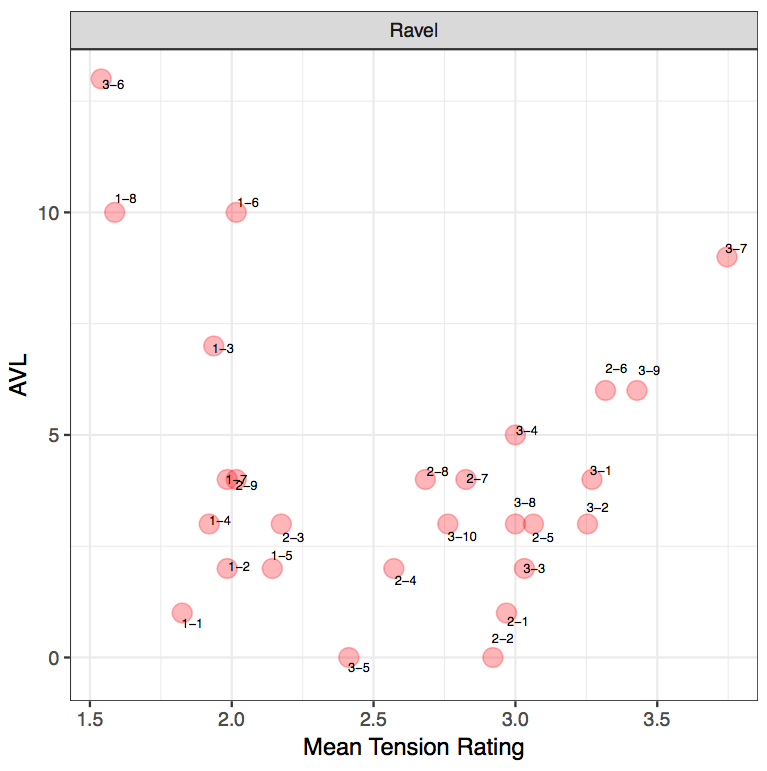
Fig. 9: Model VS Mean Tension – Ravel.
With Ravel, participants have generally rated the excerpts between a medium to low tension rating as opposed to a higher tension rating. Given that Ravel's harmonic idiom can be described to be more consonant than the other two composers, it is interesting to analyze why it might be the case that listeners have used smaller tension rating values. Out of the 27 clips, the soprano voice in 21 of these clips move via "minimal" movement, thereby suggesting that the importance of the positioning of the PCn, whether it sits in a "root position" or in its various inversions. The remaining 6 clips move via slightly larger movements such as a major 3rd (M3). In instances where larger tension rating values have been identified (such as R-3-9), as stated earlier, register plays an important role in listeners' perception as the larger tension rating value could be attributed to the slight ascent in the notes from the first to the second PCn, as well as the consecutive use of stacked seconds within the PCns.
The AVL and MTR results from the Ravel excerpts reveal that there is no clear linear correlation between the AVL model and mean tension ratings (r[25]= -0.199, p= 0.3187). However, this does not mean that the pattern could not be interpreted and there might in fact be a curvilinear relationship. Firstly, R-1-8 and R-3-6 have been perceived by participants with a lower tension rating but the model indicates a large AVL value. When examining the notes in R-1-8, the large AVL movement (AVL10) identified by the model marks a shift from a PCn containing 3 notes to a single note. The direction of the first PCn to the second is also of a descent. It can also be noted that a reduced number of notes in the second PCn may have had an impact on listeners' perception as it may appear less tense. When correlating this finding back to the music, this particular moment coincides with a tied A♭ across the bar, with an absence of a bass note. Therefore, despite the large AVL value from the model contrasting the small tension rating, it simply indicates that a large AVL movement does not necessarily have to represent more tension but it marks a significant change in the harmonic contents, drawing our attention to that particular moment. In this instance, the large AVL value indicates a release of tension. Thus, whilst the model's calculation represents the physicality of the PCn's movement, its external qualities, it can be argued that the mean tension represents the culmination of other parameters, such as contour.
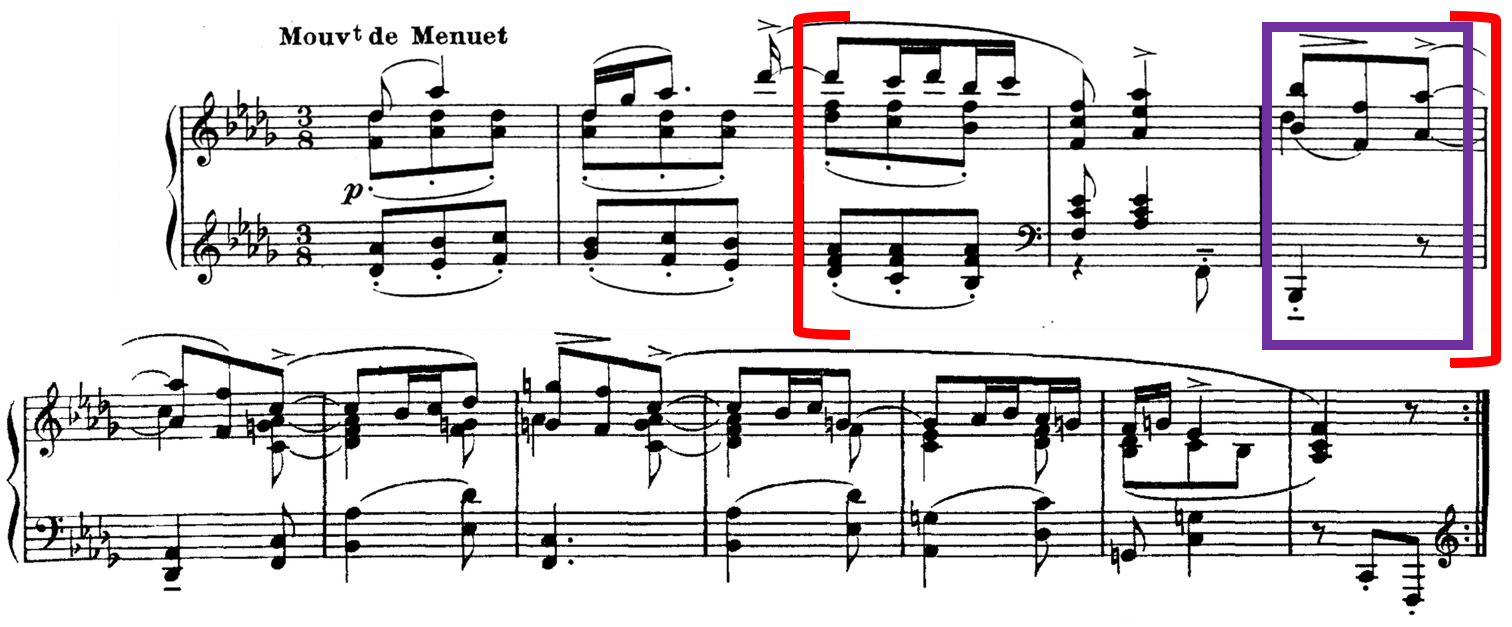
Fig. 10: Ravel, Bars 1–12.
| Clip | R-1-1 | R-1-2 | R-1-3 | R-1-4 | R-1-5 | R-1-6 | R-1-7 | R-1-8 |
|---|---|---|---|---|---|---|---|---|
| AVL | 1 | 2 | 7 | 3 | 2 | 10 | 4 | 10 |
| MTR | 1.82 | 1.98 | 1.94 | 1.92 | 2.14 | 2.01 | 1.98 | 1.59 |
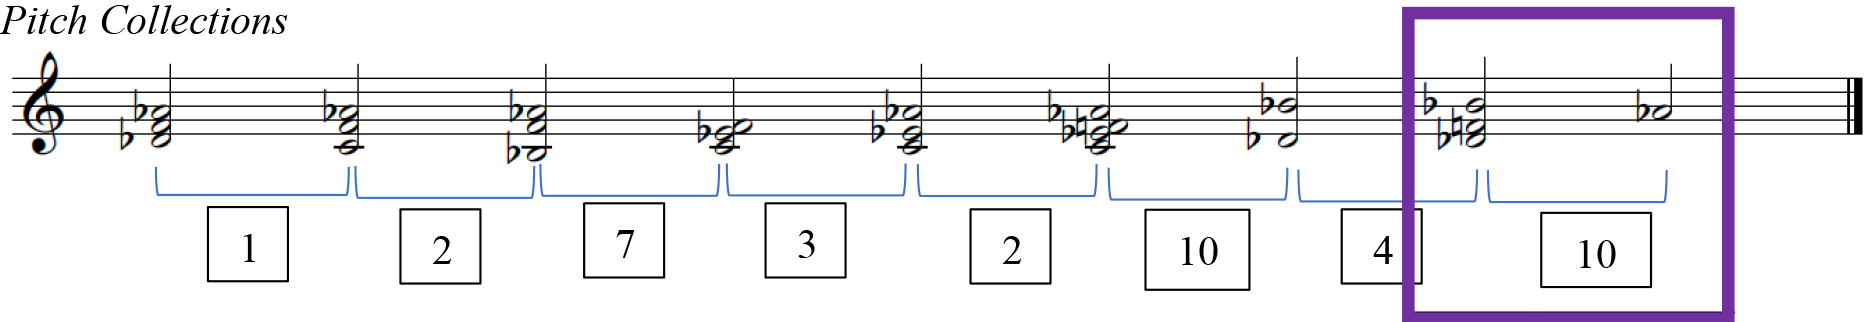
Similarly, with R-3-6, which also contains a small tension rating value, this is supported by a large value from the model, AVL 13, and this also marks a shift from a PCn containing four notes in a chord to a single note. At this point in the music, R-3-6 coincides with the end of the two-bar figure, where both treble and bass arrive on E. This highlights the importance of the slur marking in bar 40, to phrase off that particular moment. Therefore, in this instance, the lower tension rating value perceived by listeners can be accounted for in conjunction with other surrounding musical parameters. 24
Fig. 12: Ravel, Bars 39–42.
| Clip | R-3-1 | R-3-2 | R-3-3 | R-3-4 | R-3-5 | R-3-6 | R-3-7 | R-3-8 | R-3-9 | R-3-10 |
|---|---|---|---|---|---|---|---|---|---|---|
| AVL | 4 | 3 | 2 | 5 | 0 | 13 | 9 | 3 | 6 | 3 |
| MTR | 3.27 | 3.25 | 3.03 | 3 | 2.41 | 1.54 | 3.75 | 3 | 3.43 | 2.76 |
Whilst two instances of competing results have been identified in the Ravel excerpts, R-3-7 reveals a large tension rating value alongside a large AVL value from the model calculations. R-3-7 contains a shift from a single pitched sonority to a four-note PCn, but this raises the issue of whether listeners are giving this sound clip a higher tension rating value due to a presence of more notes or simply because the contents of second PCn is perceived to be more tense. 25 In the third excerpt (R-3-1 to R-3-10), participants identified a high tension rating value (3-4) in R-3-1 to R-3-4, and it is interesting to highlight that the tension rating decreases each time: 3.27, 3.25, 3.03 and 3. The decrease in the tension rating initially correlates with the model tension's decrease (up till R-3-3) but it is peculiar that what's perceived to be a "large" amount of tension is actually reflected in the model as a slightly smaller movement. 26 This is evident particularly in R-3-3 where listeners rated the clip as MTR3.03, but this may have been attributed to the additional presence of F sharp in the second PCn. Through these four examples, it can be seen perhaps that a higher MTR can be attributed to the groups of seconds within the PCn. However, this contradicts the statement made earlier on how successive PCns with small movement in the soprano line tend to correlate with a lower tension rating value, therefore reinforcing the notion that other parameters need to be considered as well. In the second excerpt, there is a high tension rating value on R-2-5 and R-2-6. The mean tension rating value for R-2-6 correlates with the model's larger numerical value, whilst the model tension for R-2-5 denotes a smaller value. It could perhaps be argued that listeners may have rated R-2-5 with a higher tension rating value due to the consecutive stacks of 2nds clustered together within the PCn.
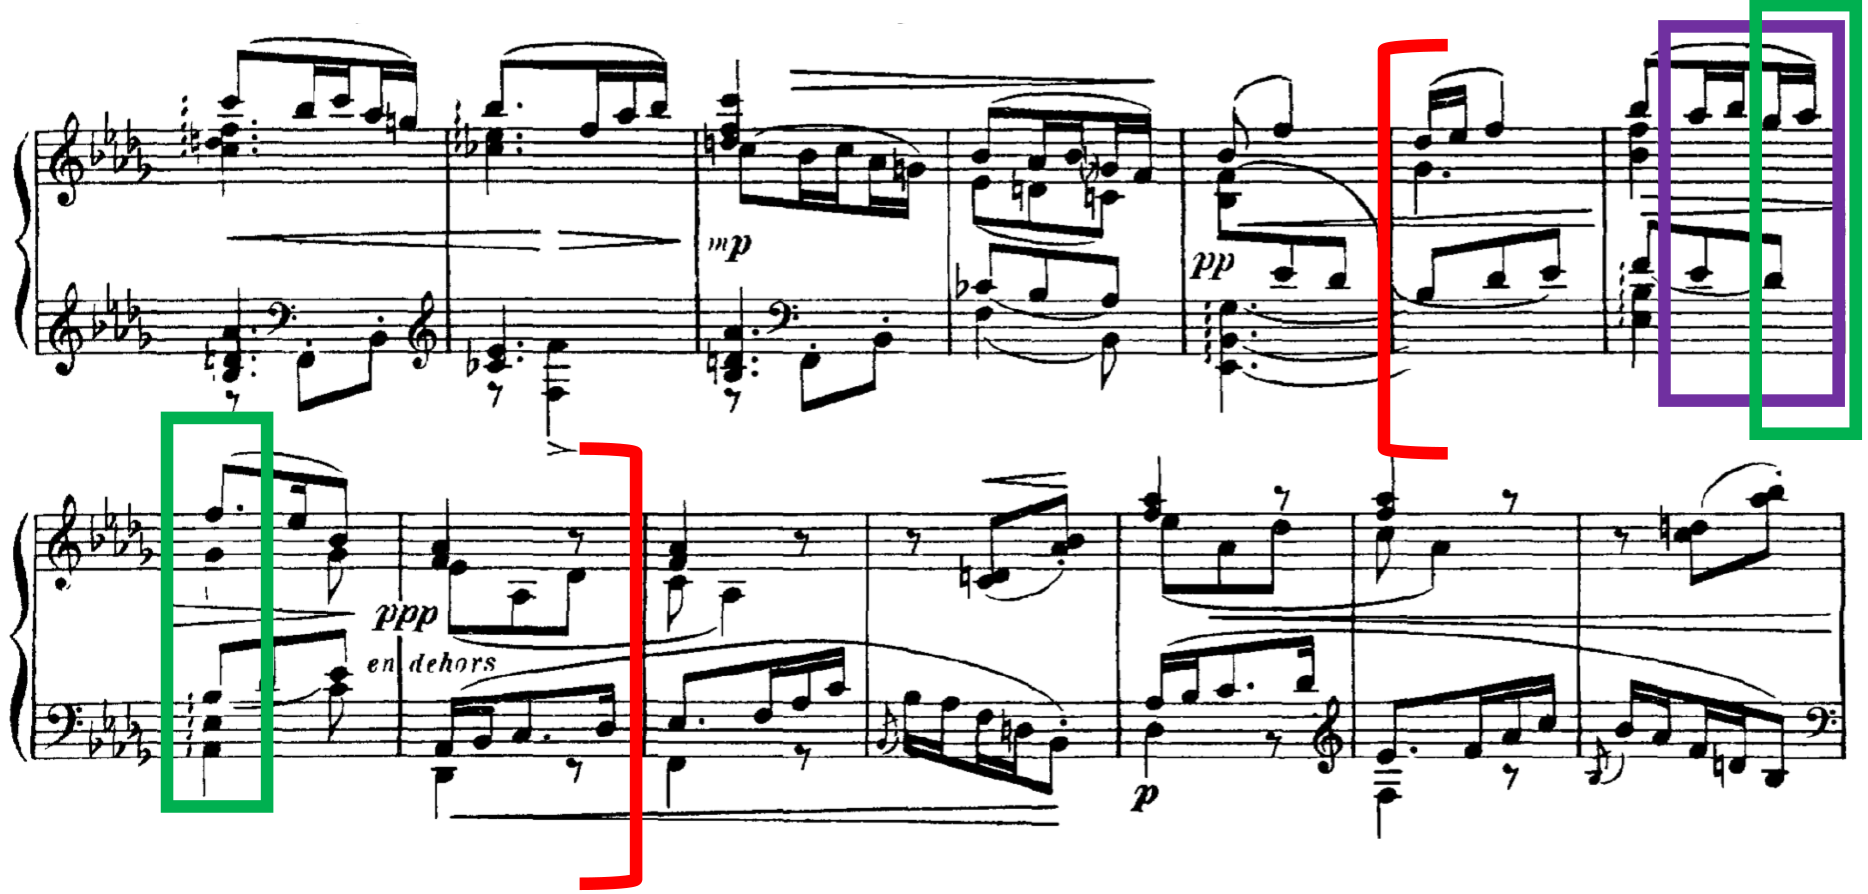
Fig. 14: Ravel, Bars 24–27.
| Clip | R-2-1 | R-2-2 | R-2-3 | R-2-4 | R-2-5 | R-2-6 | R-2-7 | R-2-8 | R-2-9 |
|---|---|---|---|---|---|---|---|---|---|
| AVL | 1 | 0 | 3 | 2 | 3 | 6 | 4 | 4 | 4 |
| MTR | 2.97 | 2.92 | 2.17 | 2.57 | 3.06 | 3.32 | 2.82 | 2.68 | 2.01 |
Another interesting point can be seen in the second Ravel excerpt, where there is a larger tension rating value in R-2-1 and R-2-2 despite the small value from the model. The first clip, R-2-1, comprises a movement of a semitone (1) whilst the second clip, R-2-2, retains the same pitches. The MTR values are 2.97 and 2.92 respectively. This then suggests that even if outer voice movement (especially in the soprano line) is not the primary factor in determining tension, the density of the chords plays a role in determining post-tonal tension. The presence of more pitches as well as intervallic movements of a second within the PCn could attribute to how one perceives tension. The same observation is also extended to the third excerpt in R-3-5, where the model tension value is 0 whilst the MTR is 2.41.
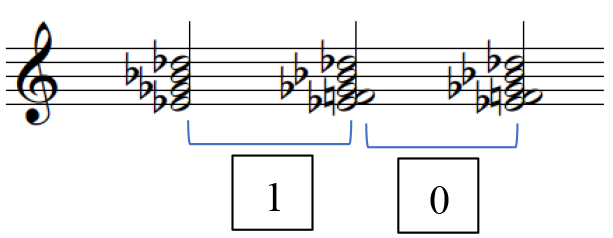
Fig. 16: Model Results and Pitch Collections – Ravel, Excerpt 2, R-2-1 and R-2-2.
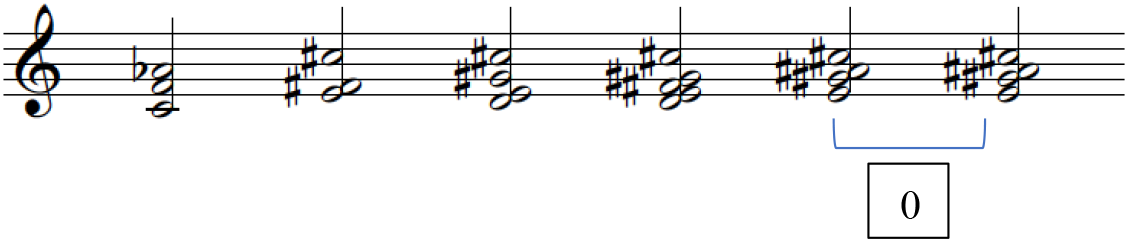
Fig. 17: Model Results and Pitch Collections – Ravel, Excerpt 3, R-3-5.
EXCERPT 3: STRAVINSKY, CONCERTO FOR PIANO AND WIND INSTRUMENTS

Fig. 18: Model VS Mean Tension – Stravinsky.
From the diagram, we can firstly identify that there are higher tension rating values in the Stravinsky excerpts than Hindemith and Ravel. This can especially be seen where listeners used the higher end of the spectrum for Stravinsky as opposed to the other two composers. Interestingly, this aligns with the composers' harmonic idioms as Stravinsky employs more chromaticized and "extended" harmonies than Ravel and Hindemith whose harmonic idioms are more tonally based. Furthermore, as these PCns are unaltered and derived at face value, listeners will naturally tend to pick up more dissonance in Stravinsky and dissonance is known to contain more tension than consonant triads (Kamien, 2008; Kliewer, 1975; Parncutt & Hair, 2011). On the whole, participants have generally rated the excerpts with a low to medium tension ratings more frequently. It is also interesting to highlight that with this Stravinsky, the use of tension rating 5 is used more than the previous excerpts. One possible reason may be due to the increased number of stacked seconds within the PCn as well as a denser PCn. For instance, in the third excerpt, R-3-7 and R-3-10 contain a large tension rating and both clips contain a stacked second alongside the archetypal stacks of thirds within the second PCn. 27
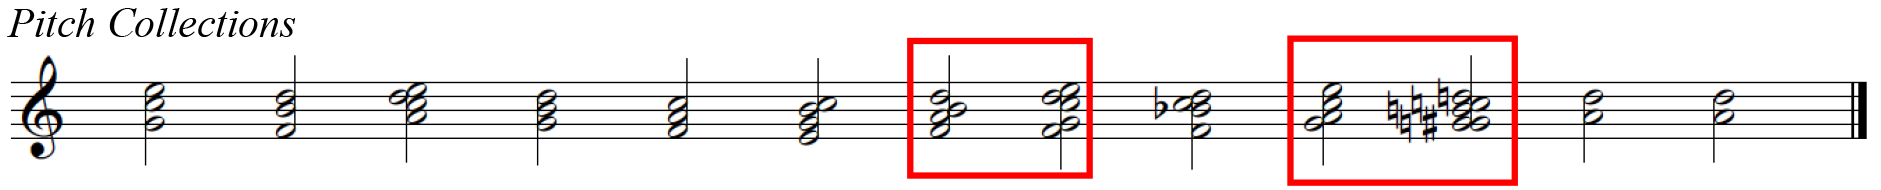
Fig. 19: Stravinsky, Excerpt 3, R-3-7 and R-3-10.
From the MTR of the Stravinsky excerpt, it can firstly be seen that S-2-10, S-3-12 and S-1-7 contain the lowest ratings from participants, implying a low amount of tension. Again, no clear pattern between AVL and mean tension ratings emerge (r[27]=0.043, p = 0.823). With the first clip, S-2-10, this is also supported by a low AVL movement from the model, AVL3. When relating this particular moment to the music, this moment coincides with the end of a phrase as well as the end of the musical idea. However, the low tension rating could also be attributed to the shift from a PCn to a single note. With R-3-12, this is supported by AVL0 from the model and it can be seen that there is a direct correlation between the model and mean tension there is no movement between the pitch collections. Interestingly, this also coincides with the start of a new phrase, which suggests that the phrase begins on a low amount of tension. And as for S-1-7, this is supported by a large value from the model, AVL9. This may be attributed to the shift from a 3-note PCn to a single note. This again exemplified how a large AVL value from the model does not necessarily have to evoke more tension, but it could represent the opposite, simply marking a pivotal moment in the music. Incidentally, when relating this back to the music, this also coincides with the start of a new phrase as well.
In this excerpt, four clips have been identified by participants as containing a higher tension rating value: S-2-4, S-2-3, S-1-3 and S-1-4. With the first excerpt, S-1-3 and S-1-4 are supported by AVL6 and 4 respectively from the model. Within its individual movements, S-1-3 contains a shift from a sound that can be described as containing "consonant" qualities to a more dissonant sound, where there is a "clash" between G♯ and G. S-1-4 contains a movement of two consecutive dissonant sonorities. With the second excerpt, S-2-3 and S-2-4 are supported by AVL 5 and 7 respectively from the model. Both sound clips contain PCns that can be described as dissonant due to the presence of stacked second intervals. These two sound clips also demonstrate that despite the small movement in the soprano voice, listeners can hear the dissonance in the inner voices, which resulted in the high-tension rating. This could therefore suggest that register and small voice-leading movement in the soprano voice may not be a primary factor in determining post-tonal tension.
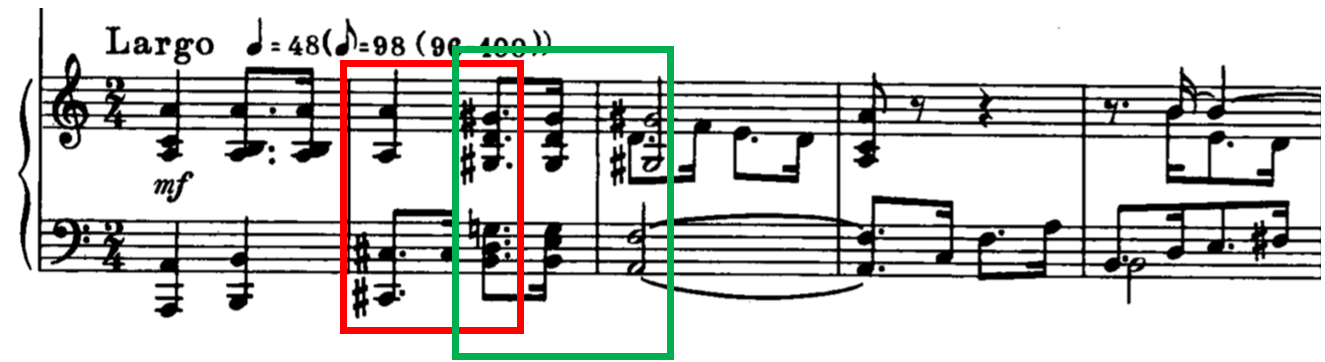
Fig. 20: Stravinsky, Bars 1–5.
| Clip | S-1-1 | S-1-2 | S-1-3 | S-1-4 | S-1-5 | S-1-6 | S-1-7 |
|---|---|---|---|---|---|---|---|
| AVL | 1 | 2 | 6 | 4 | 3 | 6 | 9 |
| MTR | 2.254 | 1.9683 | 3.9048 | 3.9048 | 3.2381 | 1.9683 | 1.4921 |
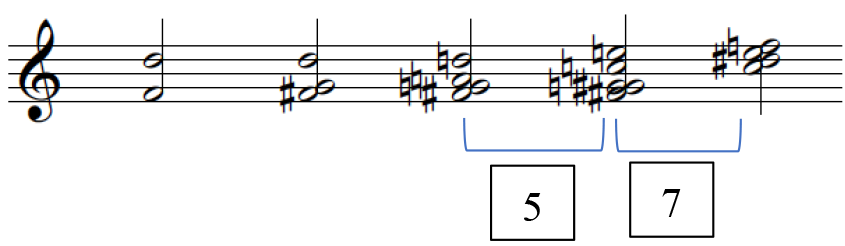
Fig. 22: Model Results and Pitch Collections – Stravinsky, Excerpt 2, S-2-3 and S-2-4.
Additionally, it can be pointed out that S-2-9 contains an MTR of 1.7, correlating with the model tension, AVL2. When relating this back to the music, this PCn occurs at the end of the phrase, there are fewer notes in the second PCn and it can be described as more "consonant" as well.
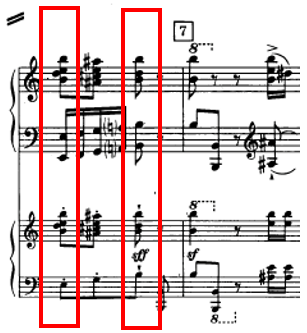
Fig. 23: Stravinsky, Bars 43–44.
| Clip | S-2-1 | S-2-2 | S-2-3 | S-2-4 | S-2-5 | S-2-6 | S-2-7 | S-2-8 | S-2-9 | S-2-10 |
|---|---|---|---|---|---|---|---|---|---|---|
| AVL | 2 | 4 | 5 | 7 | 7 | 1 | 3 | 5 | 2 | 3 |
| MTR | 3.2698 | 2.9048 | 4.0635 | 4 | 3.254 | 2.5556 | 3.2222 | 2.127 | 1.746 | 1.3968 |
There are also some instances where the model tension does not correlate with the perceived tension. Firstly, with S-2-5 and S-3-11, the model tension produces a large value but perceived tension indicates a smaller value. With S-2-5, containing an MTR of 3.25, whilst the smaller perceived rating coincides with the end of the subphrase, listeners may have associated the movement between the two PCns a lot lower due to the presence of repeated pitches. And with S-3-11, which contains an MTR of 2.15, contains a shift from a larger to smaller PCn (5 to 2 notes), a "consonant" P4 interval. This again reinforces the earlier observation that listeners may tend to associate consonant sounds and a shift from larger to smaller PCn as less tense.
| Clip | S-2-1 | S-2-2 | S-2-3 | S-2-4 | S-2-5 | S-2-6 | S-2-7 | S-2-8 | S-2-9 | S-2-10 |
|---|---|---|---|---|---|---|---|---|---|---|
| AVL | 2 | 4 | 5 | 7 | 7 | 1 | 3 | 5 | 2 | 3 |
| MTR | 3.2698 | 2.9048 | 4.0635 | 4 | 3.254 | 2.5556 | 3.2222 | 2.127 | 1.746 | 1.3968 |
| Clip | S-3-1 | S-3-2 | S-3-3 | S-3-4 | S-3-5 | S-3-6 | S-3-7 | S-3-8 | S-3-9 | S-3-10 | S-3-11 | S-3-12 |
|---|---|---|---|---|---|---|---|---|---|---|---|---|
| AVL | 5 | 4 | 5 | 6 | 4 | 5 | 4 | 5 | 6 | 3 | 7 | 0 |
| MTR | 2.0159 | 3.2063 | 1.7143 | 1.6984 | 2.619 | 2.8889 | 3.3333 | 2.0952 | 2.8571 | 3.6508 | 2.1587 | 1.5714 |
Secondly, there are instances where the model tension produces a smaller value (up to AVL2) and perceived tension indicates a larger value. With S-2-1, which contains an MTR of 2.9, we can see that the two PCns are similar. What differs between the two is that the second PCn contains an F sharp (instead of an F in the first PCn) with an additional G. As such, the additional note to the second PCn and the chromatic shift may have influenced listeners' tension rating responses. With S-2-6, which contains an MTR of 2.5, the rating may have been a result from the absence of B in the second PCn, which brings out the augmented 2nd interval, therefore resulting in a higher tension rating value.
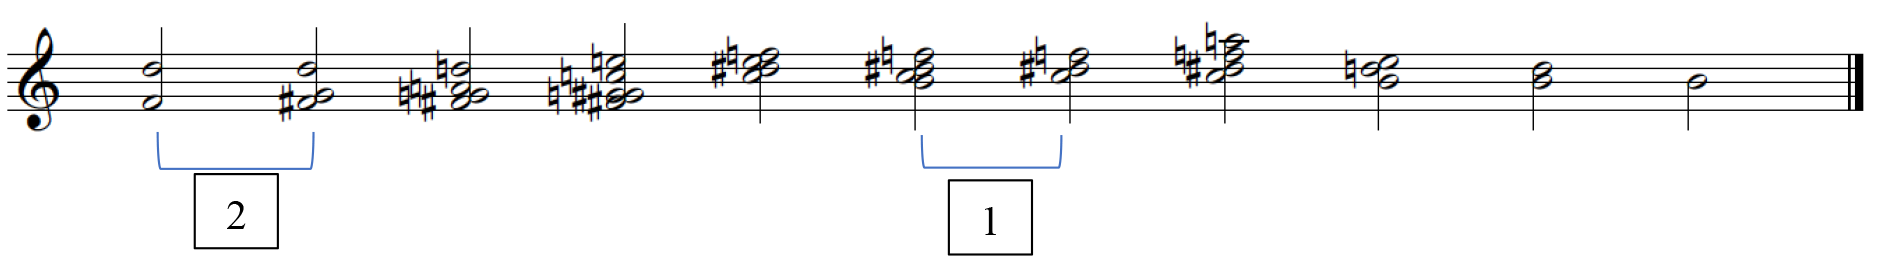
Fig. 27: Model Results and Pitch Collections – Stravinsky, Excerpt 2, S-2-1 and S-2-6.
Furthermore, when there are instances where there is no movement or just a semitonal movement between PCns, it is interesting to observe how this is reflected in the tension rating values. With S-1-1 which contains a semitonal shift in the soprano voice, this correlates with an MTR of 2.25. Whilst this coincides with the development of the phrase in the music, the higher tension rating contrasts the model results, suggesting that the quality of the PCn plays a role in how one perceives tension in the PCn movement. This is also reflected in S-1-2, where a small model result is correlated with a small tension rating as well. It is also interesting to examine S-3-1 and S-3-4 as both contain small tension rating with PCns that would be typically characterized as consonant – e.g. G to F major chords in S-3-4. 28
Roughness and Mean Tension
As roughness has been reported to be one of the key factors to influence listeners' perception 29, a series of charts depicting roughness of the last chord of each pitch collection were produced.
EXCERPT 1: HINDEMITH, PIANO SONATA NO. 2.

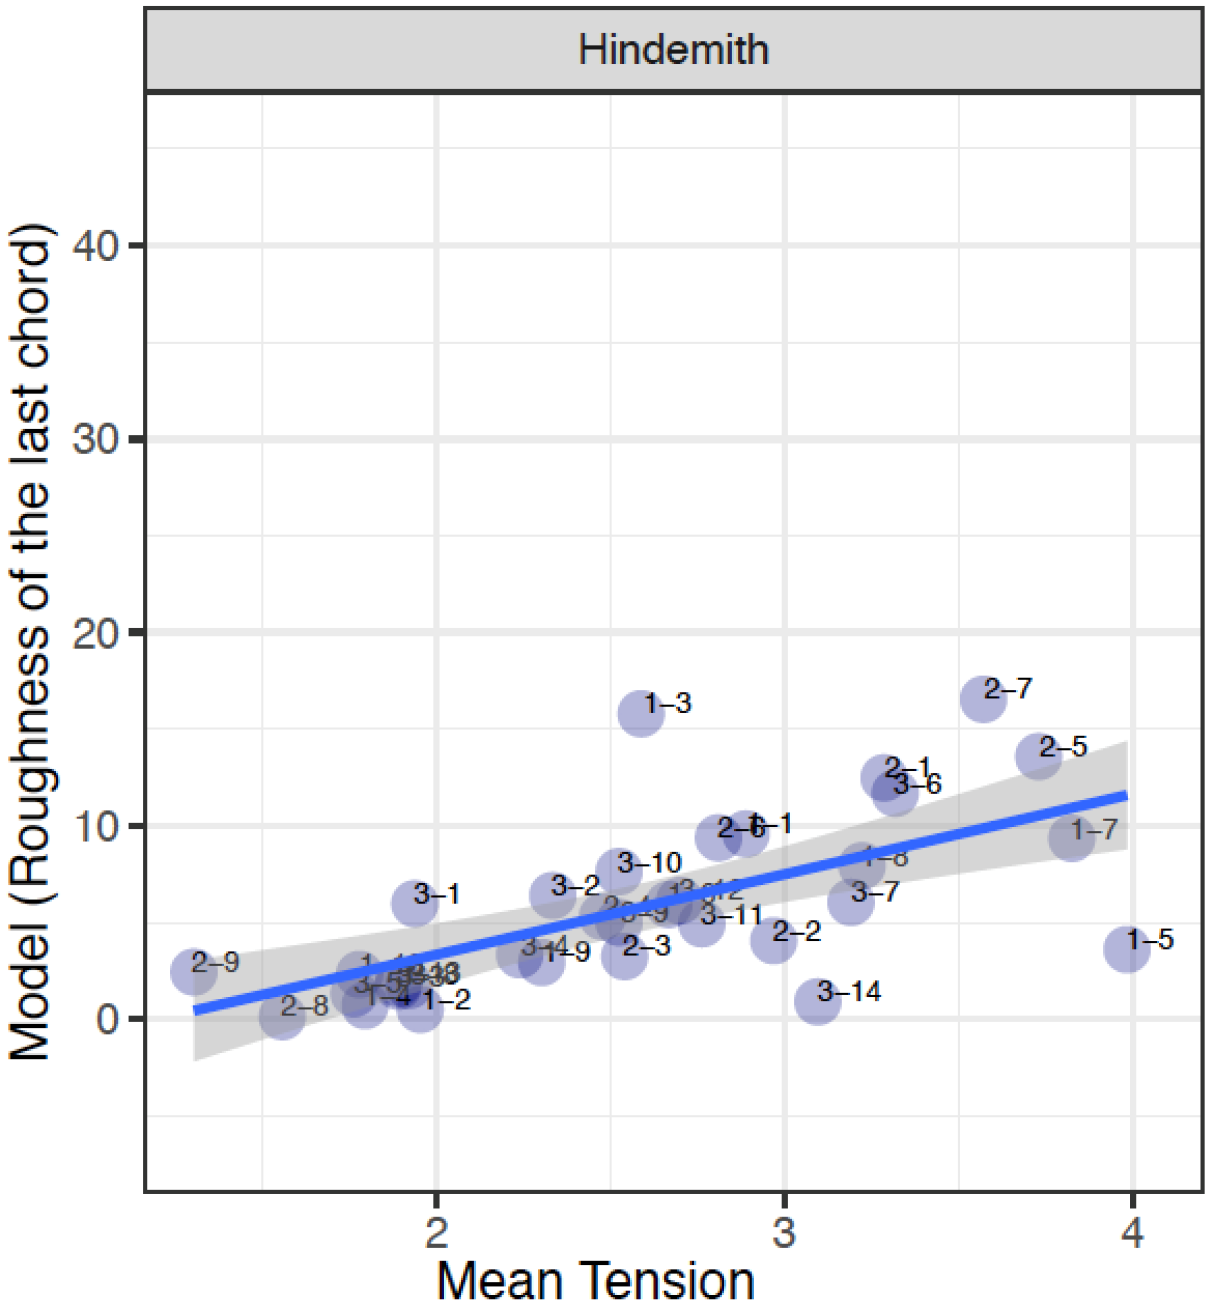
Fig. 28: Roughness and Mean Tension – Hindemith.
EXCERPT 2: RAVEL, MOUVEMENT DE MENUET FROM "SONATINE"

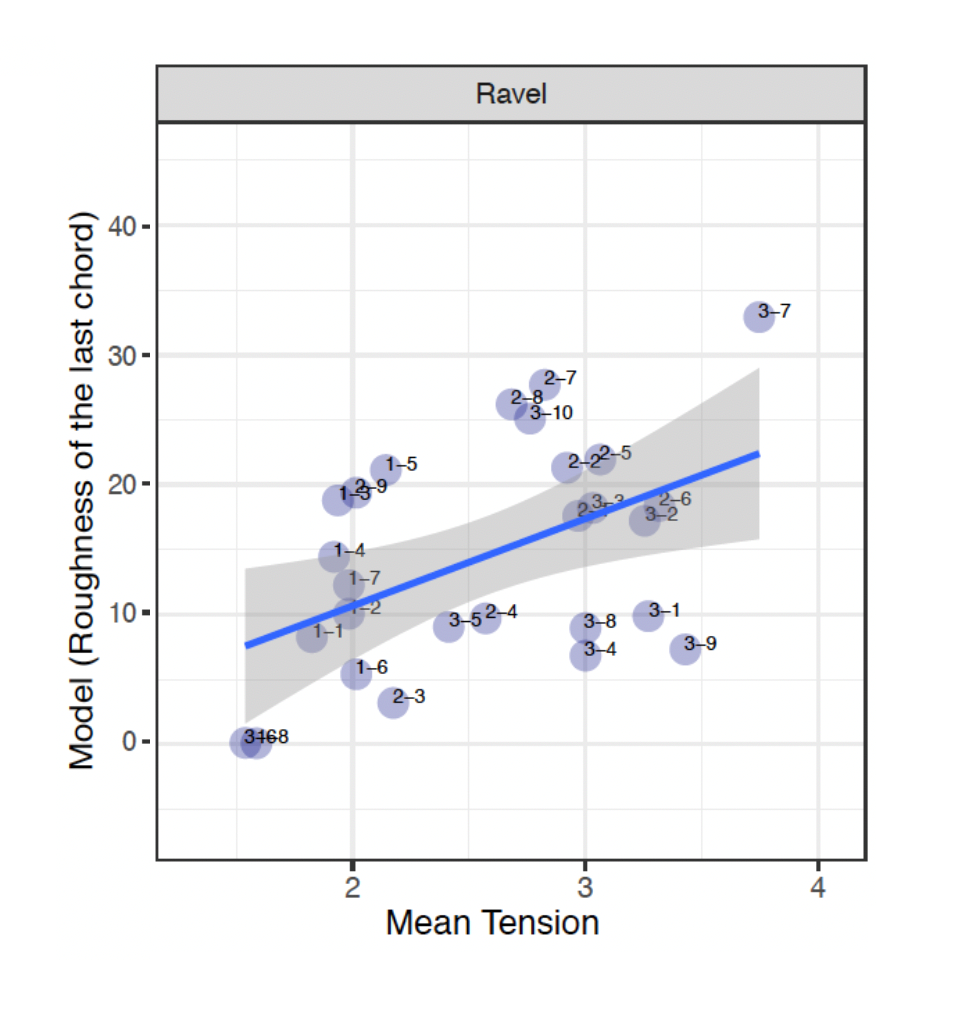
Fig. 29: Roughness and Mean Tension – Ravel.
EXCERPT 3: STRAVINSKY, CONCERTO FOR PIANO AND WIND INSTRUMENTS
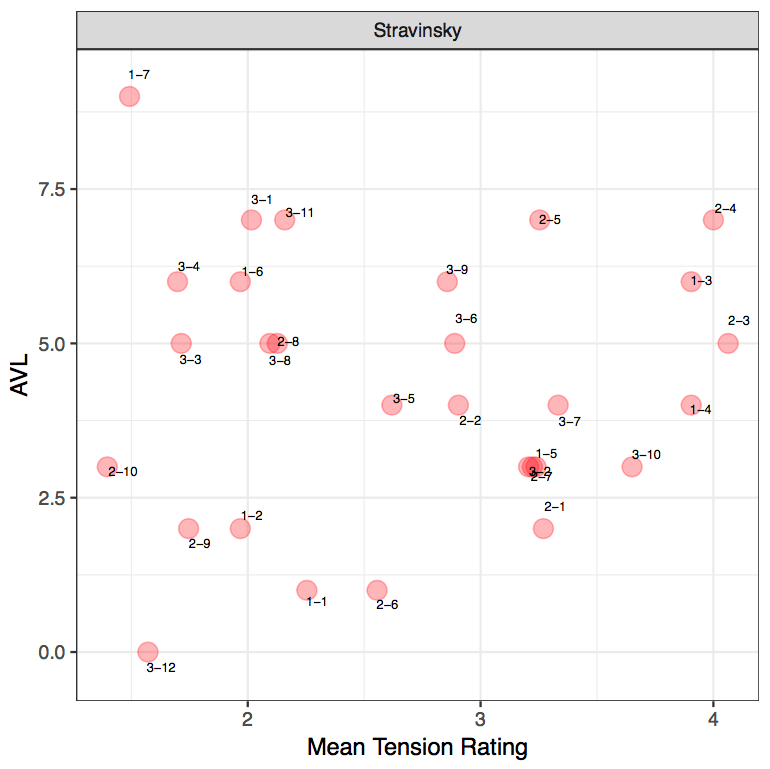
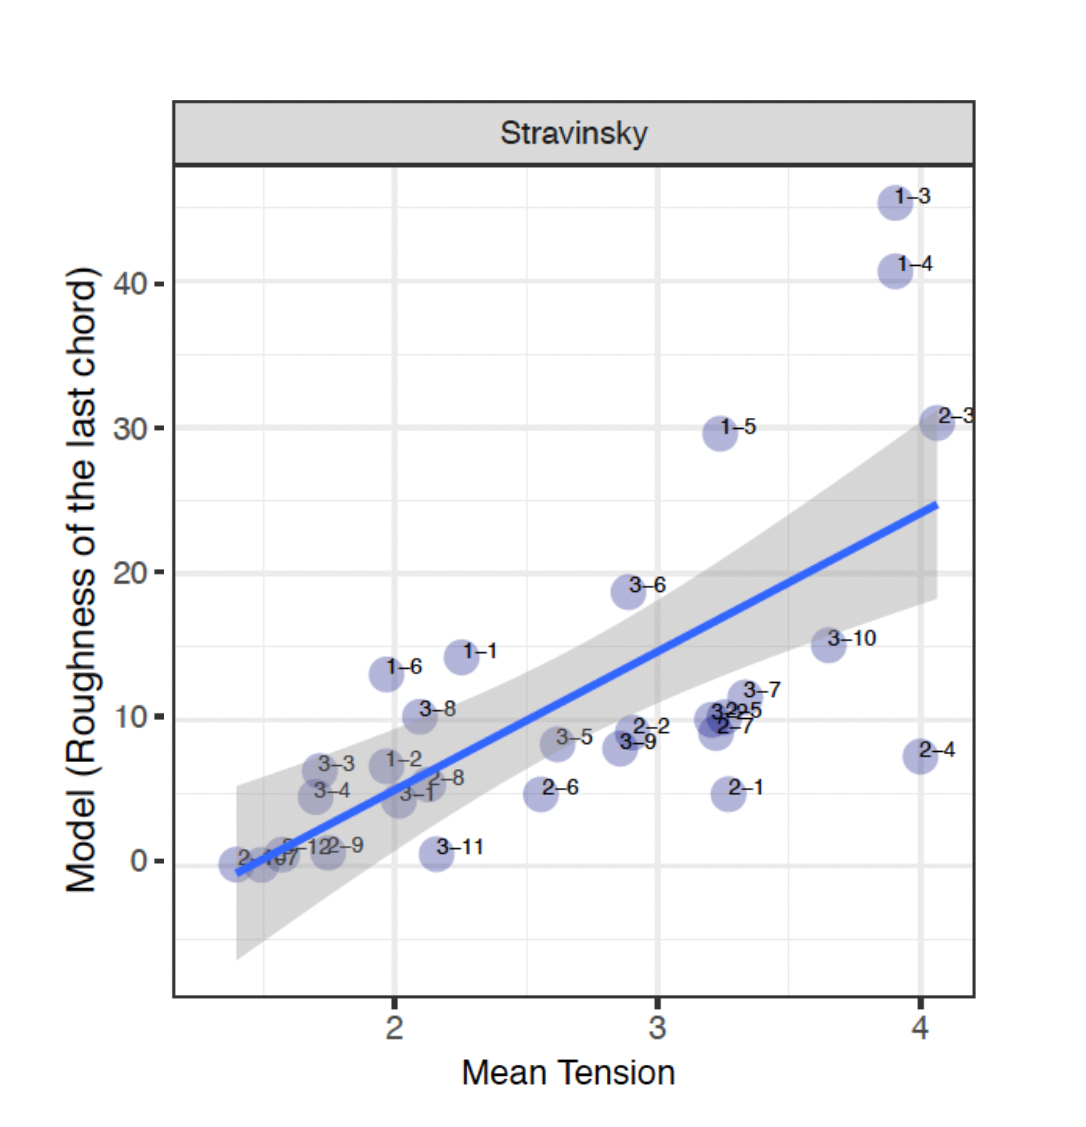
Fig. 30: Roughness and Mean Tension – Stravinsky.
In the Stravinsky excerpts, accounting for roughness yielded results that both corroborate and contrast with the model and mean tension. The close link between a larger amount of roughness and dissonance 30 can be seen in sound clips S-1-3, S-1-4 and S-2-3. The larger amount of roughness in the last PCns of these sound clips directly correlate to common perceptions of dissonance. This could indicate that listeners have a preconceived notion of consonant and dissonant sounds and are able to distinguish the two apart. The same can be stated with S-1-5, however, this does not correlate with the model tension, as it is situated on a smaller AVL value, 3.
On the other side of the spectrum, it can be observed that a smaller amount of roughness correlates with a shift from "dissonant" to "consonant" PCn. As shown through the MTR and roughness value of S-3-11 (which doesn't correlate with the model), the movement between the first and second PCn supports coincides with a shift from a large PCn to two notes, which also forms a P4. This could indicate that there are two factors which may possibly account for its smaller roughness content, its consonant and dissonant quality as well as a reduced number of notes. depicting a P4.
Despite the close interrelationship that can be seen between the amount of roughness to consonance and dissonance, there were some anomalies. As shown in Figure 31, S-2-4 contains a large MTR but coincides with low roughness content. The first PCn of S-2-4 can arguably be described as dissonant, due to the presence two stacked intervals of a 2nd, where one of which is an augmented 2nd and the other is a minor 2nd. This is then resolved by an unconventional "triad" – B-D sharp-F – with an added second, C. This could potentially disprove the notion that dissonance is directly correlated with high roughness. It may be the case that the second chord is perceived to be more stable due to the stacked thirds, as well as the slight descent in the melodic contour in the inner voices. The same can be applied to sound clip S-3-10, where the larger roughness content correlated with an MTR of 3.65, reinforcing the idea that dissonance is not the only factor in a larger roughness content and melodic contour could be a factor (a descent in the inner voices). In all, it can be seen that in most cases, roughness correlates with the MTR results but not all the time with the model tension, highlighting some discrepancies between theoretically derived notions of tension and perceived tension.
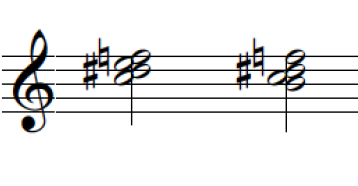
Fig. 31: S-2-4
In the Hindemith excerpts, again we can find instances where the roughness of the last chord correlates with the mean and model tension. Firstly, H-2-7 presents a higher roughness rating against an AVL5 and MTR of 3.57. The correlation of all three factors especially when placed back to its musical context, we can observe that this coincides in the middle of a subphrase, the climactic point of the section. The presence of additional notes in the second PCn, multiple stacks of 2nds of varying quality (major, minor, augmented) can be attributed to its higher roughness value. The soprano voice, F, remains the same, yet it can inevitably be argued that the higher roughness value is attributed to the presence of more inner voices.
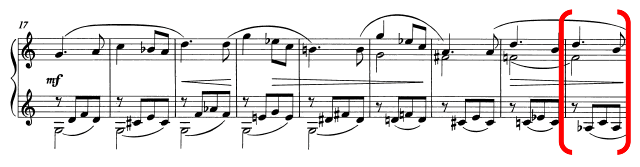
Fig. 32: H-2-7
There are however, instances where the roughness values do not correlate with mean and/or model values. For example, H-1-3 contains a higher roughness value, but this is supported by MTR 2.58 and AVL 3. H-1-3 comprises PCns that contains two notes, the first of which is a P5 and the second a m7. It can perhaps be argued in this case, there is a correlation between a minor 7th interval to notions of dissonance and larger roughness values. Within its musical framework, the higher roughness value does however demonstrate the importance of A (part of the second chord), the change of one note between the two PCns.
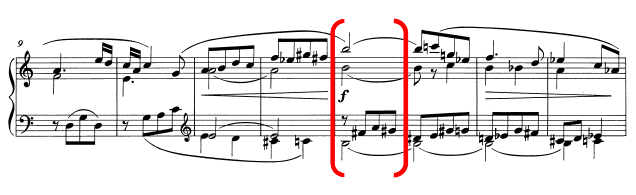
Fig. 33: H-1-3.
Similarly, in H-3-14, this contains a smaller roughness value but this is supported by an above average MTR of 3.09 and an AVL of 4. It is interesting to firstly point out that there are fewer notes in the second PCn, two notes comprising a major 2nd, and the first PCn comprises three notes, A♭-E♭-G♭. It might be the case that a lower roughness value in this context coincides with fewer notes as well as a "more consonant" interval – as major 2nd can arguably be perceived as more consonant than a minor 2nd interval. Therefore, in this instance, we have a correlation between mean and model value but the roughness value can be perceived as an anomaly.
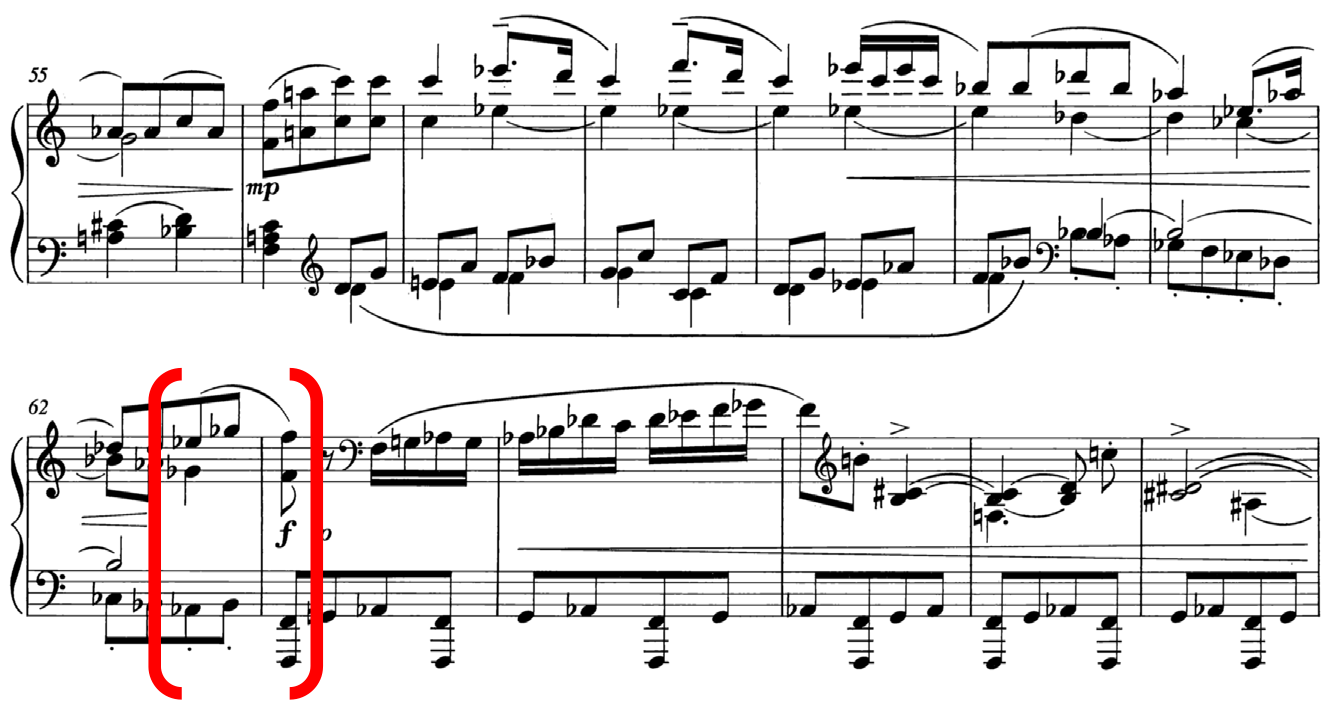
Fig. 34: H-3-14.
Again, H-1-5 presents another example of an anomaly as this clip contains a lower roughness value against a high MTR of 3.98 and an AVL of 5. Like the H-3-14 and H-1-3, it might be the case that the lower roughness value can be attributed to the consonance of the interval. The second PCn comprises, B-C-G♯, and its lowest and highest notes form a major 6th. It may be probable to state that roughness does not have a direct correlation to how one perceives tension of these PCns, although it is one of the key factors, as shown through examples that demonstrate a close interrelationship between the three factors, the model value might be a better tool to reinforce perceptions of tension. Register movement in H-1-5, an ascent in the register, could be one of the primary factors as to its higher MTR value, as well as the minor 2nd interval.
As for Ravel, the same types of observations can be made, where there are instances of similarities amongst all three parameters (R-3-7) as well as discrepancies (R-2-7, R-2-8 and R-3-10). Firstly, we can observe that R-3-7 is supported by a high roughness value as well as a large AVL of 9 and a higher MTR of 3.76. There are two distinct sets of PCns in this clip, the first of which is simply one note, E, which then progresses to a four-note collection, which can loosely be described as a C♯ minor chord with an added 2nd. Here we have an example where we have congruence amongst the three different factors used to account for tension. The same can be said for R-2-3, where a low roughness rating correlates with an MTR of 2.17 and an AVL of 3. This again coincides with tied notes as well as longer rhythmic values in the treble stave.
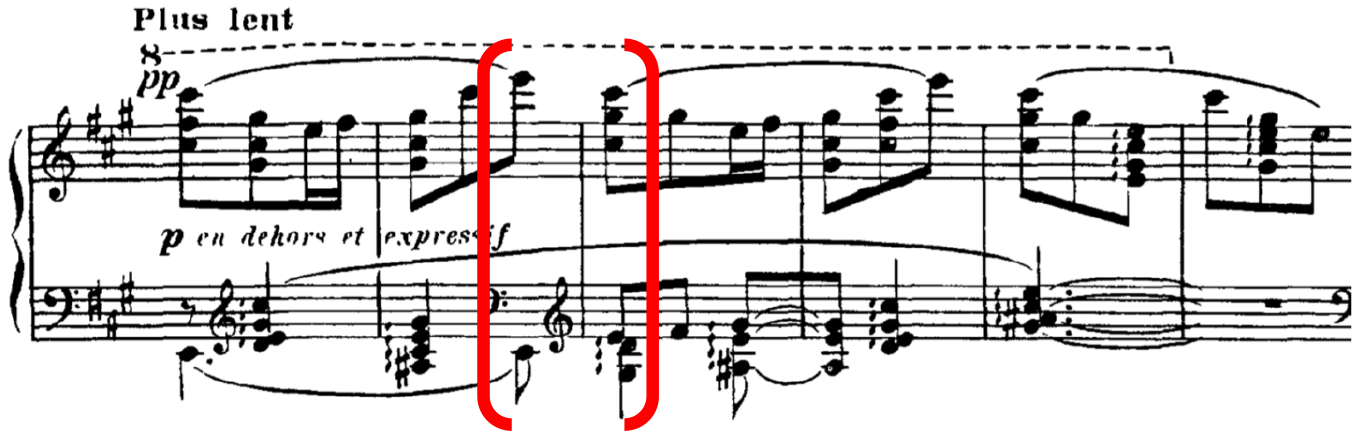
Fig. 35: R-3-7.
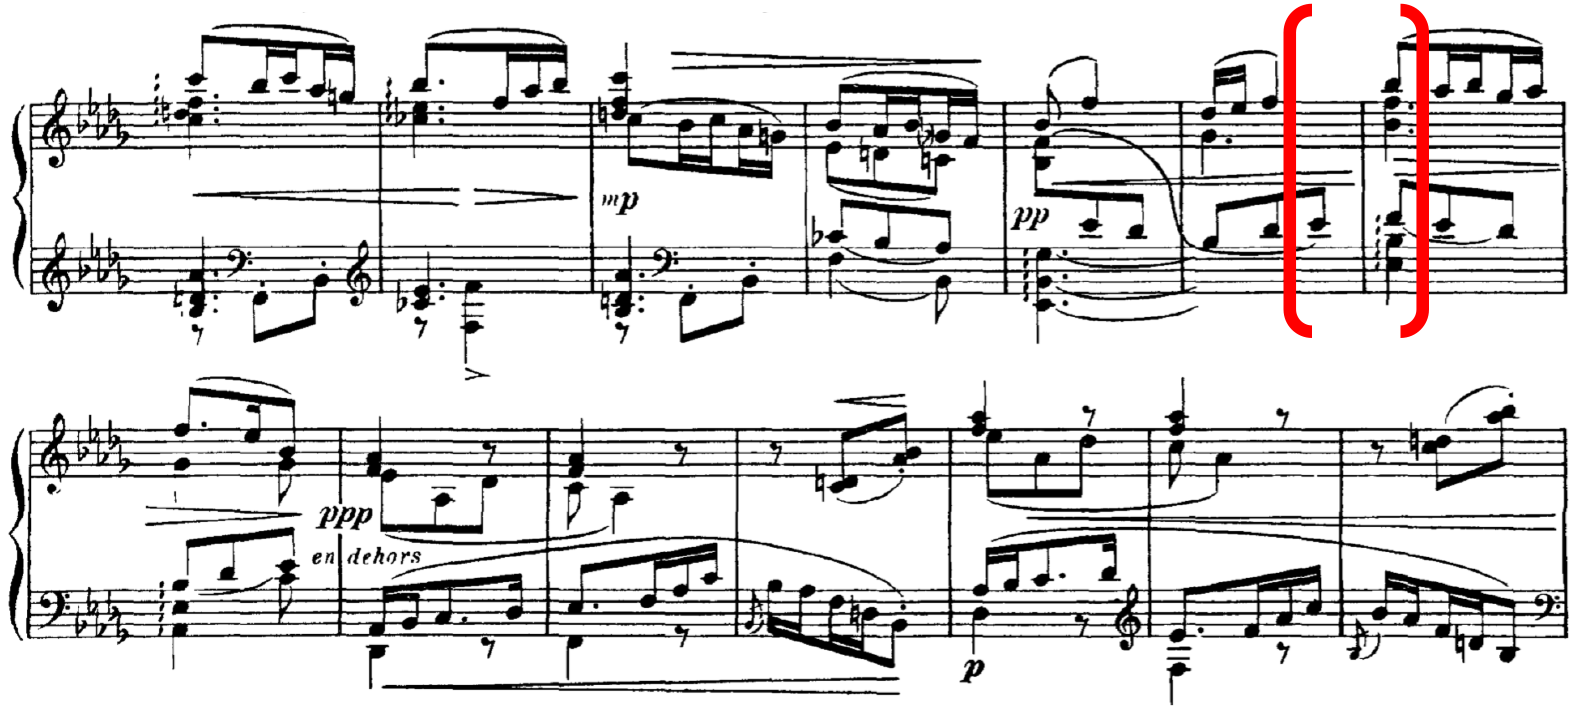
Fig. 36: R-2-3.
On the other side of the spectrum, there are some discrepancies between the roughness values and the MTR/AVL values. In the case of R-3-10, the higher roughness value correlates with an MTR of 2.76 and an AVL of 3, two values that bear no correlation to the roughness value. The higher amount of roughness in this instance can be attributed to its density, more notes in the last PCn rather than its consonant/dissonant quality as described in earlier examples. The lowest and highest of this PCn forms a major 6th, a consonant sonority, yet it contains a higher roughness value. However, when relating R-3-10 to its musical context, the higher roughness value is particularly useful in highlighting the emphasis of the PCn, the first beat of the new bar. The smaller values from the MTR and AVL of this clip can be attributed to the tied notes in the lower stave, meaning that there will be smaller in this set. Similarly, R-2-7 and R-2-8 contain higher roughness values whilst its MTR and AVL suggests otherwise. Both clips contain an AVL of 4 with MTR of 2.82 and 2.68 respectively. The lower MTR, supported by its AVL could be argued to be more suited in perceiving tension in this context when relating back to the music, but its higher roughness value does suggest a correlation with chord density to roughness.
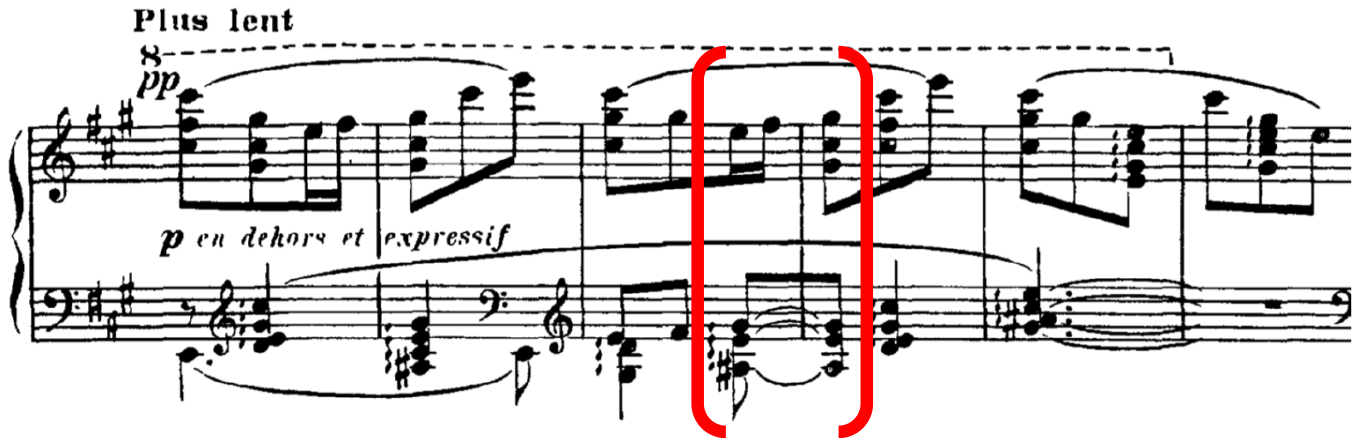
Fig. 37: R-3-10.
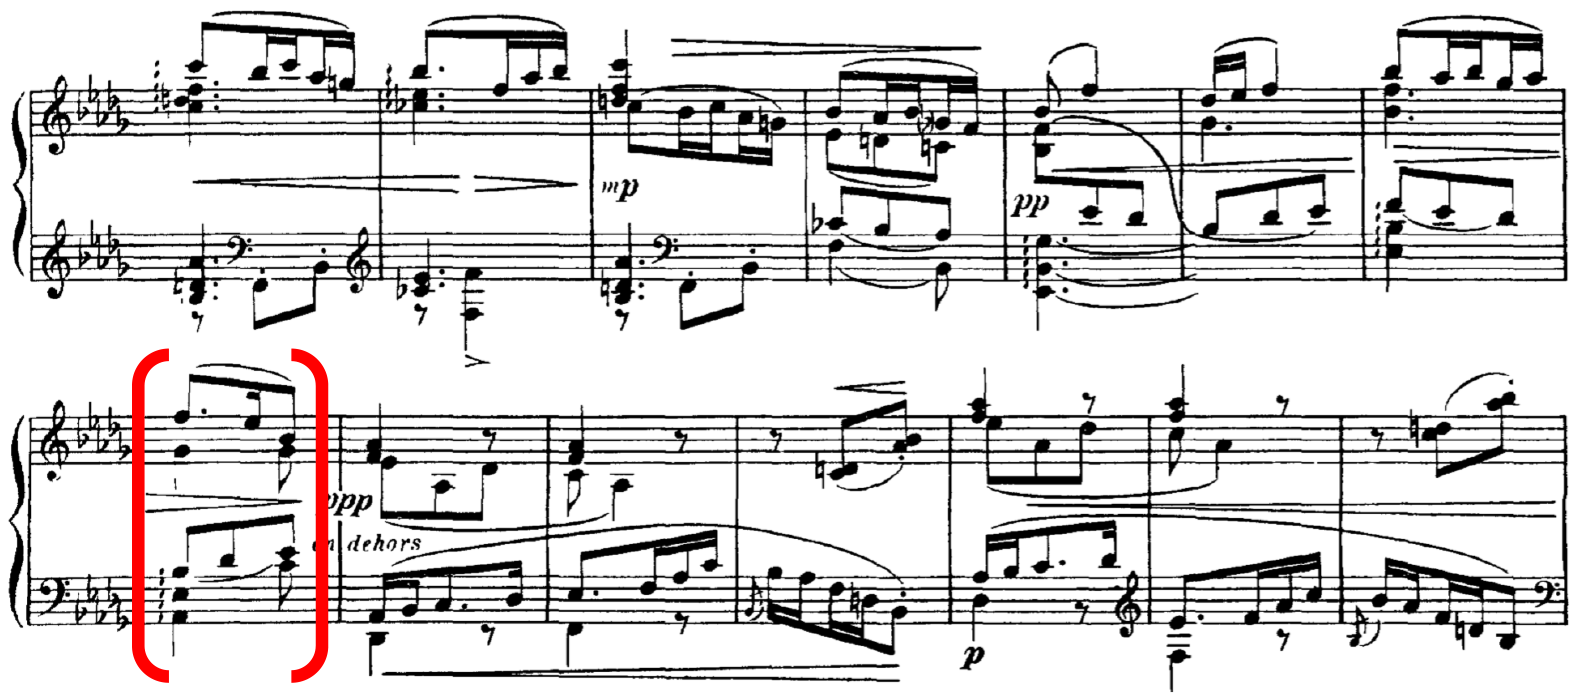
Fig. 38: R-2-7 and R-2-8.
Some further discrepancies can be seen particularly in R-1-8, where a lower roughness value as well as a low MTR (1.58) is represented by a large AVL, 10. This lower roughness and MTR value can be attributed to two factors: the reduced number of notes in the second PCn (from three notes to one), the descending contour of B♭ to A♭. The same can be stated for R-3-6 where the low roughness value and MTR of 1.54 correlates with a large AVL, 13 and its factors simply comprises the movement to a smaller PCn and a descending contour.
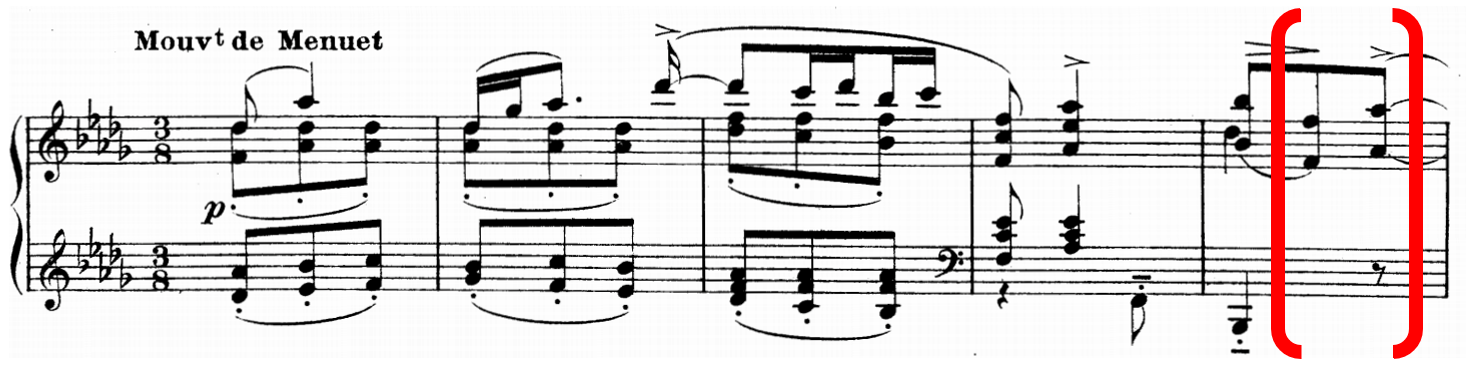
Fig. 39: R-1-8.
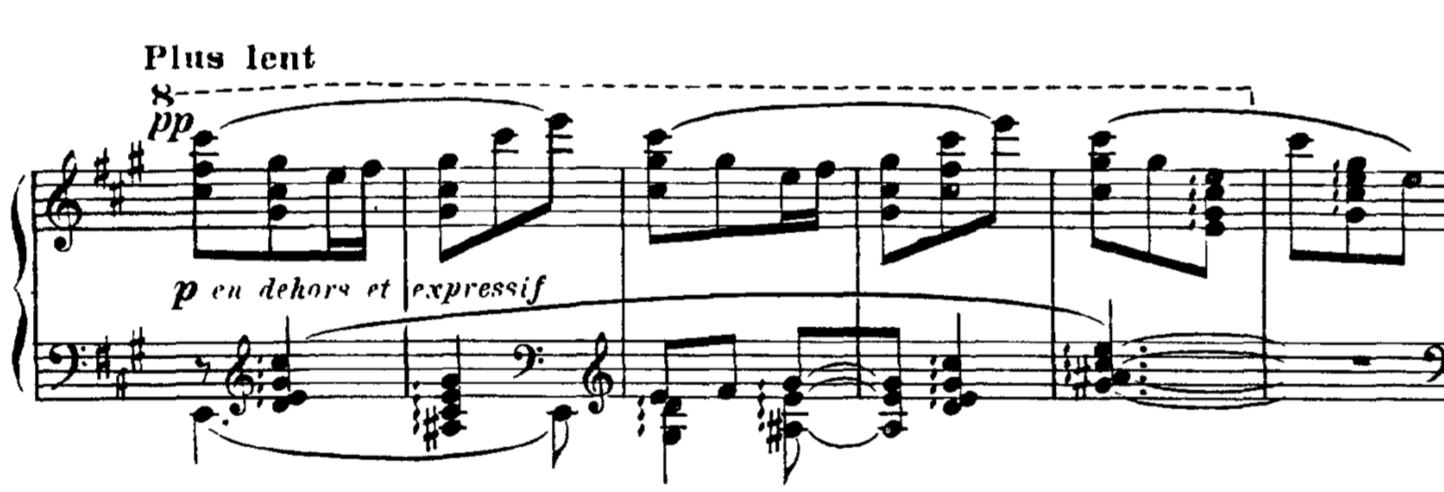
Fig. 40: R-3-6.
SUMMARY
Some general comments can be made on the relationship between MTR and AVL values. Firstly, there are instances where the model calculations (AVL) would depict a higher amount of tension whilst the perceived tension (MTR) is much lower. This simply demonstrates that VL calculations and assessing the PCns is not sufficient in determining real-time tension and release in music. Secondly, the arrangement of the PCns could also play a factor in participants' ratings. For example, in H3, the minimal movement in the progression of the individual voices within each PCn from one to the next may have impacted listeners' perception. Additionally, the number of notes within the PCn may have had an effect on how listeners perceived tension. A movement from a PCn with more notes to less notes may result in a lower MTR but the AVL might project the opposite result. Thirdly, there may also be a correlation between listeners' preconceived notions of consonance and dissonance to release and tension. This can be seen especially in S-1-2 and S-3-4 from the Stravinsky excerpts, and R-2-1, R-2-2 from the Ravel excerpts. With the Ravel excerpts, these consist of what can be generally described as dissonant sonorities, represented with a small AVL value to a larger MTR. As for Stravinsky, S-1-2 consists of a dissonant to consonant sonority, supported with a low MTR and low AVL whilst S-3-1 and S-3-4, consisting of archetypal triads, thereby suggesting consonance, was supported with a low AVL. This could therefore suggest the importance of the PCn's contents rather than its movement, as its unique quality may hold the key in influencing listeners' perception rating. For instance, there are cases of PCns that contain no voice-leading changes yet they are represented with a higher MTR.
On the whole, this study has shown that listeners' perception of tension is dependent on a few factors, ones that go beyond the mere use of AVL calculations. External factors include register (e.g. shift from higher to lower registers may result with a small MTR), number of notes (e.g. shift from a larger to smaller number of pitches in a PCn) and its pitch organization (e.g. root position triads tend to hold less tension whilst its inversions tend to be more tense).
Other variables that may better account for post-tonal tension can include chord size, range of the PCns, mean pitch and applying Krumhansl and Kessler's (1982) key profiling system. A comparative analysis between these variables (as well as MTR, AVL and roughness) illustrating the means, standard deviations and correlations with confidence intervals is presented in Table 2. From this correlation table, we can firstly observe that the roughness has a high correlation with the size of chords, thereby suggesting that the varying number of notes has an impact on listeners' perception. Secondly, there is a strong correlation between roughness and chord size to mean tension ratings, which then reinforces the importance of physical factors in perception of post-tonal harmonies. Thirdly, other physical variables such as the registral range and the tonal stability of the chords, also have a strong correlation to tension ratings as well. The tonal stability of the chords is based on the correlation with the Krumhansl-Schmuckler key profiles, which is an index frequently used to estimate the tonal stability of a section of music (refs here). This tool however, is designed to measure single tones (no, it should be used with several notes since it requires a distribution of pitch-classes to work, although the critique is still correct) to tonal key areas and the results will no doubt be rooted in tonal traditions. Applying such a tool for this study is not entirely inappropriate, given that these PCns embody both tonal and post-tonal elements. Perhaps post-tonal features could be described from analyzing other physical factors such as roughness, chord size and range. Unfortunately, based on the analysis of these additional variables, there is a stronger correlation between these physical factors to perception than simply using the AVL and roughness.
One step that can be taken further with these additional variables is to perform a regression analysis 31, using tension as the criterion and all available variable as predictors, as shown in Table 3. The regression analysis suggests that an adequate model can be created to account about 72% of the variance in the tension ratings. Furthermore, the sr2 column 32 suggests that the two factors that are most crucial in accounting for the tension ratings are the chord size and tonal stability. The signs of the beta coefficients suggest that tension is negatively linked to tonal stability whereas higher chord size, roughness, mean pitch seem to contribute to higher tension ratings. Despite the overall success of the regression model with these variables for this material, it is important to realize that the model would require more data in order to form generalized statements, for different contexts. Although the AVL loses out in the process, what this ultimately demonstrates is that unlike tonal tension, other physical and psychoacoustical factors must be analyzed and accounted for to understand the treatment of post-tonal tension, to create a better measurement.
| Variable | M | SD | Tension | AVL | Roughness | Tonal stability | Range | Mean Pitch |
|---|---|---|---|---|---|---|---|---|
| Tension | 2.60 | 0.71 | ||||||
| AVL | 4.51 | 2.85 | -.13 [-.33, .08] | |||||
| Roughness | 10.26 | 9.17 | .55** [.38, .68] | -.18 [-.37, .03] | ||||
| Tonal stability | 0.66 | 0.15 | -.45** [-.60, -.27] | -.12 [-.32, .10] | -.11 [-.31, .10] | |||
| Range | 7.22 | 2.80 | .46** [.28, .61] | -.30** [-.48, -.09] | .39** [.20, .55] | .05 [-.16, .26] | ||
| Mean Pitch | 69.57 | 4.94 | .04 [-.17, .25] | .02 [-.19, .23] | -.57** [-.69, -.41] | .01 [-.20, .22] | .08 [-.13, .28] | |
| Chord Size | 3.29 | 1.06 | .69** [.56, .78] | -.32** [-.50, -.13] | .62** [.47, .73] | .01 [-.20, .22] | .66** [.53, .76] | -.05 [-.25, .16] |
Note. M and SD are used to represent mean and standard deviation, respectively. Values in square brackets indicate the 95% confidence interval for each correlation. The confidence interval is a plausible range of population correlations that could have caused the sample correlation (Cumming, 2014). * indicates p < .05. ** indicates p < .01.
| Predictor | b | b 95% CI [LL, UL] | sr2 | sr2 95% CI [LL, UL] | r | Fit |
|---|---|---|---|---|---|---|
| (Intercept) | 2.60** | [2.52, 2.68] | ||||
| AVL | 0.03 | [-0.05, 0.10] | .00 | [.00, .01] | -.13 | |
| Roughness | 0.25** | [0.08, 0.37] | .04 | [.00, .09] | .55** | |
| Tonal stability | -0.29** | [-0.41, -0.20] | .16 | [.07, .28] | -.45** | |
| Range | 0.00 | [-0.11, 0.11] | .00 | [.00, .02] | .46** | |
| Mean Pitch | 0.19** | [0.07, 0.30] | .03 | [.00, .08] | .04 | |
| Chord Size | 0.36** | [0.24, 0.47] | .09 | [.03, .16] | .69** | |
| R2 = .725** 95% CI[.64,.82] |
Note. A significant b-weight indicates the beta-weight and semi-partial correlation are also significant. b represents unstandardized regression weights. beta indicates the standardized regression weights. sr2 represents the semi-partial correlation squared. r represents the zero-order correlation. LL and UL indicate the lower and upper limits of a confidence interval, respectively.* indicates p < .05. ** indicates p < .01.
Conclusions
This study examined listener judgements of musical tension for selected segments from three selected neoclassical works: the first movement from Hindemith's Second Piano Sonata, Mouvement de Menuet from Ravel's Sonatine, and the first movement from Stravinsky's Concerto for Piano and Wind Instruments. The focal point of this study was to investigate an unexplored aspect of tension: the perception of harmonies in music that embodies both tonal and post-tonal features, how listeners would perceive tension without reference to a tonal center. The methodology employed is novel, drawing upon the AVL, an element from a hybrid theoretical model (comprising elements from Schenkerian, neo-Riemannian and pitch-class set theories), by calculating the individual VL movement between each segmented vertical sonority, PCn. This therefore provided a renewed perspective on how tension is reflected in listeners' musical perceptions from this repertoire.
The experiment required participants to: firstly, listen to an extract consisting of a series of pitch collections; and secondly, listen to a smaller clip from the extract, consisting of two PCns and rate how tense the progression was from the first to the second PCn, using a rating scale (1 to 5). From carrying out this study, the results revealed that the AVL cannot be the sole factor in determining tension in post-tonal harmonies and other secondary, or for a better word, psychoacoustical and as well as the chords' physical factors reveal more insights. These factors include measuring the chords' roughness, mean pitch, range (e.g. shift from higher to lower registers may result with a small MTR), number of notes (e.g. shift from a larger to smaller number of pitches in a PCn) and its pitch organization in terms of tonal stability (relating back to Krumhansl and Kessler's 24 key profiles). The results of examining these additional variables through a correlation and regression analysis revealed that the two main factors to better account for listeners' perceptions to the stimuli set are chord size and tonal stability.
As this study focuses purely on one parameter – harmony – in an attempt to measure how we perceive post-tonal tension, future studies can be explored and expanded to several directions. It is clear from established studies that other parameters such as rhythmic and metric influences need to be accounted for when analyzing our perception from tension. One possibility could be through Volk's (2008a, 2008b) computational model, "Inner Metric Analysis," and combining the model with the voice-leading calculational approach set out in this study. 33 The method used to segment the harmonies (AVL) in this study also has its various flaws and limitations. In most studies carried out into the perception of harmony, the number of notes in a given chord are all standardized, and this was not the case in this study. Post-tonal harmonies when segmented, can result with varying number of notes in a chord, some may simply contain a single unison note and others may contain more than the "norm" (4-, 5- note pitch collection). The number of notes in a pitch collection have no doubt had an impact on how listeners would rate its tension, participants tended to give a lower rating to a progression that consists of a larger to smaller pitch collection. Additionally, register should be carefully considered for in future studies, along with rhythm and meter, as the registral height of the harmonies can have an impact on how listeners rate its intensity.
The method of this study can be adapted in future studies to utilize continuous measurements instead of discrete measurements. As discussed by Britten and Duke (1997), continuous measurements may be a more beneficial measurement tool to better understand participants' changing perceptions during the listening experience. It will also be useful to investigate if there is a difference between musicians' and non-musicians' perception of these post-harmonies, particularly if prior musical training influences listeners. 34 As only one instrumental timbre was used for this study, future studies can extend to the use of other instrumentation to explore how perception responses changes depending on the timbre 35, exploring how this can have an impact on perceived emotions 36, and how a spectral analysis can further enhance or reinforce the findings. 37 The stimuli set can also be expanded to include other works by different composers, but of the same time period, to explore the relationship between these composers' harmonic idiom to listeners' perception. Another possibility is to extend the AVL method, comparing the perception of the PCns to its original stimuli, from the music, bringing in the examination of other parameters.
As this study focused on harmony to measure tension, this can be extended to include other parameters to further support this notion. BaileyShea and Monahan (2018), for instance, consider a new method for describing musical energetics (relating to musical tension as perceptions of musical movement or force) that is not dependent on tonality. Their study employs concepts of generalized gravity (according to which upward motion gives the impression of providing more energy than downward motion) and registral mass variance (according to which musical events in lower registers can be perceived as heavier or denser than events in higher registers), concepts which can further enhance the examination of works without a clear tonal center, such as neoclassical and post-tonal music.
Correlating tension ratings to physical and psychoacoustical features is perhaps the next step one should take in theorizing post-tonal harmonic tension, as accounting for the AVL simply does not suffice in such repertoire. In creating an abstract model, there will be potential implications in music analysis as this could ultimately be a tool to assist in explaining formal functions such as closure in post-tonal music. 38 Although additional follow-up experiments would undoubtedly reinforce the findings, the analysis and observations from this study demonstrate a new perspective on perceiving tension that neither belong to the tonal nor post-tonal realm. The study has shed light on the complexity of these harmonies and the various external factors that affect listeners' perception. Further examination into post-tonal tension perception will in the bigger picture assist in our understanding of the interrelationships between performance practices, refining theoretical and perceived interpretations and musical structures.
ACKNOWLEDGEMENTS
The author wishes to thank Tuomas Eerola for his invaluable assistance throughout the entire study and his insightful feedback. This article was copyedited by Daniel Shanahan and layout edited by Kelly Jakubowski.
NOTES
-
Correspondence can be addressed to: Yvonne Teo, Department of Music, Durham University, Palace Green, Durham, DH1 3RL, UK. yvonne.teo@durham.ac.uk.
Return to Text -
The Ursatz, comprising the fundamental descent (typically from either 3, 5, 8) and the bass arpeggiation (typically I-V-I), illustrates the fundamental structure of a tonal piece, a simple progression from which the piece is theoretically generated (Pankhurst, 2008).
Return to Text -
Lerdahl's use of "parallelism" suggests a musical event that may have motivic and rhythmic significance, which occurs elsewhere in the analysis.
Return to Text -
In this context, echoing the words of Bigand, Parncutt and Lerdahl, a chord "designates the simultaneous sounding of three or more notes" (Bigand, Parncutt and Lerdahl, 1996, 125).
Return to Text -
Musical expectancies include factors such as melodic interval size, melodic contour, rhythmic features and tonal and harmonic structures and "harmonic structures" consist of a framework that establishes its relationship to its relevant key.
Return to Text -
Although two contrasting pieces of work were used as the stimuli (Baroque and Twentieth-century), the results revealed that unlike tonal works, there are different levels of stability (stable, middle stability, less stability, strong instability) in atonal works and its structural importance are attributed to two main factors: the presence of a hierarchically important chord or the sense of expectation of the arrival of an essential chord or an important note.
Return to Text -
Their initial prediction suggests that musical tension will be higher if the second chord of the sequence is non-diatonic, which is negatively correlated with the perceived harmonic hierarchies created by Krumhansl.
Return to Text -
Such factors include the influence of harmonic function, sensory dissonance, horizontal motion and the impact of musical training.
Return to Text -
The authors concluded that non-musicians were more influenced by the melodic arrangements between the chords whilst musicians paid more attention to the chords' harmonic function and its roughness.
Return to Text -
In the first part of the study, participants were required to make a forced judgement on how tense the chord was and the second part required participants to use a slider to rate the changes in quality, to determine roughness. Different factors were accounted for: tonal references and surface characteristics from performance variables.
Return to Text -
This study utilized recorded performances of an unmeasured prelude, Prélude non mesuré No. 7, by Louis Couperin as the stimuli and participants were asked to rate the perceived tension via continuous ratings.
Return to Text -
Farbood and Upham's study explores two aspects of musical tension that has not been thoroughly investigated – the individual timescales to assess how the different parameters attribute to tension and a close examination of participants' ratings to excerpts – to assess if musical features that require higher levels of cognitive processing (e.g. harmony) do contribute to tension over longer time periods than "low-level" auditory features (e.g. loudness).
Return to Text -
The experiment was carried out in two parts. The first part required participants make judgements of tension for short stimuli through graphical shapes. The stimuli set was created so that each feature was isolated in some excerpts and combined with other parameters in order to uncover which specific parameter has direct impacts to tension. The second study required participants to make continuous, real-time judgements of tension – some stimuli came from Experiment 1 whilst some other excerpts were taken from the "Classical" repertoire – Bach, Vivaldi, Schoenberg, Beethoven and Brahms.
Return to Text -
See Appendix A for an explanation of the model.
Return to Text -
The term pitch collection is given to chords that transcend the norm of the Classical tradition, sonorities that can contain more than one pitch.
Return to Text -
As yet, no one theoretical model fully accounts for such neoclassical practices: a Schenkerian analysis will struggle to describe extended harmonies and post-tonal progressions; a Neo-Riemannian perspective does not fully acknowledge extended harmonies within chordal transformations, particularly on localized levels; and the application of pitch-class set theory struggles to describe meaningful tonal relationships between melody and harmony in this repertoire.
Return to Text -
Tonal stability is a tool derived from the MIDI toolbox that examines the "maximal correlation of the pitch-class distribution with the 24 K & K (Krumhansl and Kessler) profiles," assessing the PCn's tonal stability and clarity.
Return to Text -
For more information, see Bigand, Parncutt, & Lerdahl, 1996; Bigand & Parncutt, 1999.
Return to Text -
The mean pitch is obtained from the analysis of the midi sounds of each individual note in the PCn.
Return to Text -
The median range comprises the analysis of the midi sounds, the different between the highest and lowest pitch in each PCn.
Return to Text -
Chord Size simply comprises the examination into the number of notes within each PCn.
Return to Text -
Examining roughness originates from Vassilakis's doctoral dissertation (Vassilakis, 2001).
Return to Text -
Drawing upon the ideas of Cone, Cooper, Meyer and Komar, a one musical segment initially relies on accentual patterns – to locate the "structural downbeats" – and its attack points (Cone, 1960; Cooper and Meyer, 1960; Komar, 1971). Different levels of rhythmic segmentation will no doubt emerge, and the minimum number of durational units into vertical linear sonorities is a variable that changes depending on the music's meter and attack points. Viewed in this way, the first movement of Hindemith's Second Piano Sonata can be constructively segmented into two different levels, in minims (which correspond to its meter) and in crotchets (the next fastest meaningful rate of harmonic change). Further divisions and segmentations can occur depending on the rhythm used in the music. This study will focus on its smaller form of segmentation: crotchets. As the Piano Sonata is in simple-duple time, one PCn, is obtained for the minim level of segmentation. At times, some of the segmentation results in vertical sets of sounds that only contain one or two notes as the notes are taken at "face" value and no notes are added to conform to the "archetypal" triad (a collection of notes that are a third apart). In this particular work, the PCns can be easily identified, because the bass line generally contains the harmonic tones; and in passages where it is less obvious, the PCns can be "implied" from identifying the melodic embellishments. On a crotchet level of segmentation, the notes are taken at a face value, without any alterations, and passing notes are excluded from the PCn.
Return to Text -
It can perhaps be stated that when relating this finding to more practical purposes (such as performance practice), we may tend to perceive and value the importance of localized phrasing, to round off the two-bar phrase. Alternatively, another way to look at this is that these few bars are part of a sequence, that the smaller MTR gives listeners a false sense of resolution and it is ultimately driving towards the end of its second repetition in bar 42.
Return to Text -
This moment coincides with the start of the next subphrase, a repetition of the previous melodic figure stated in bar 39.
Return to Text -
A VL movement larger than 4 in this instance can be described as a large movement.
Return to Text -
R-3-7 in particular contains three pairs of M2nd intervals within the second PCn.
Return to Text -
This could potentially reinforce already established preconceived notions of consonance in conventional triads, and "chord clusters" or a larger set of PCn with dissonance.
Return to Text -
For more studies carried out into roughness, see McAdams & Pressnitzer, 1996; Paraskeva & McAdams, 1997; Pressnitzer, McAdams, Winsberg & Fineberg, 2000.
Return to Text -
The close link between roughness and dissonance have been investigated in short and long sequences (Bigand, Parncutt, & Lerdahl, 1996; Bigand & Parncutt, 1999).
Return to Text -
A regression analysis is a statistical method that is designed to locate trends in the data, to understand the relationship between the results and variables
Return to Text -
This column explains how much the specific variable contributes independently to the equation when isolated from other features.
Return to Text -
This quantitative method assigns each note a "metric weight," which is based on the "superposition of specific pulses evoked by the onsets of all notes." By using this computational approach, this method will reveal crucial information about the music's metric structure both on a local and global level.
Return to Text -
A recent study by Arthurs, Beeston and Timmers reveal that listeners' ratings of consonance and stability "were influenced by the degree of musical training" as well as the knowledge of "tonal hierarchy" (Arthurs, Beeston and Timmers, 2017).
Return to Text -
It has been reported by Paraskeva and McAdams that chords played on a piano are perceived to be more tense that its orchestral equivalent (Paraskeva & McAdams, 1997). A study by Silvey also presents the same findings (Silvey, 2011).
Return to Text -
For example, chords that are played on stringed instruments have been reported to invoke more melancholy, nostalgia and sadness than a keyboard instrument (Lahdelma & Eerola, 2016).
Return to Text -
An example of spectral analysis can be seen in McAdams, Douglas, & Vempala's "Perception and Modeling of Affective Qualities of Musical Instrument Sounds across Pitch Registers" (2017).
Return to Text -
Although tonal formal functions have been extensively explored and theorized, the application of these theories to post-tonal repertoire remains problematic (Caplin, 2013; 1998; 2009).
Return to Text -
A graphical tool that depicts the tonal space to visually represent harmonic relationships from Neo-Riemannian Theory. This method is used to analyze chromatic music and triadic textures, to examine the "transformations" as opposed to "relationships" within the harmonies.
Return to Text -
To avoid confusing [10] and [11] with [1] and [0] and [1] and [1] when placed in close proximity, [10] and [11] are abbreviated as [X] and [Y] respectively.
Return to Text -
Richard Cohn, "Neo-Riemannian Operations, Parsimonious Trichords, and Their "Tonnetz" Representations," Journal of Music Theory 41.1 (1997): 15; "An Introduction to the Practical Use of Music-Mathematics," Milan Kidd, University of Chicago, published August 2006, http://www.math.uchicago.edu/~may/VIGRE/VIGRE2006/PAPERS/Kidd.pdf.
Return to Text -
Quantifying such movement as close or for a better word, "small" movement will greatly depend on the context of the music; however, the movement of 0 (common tone), 1 (semitone) and 2 (tone) can be described as minimal/small in accordance to Neo-Riemannian principles. As transformations between two chords on the Tonnetz would typically share two common tones (0) and the movement comprises a semitone (1) or tone (2), these movements are therefore regarded as of a "smaller" quantity.
Return to Text -
Joseph Straus, "Uniformity, Balance, and Smoothness in Atonal Voice Leading," Music Theory Spectrum 25 (2003): 315. The term pitch collection (PCn) transcends the tonal tradition. In dealing with post-tonal repertoire, this term describes vertical sonorities derived from any given scale.
Return to Text
REFERENCES
- Arnal, L. H., Flinker, A., Kleinschmidt, A., Giraud, A.-L., & Poeppel, D. (2015). Human screams occupy a privileged niche in the communication soundscape. Current Biology, 25(15), 2051–2056. https://doi.org/10.1016/j.cub.2015.06.043
- Arthurs, Y., Beeston, A., & Timmers, R. (2017). Perception of isolated chords: Examining frequency of occurrence, instrumental timbre, acoustic descriptors and musical training. Psychology of Music, 46(5) 662–681. https://doi.org/10.1177/0305735617720834
- BaileyShea, M., & Monahan, S. (2018). 'Von anderem Planeten?' Gesture, embodiment, and virtual environments in the orbit of (a)tonality. In N. Reyland & R. Thumposton (Eds), Music, analysis and the body: experiments, explorations, and embodiments (Vol. 6, pp. 31–50). Leuven, Belgium: Peeters.
- Bharucha, J. (1984). Anchoring effects in music: The resolution of dissonance. Cognitive Psychology, 16(4), 485–518. https://doi.org/10.1016/0010-0285(84)90018-5
- Bharucha, J., & Krumhansl, C. (1983). The representation of harmonic structure in music: Hierarchies of stability as a function of context. Cognition, 13(1), 63-102. https://doi.org/10.1016/0010-0277(83)90003-3
- Bigand E., & Parncutt, R. (1999). Perceiving musical tension in long chord sequences. Psychological Research (62) 237–254. https://doi.org/10.1007/s004260050053
- Bigand, E. (1990). Abstraction of two forms of underlying structure in a tonal melody. Psychology of Music, 18(1), 45–60. https://doi.org/10.1177/0305735690181004
- Bigand, E. (1993). The influence of implicit harmony, rhythm and musical training on the abstraction of "tension-relaxation schemas" in tonal musical phrases. Contemporary Music Review, 9(1-2), 123-137. https://doi.org/10.1080/07494469300640391
- Bigand, E., Parncutt, R., & Lerdahl, F. (1996). Perception of musical tension in short chord sequences: The influence of harmonic function, sensory dissonance, horizontal motion, and musical training. Perception and Psychophysics, 58(1), 125–141. https://doi.org/10.3758/BF03205482
- Brittin, R., & Duke, R. (1997). Continuous versus summative evaluations of musical intensity: A comparison of two methods for measuring overall effect. Journal of Research in Music Education, 45(2), 245–258. https://doi.org/10.2307/3345584
- Burnsed, V., & Sochinski, J. (1998-2001). The relationship between dynamics and tension in Haydn's symphony 104: A developmental study. Psychomusicology, 17(1-2), 19-35. https://doi.org/10.1037/h0094061
- Caplin, W.E. (1998). Classical form: A theory of formal functions for the instrumental music of Haydn, Mozart, and Beethoven. Oxford: Oxford University Press.
- Caplin, W.E. (2009). What are Formal Functions? In P. Bergé (Ed.), Musical Form, Forms and Formenlehre (pp. 21–39). Leuven, Belgium: Leuven University Press. https://doi.org/10.2307/j.ctt9qf01v.5
- Caplin, W.E. (2013). Analyzing classical form: An approach for the classroom. Oxford: Oxford University Press.
- Cohn, R. (1997). Neo-Riemannian operations, parsimonious trichords, and their "tonnetz" representations Journal of Music Theory, 41(1) (1997): 1–66. https://doi.org/10.2307/843761
- Cone, E.T. (1960). Analysis today. The Musical Quarterly, 46(2), 172– 88. https://doi.org/10.1093/mq/XLVI.2.172
- Cooper, G., & Meyer, L.B. (1960). The Rhythmic Structure of Music. Chicago: University of Chicago Press.
- Cronbach, L.J. (1951). Coefficient alpha and the internal structure of tests. Psychometrika, 16(3), 297–334. https://doi.org/10.1007/BF02310555
- Dibben, N. (1994). The cognitive reality of hierarchic structure in tonal and atonal music. Music Perception, 12(1), 1–25. https://doi.org/10.2307/40285753
- Dibben, N. (1999). The perception of structural stability in atonal music: The influence of salience, stability, horizontal motion, pitch commonality, and dissonance. Music Perception, 16(3), 265–294. https://doi.org/10.2307/40285794
- Eerola, T., & Toiviainen, P. (2004). MIDI Toolbox: MATLAB Tools for Music Research. Kopijyvä, Jyväskylä, Finland: University of Jyväskylä.
- Esteve-Faubel, J.M., Francés-Luna, B., Stephens, J.P., & Bartel, L. (2016). Cognition of stability in atonal music in teenagers with no musical experience. Psychomusicology: Music, Mind, and Brain, 26(1), 43–55. https://doi.org/10.1037/pmu0000133
- Farbood, M. (2012). A parametric, temporal model of musical tension. Music Perception: An Interdisciplinary Journal, 29(4), 387–428. https://doi.org/10.1525/mp.2012.29.4.387
- Farbood, M., & Upham, F. (2013). Interpreting expressive performance through listener judgements of musical tension. Frontiers in Psychology, 4, 1–15. https://doi.org/10.3389/fpsyg.2013.00998
- Gingras, B., Pearce, M.T., Goodchild, M., Dean, R.T., Wiggins, G., & McAdams, S. (2016). Linking melodic expectation to expressive performance timing and perceived musical tension. Journal of Experimental Psychology: Human Perception and Performance, 42(4), 594–609. https://doi.org/10.1037/xhp0000141
- Granot R., & Zohar, E. (2011). Musical tension and the interaction of dynamic auditory parameters. Music Perception, 28(3), 219-246. https://doi.org/10.1525/mp.2011.28.3.219
- Huron, D. (2001). Tone and voice: A derivation of the rules of voice-leading from perceptual principles. Music Perception: An Interdisciplinary Journal, 19(1), 1–64. https://doi.org/10.1525/mp.2001.19.1.1
- Hutchinson W., & Knopoff, L. (1978). The acoustical component of western consonance. Interface, 7(1), 1-29. https://doi.org/10.1080/09298217808570246
- Ilie, G., & Thompson, W. (2006). A comparison of acoustic cues in music and speech for three dimensions of affect. Music Perception, 23(4), 319–329. https://doi.org/10.1525/mp.2006.23.4.319
- Kamien, R. (2008). Music: an appreciation. Boston: McGraw-Hill Higher Education.
- Kidd, M. (2006). An introduction to the practical use of music-mathematics. University of Chicago, http://www.math.uchicago.edu/~may/VIGRE/VIGRE2006/PAPERS/Kidd.pdf.
- Kliewer, V.L. (1975). Melody: linear aspects of twentieth-century music. In G.E. Wittlich (Ed.), Aspects of Twentieth-Century Music (pp. 270–321). New Jersey, US: Prentice-Hall.
- Komar, A. (1971). Theory of Suspensions. Princeton: Princeton University Press.
- Krumhansl, C. (1979). The psychological representation of musical pitch in a tonal context. Cognitive Psychology, 11(3), 346-374. https://doi.org/10.1016/0010-0285(79)90016-1
- Krumhansl, C. (1990). Cognitive foundations of musical pitch. New York: Oxford University Press.
- Krumhansl, C. (1996). A perceptual analysis of Mozart's piano sonata k. 282: Segmentation, tension and musical ideas. Music Perception, 13(3), 401–432. https://doi.org/10.2307/40286177
- Krumhansl, C., & Kessler, E. (1982). Tracing the dynamic changes in perceived tonal organisation in a spatial representation of musical keys. Psychological Review, 89(4), 334-368. https://doi.org/10.1037/0033-295X.89.4.334
- Krumhansl, C., Sandel G., & Sargeant, D. (1987). The perception of tone hierarchies and mirror forms in twelve-tone serial music. Music Perception, 5(1), 31–77. https://doi.org/10.2307/40285385
- Lahdelma, I., & Eerola, T. (2016). Single chords convey distinct emotional qualities to both naïve and expert listeners. Psychology of Music, 44(1), 37–54. https://doi.org/10.1177/0305735614552006
- Lartillot, O., & Toiviainen, P. (2007). A Matlab toolbox for musical feature extraction from audio. In S. Marchand (Ed.), Proceedings of the 10th International Conference on Digital Audio Effects (DAFx-07) (pp. 237–244). Bordeaux, France: Université Bordeaux
- Lerdahl F., & Jackendoff, R. (1983). A generative theory of tonal music. Cambridge: MIT Press.
- Lerdahl F., & Krumhansl, C. (2007). Modelling tonal tension. Music Perception: An Interdisciplinary Journal, 24(4), 329-366. https://doi.org/10.1525/mp.2007.24.4.329
- Lerdahl, F. (1988). Tonal pitch space. Music Perception, 5 (3), 315–349. https://doi.org/10.2307/40285402
- Lerdahl, F. (1989). Atonal prolongational structure. Contemporary Music Review, 4(1), 65–87. https://doi.org/10.1080/07494468900640211
- Lerdahl, F. (1996). Calculating tonal tension. Music Perception, 13(3), 319-363. https://doi.org/10.2307/40286174
- Lerdahl, F. (1997). Spatial and psychoacoustic factors in atonal prolongation. Current Musicology, 63, 7–26. https://doi.org/10.7916/D8K35SFK
- Lerdahl, F. (2001). Tonal pitch space. Oxford: Oxford University Press.
- McAdams, S., & Pressnitzer, D. (1996). Psychoacoustic factors to musical tension in western nontonal music. International Journal of Psychology, 31(3-4), 148. https://doi.org/10.1080/00207594.1996.19960818
- McAdams, S., Douglas, C., & Vempala, N. (2017). Perception and modeling of affective qualities of musical instrument sounds across pitch registers. Frontiers in Psychology, 8, 1–19. https://doi.org/10.3389/fpsyg.2017.00153
- Meyer, L. (1956). Emotion and meaning in music. Chicago: University of Chicago Press.
- Meyer, L. (1973). Explaining music: Essays and explorations. Chicago: University of Chicago Press.
- Misenhelter, D. (2001). An investigation of music and nonmusic majors' responses to musical tension and dynamics in Beethoven's Symphony No. 7. Missouri Journal of Research in Music Education, 38, 56-67.
- Palmer C. & Krumhansl, C. (1987). Pitch and temporal contributions to musical phrase perception: Effects of harmony, performance timing, and familiarity. Perception & Psychophysics, 41(6), 505–518. https://doi.org/10.3758/BF03210485
- Pankhurst, T. (2008). SchenkerGUIDE: A brief handbook and website for Schenkerian analysis. New York: Routledge. https://doi.org/10.4324/9780203928882
- Paraskeva, S., & McAdams, S. (1997). Influence of timbre, presence/absence of tonal hierarchy and musical training on the perception of musical tension and relaxation schemas. Proceedings of the 1997 International Computer Music Conference, 438-441.
- Parncutt, R. (1989). Harmony: A psychoacoustical approach. Berlin: Springer-Verlag. https://doi.org/10.1007/978-3-642-74831-8
- Parncutt, R., & Hair, G. (2011). Consonance and dissonance in music theory and psychology: Disentangling dissonant dichotomies. Journal of Interdisciplinary Music Studies, 5(2), 119-66. https://doi.org/10.4407/jims.2011.11.002
- Plomp, R., & Levelt, W. (1965). Tonal consonance and critical bandwidth. Journal of the Acoustical Society of America, 38(4), 548-560. https://doi.org/10.1121/1.1909741
- Pressnitzer, D., McAdams, S., Winsberg, S., & Fineberg, J. (2000). Perception of musical tension for nontonal orchestral timbres and its relation to psychoacoustic roughness. Perception and Psychophysics, 62(1), 66–80. https://doi.org/10.3758/BF03212061
- Rameau, J.P. (1971). Traité d'harmonie (Treatise of Harmony). Trans. P. Gosset. New York: Dover.
- Riemann, H. (1893). Vereinfachte harmonierlehre (Harmony Simplified). Trans. H. Bewerunge. London: Augener.
- Roberts, L., & Shaw, M. (1984). Perceived structure of triads. Music Perception, 2(1), 95–124. https://doi.org/10.2307/40285284
- Schenker, H. (1979). Free composition. Trans. Ernst Oster. New York: Longman.
- Schoenberg, A. (1911). Theory of harmony. Trans. R.E Carter. London: Faber and Faber.
- Silvey, B. (2011). The effects of orchestration on musicians' and nonmusicians' perception of musical tension. RIME, 9(1), 1–9.
- Straus, J. (2003). Uniformity, balance, and smoothness in atonal voice leading. Music Theory Spectrum, 25(2): 305–352. https://doi.org/10.1525/mts.2003.25.2.305
- Vassilakis, P. N. (2001). Perceptual and Physical Properties of Amplitude Fluctuation and their Musical Significance (Doctoral Dissertation). University of California, Los Angeles, America.
- Volk, A. (2008a). Persistence and change: Local and global components of metre induction using inner metric analysis. Journal of Mathematics and Music, 2(2), 99–115. https://doi.org/10.1080/17459730802312399
- Volk, A. (2008b). The study of syncopation using inner metric analysis: Linking theoretical and experimental analysis of metre in music. Journal of New Music Research, 37(4), 259-273. https://doi.org/10.1080/09298210802680758
- White, C. (2017). Relationships between tonal stability and metrical accent in monophonic contexts. Empirical Musicology Review, 12(1-2), 19–37. https://doi.org/10.18061/emr.v12i1-2.5833
APPENDICES
Appendix A – Voice-Leading Calculation and Harmonic Analysis
One alternative way to analyze neoclassical music is to apply some core concepts related to the Tonnetz. 39 This graphical representation, however, only illustrates adjacency by identifying core transformations (parallel, relative or leading-tone motion) and various other secondary operations (combinations of the core transformations). In order to account for a more diverse range of collections that do not operate or "transform" via a series of thirds or fifths, the Tonnetz requires modification, both to account for such motion and to observe how seemingly unrelated key areas are in fact proximate.
Adopting aspects of Von Oettingen and Riemann's initial conception of the Tonnetz, the letter names are converted into integers 40, the connecting lines are removed and the Tonnetz is realigned into a grid as opposed to a lattice diagram (see Figure 41) 41. As such, more abstract shapes can be formed, which depict close relationships between unrelated key areas, chords and extended harmonies.
| 4 | 7 | X | 1 | 4 | 7 |
| 0 | 3 | 6 | 9 | 0 | 3 |
| 8 | Y | 2 | 5 | 8 | Y |
| 4 | 7 | X | 1 | 4 | 7 |
| 0 | 3 | 6 | 9 | 0 | 3 |
| 8 | Y | 2 | 5 | 8 | Y |
For instance, when examining the transformation from G minor [7X2] into F minor [580] in Figure 42, which are the first two key areas in the Sonata (measures 1 and 41 respectively), one can observe their numerical proximity and how they progress diagonally in their integer space. 42 The movement between individual voices from G to F minor self-evidently moves by 2, as further explained in Table 4. In this instance, the total amount of VL movement from the accumulation of the individual VL movement is therefore 6. As such, one way to quantify the movement between two chords or pitch collections (PCns) and to describe the transformation would be to measure or calculate the total amount of harmonic movement rather than using "specific labels" for the transformations (e.g. parallel, relative, leading-tone), an idea influenced by Straus's work, which attempts to generalize voice-leading systems. 43
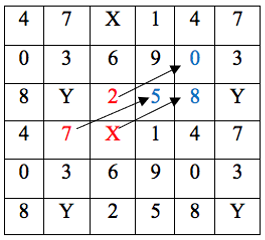
Fig. 42: Transforming [2X7] into [580].
| G minor | Movement | F minor | ||
|---|---|---|---|---|
| Notes | Pitch-class | Notes | Pitch-class | |
| D | 2 | -2 | 0 | C |
| B♭ | X | -2 | 8 | A♭ |
| G | 7 | -2 | 5 | F |
Appendix B – Musical Scores, Segments, and AVL
- Hindemith – Piano Sonata No. 2
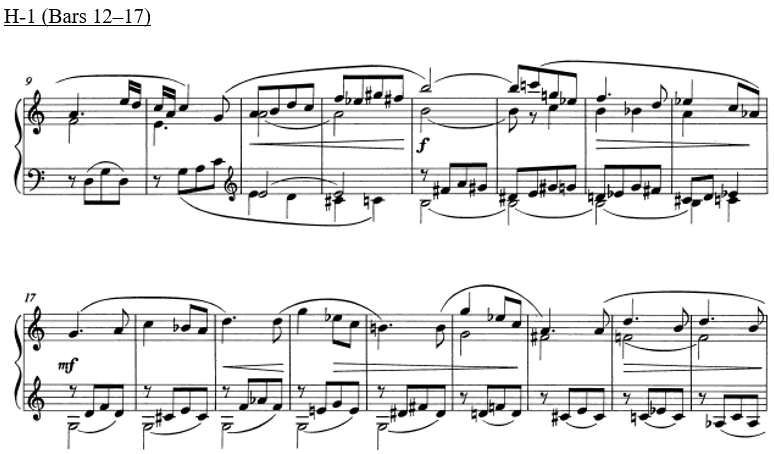
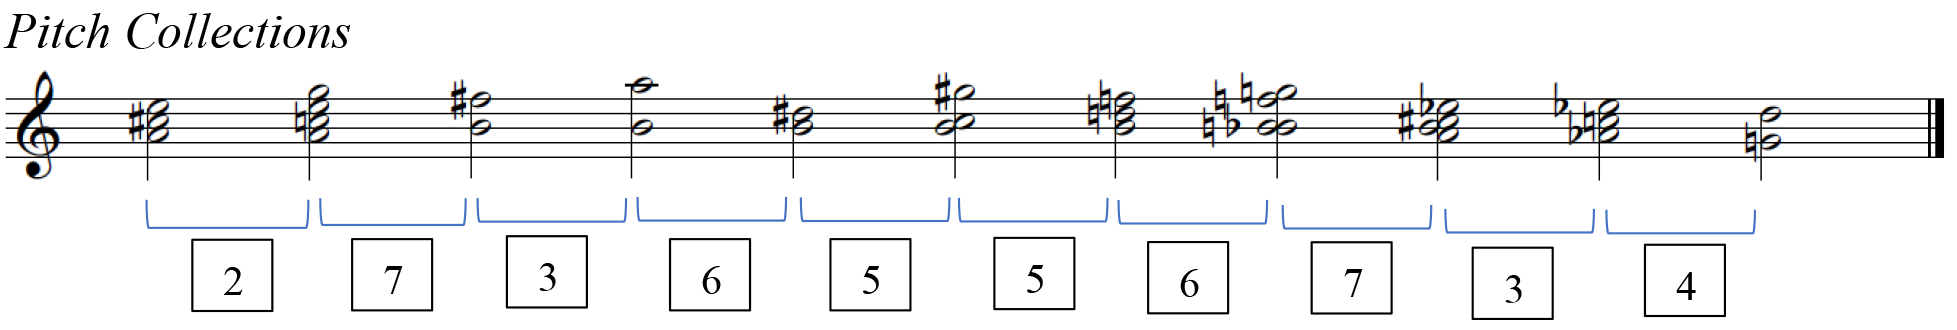
Clip H-1-1 H-1-2 H-1-3 H-1-4 H-1-5 H-1-6 H-1-7 H-1-8 H-1-9 H-1-10 AVL 2 7 3 6 5 5 6 7 3 4 MTR 1.95 2.89 2.59 1.79 3.98 2.66 3.82 3.22 2.30 1.78 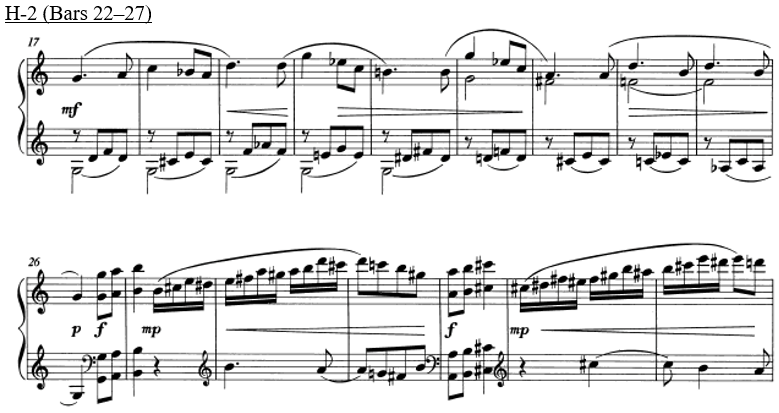
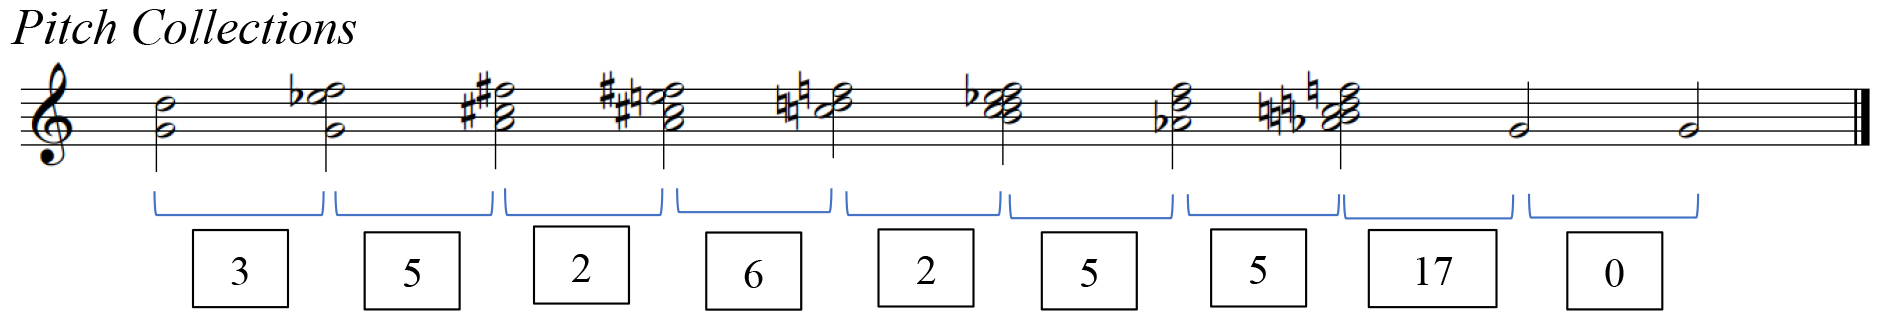
Clip H-2-1 H-2-2 H-2-3 H-2-4 H-2-5 H-2-6 H-2-7 H-2-8 H-2-9 AVL 3 5 2 6 2 5 5 17 0 MTR 3.28 2.97 2.54 2.48 3.73 2.81 3.57 1.55 1.302 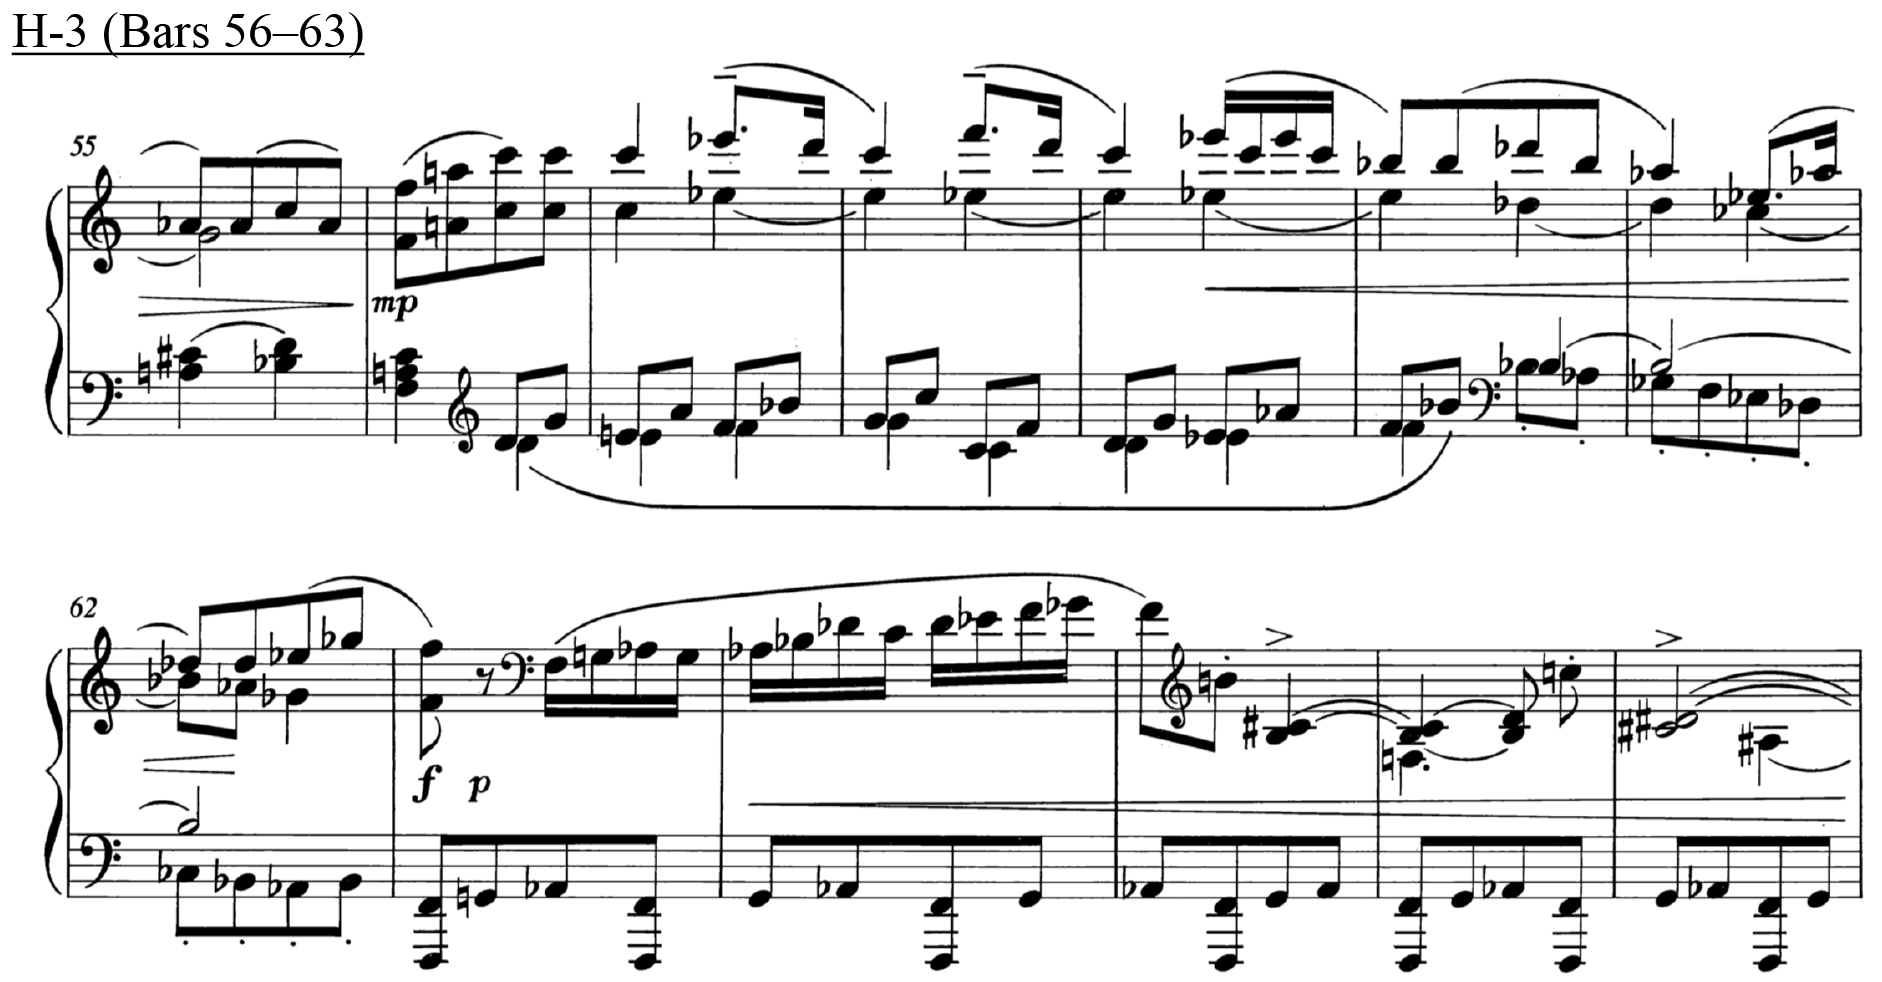
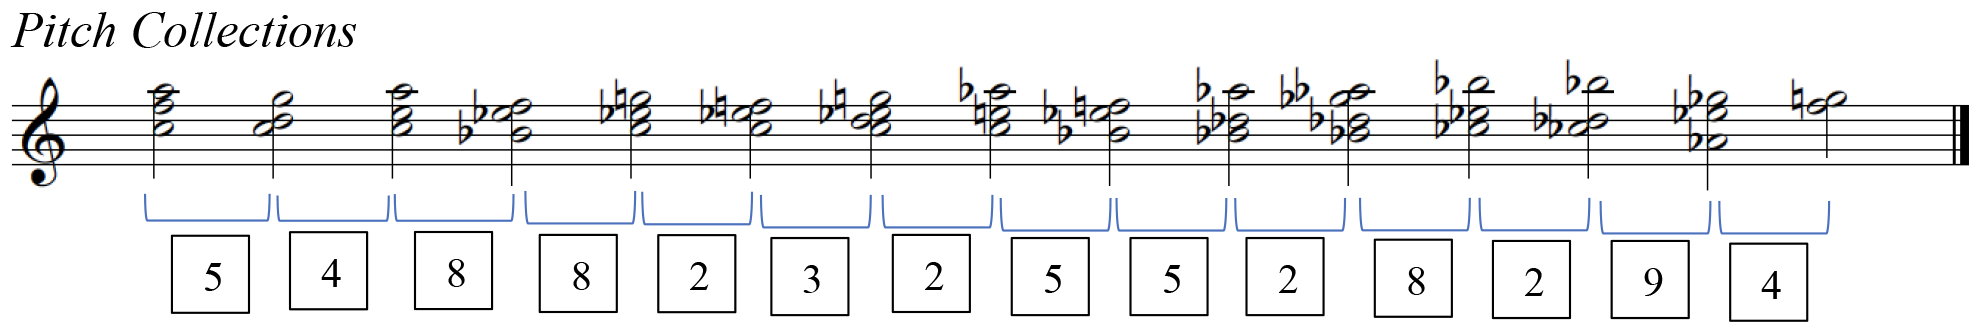
Clip H-3-1 H-3-2 H-3-3 H-3-4 H-3-5 H-3-6 H-3-7 H-3-8 AVL 5 4 8 8 2 3 2 5 MTR 1.94 2.33 1.89 2.24 1.76 3.32 3.19 1.92 Clip H-3-9 H-3-10 H-3-11 H-3-12 H-3-13 H-3-14 AVL 5 2 8 2 9 4 MTR 2.52 2.52 2.76 2.70 1.89 3.09 - Ravel – "Mouvement de Menuet" from Sonatine
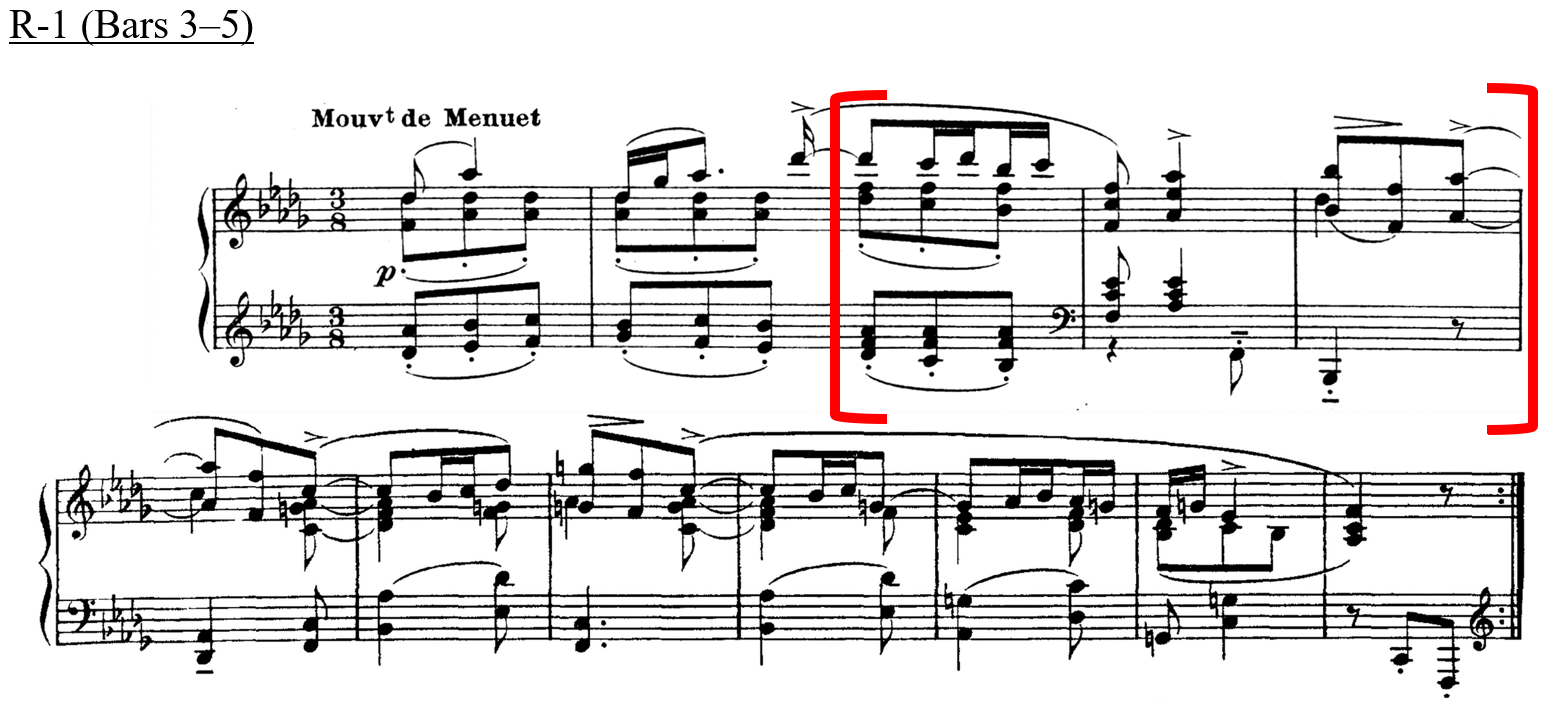
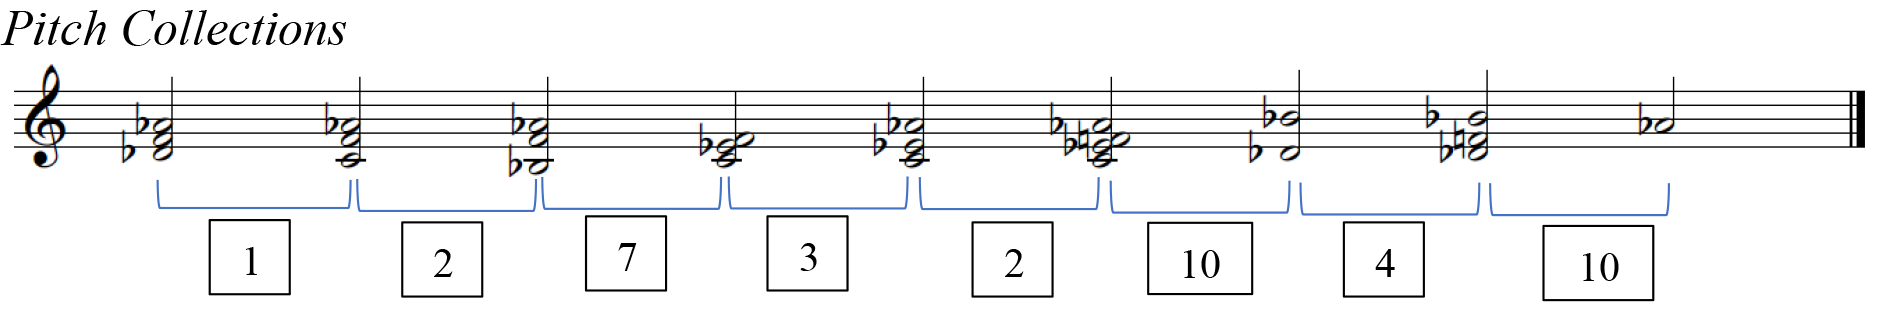
Clip R-1-1 R-1-2 R-1-3 R-1-4 R-1-5 R-1-6 R-1-7 R-1-8 AVL 1 2 7 3 2 10 4 10 MTR 1.82 1.98 1.94 1.92 2.14 2.01 1.98 1.59 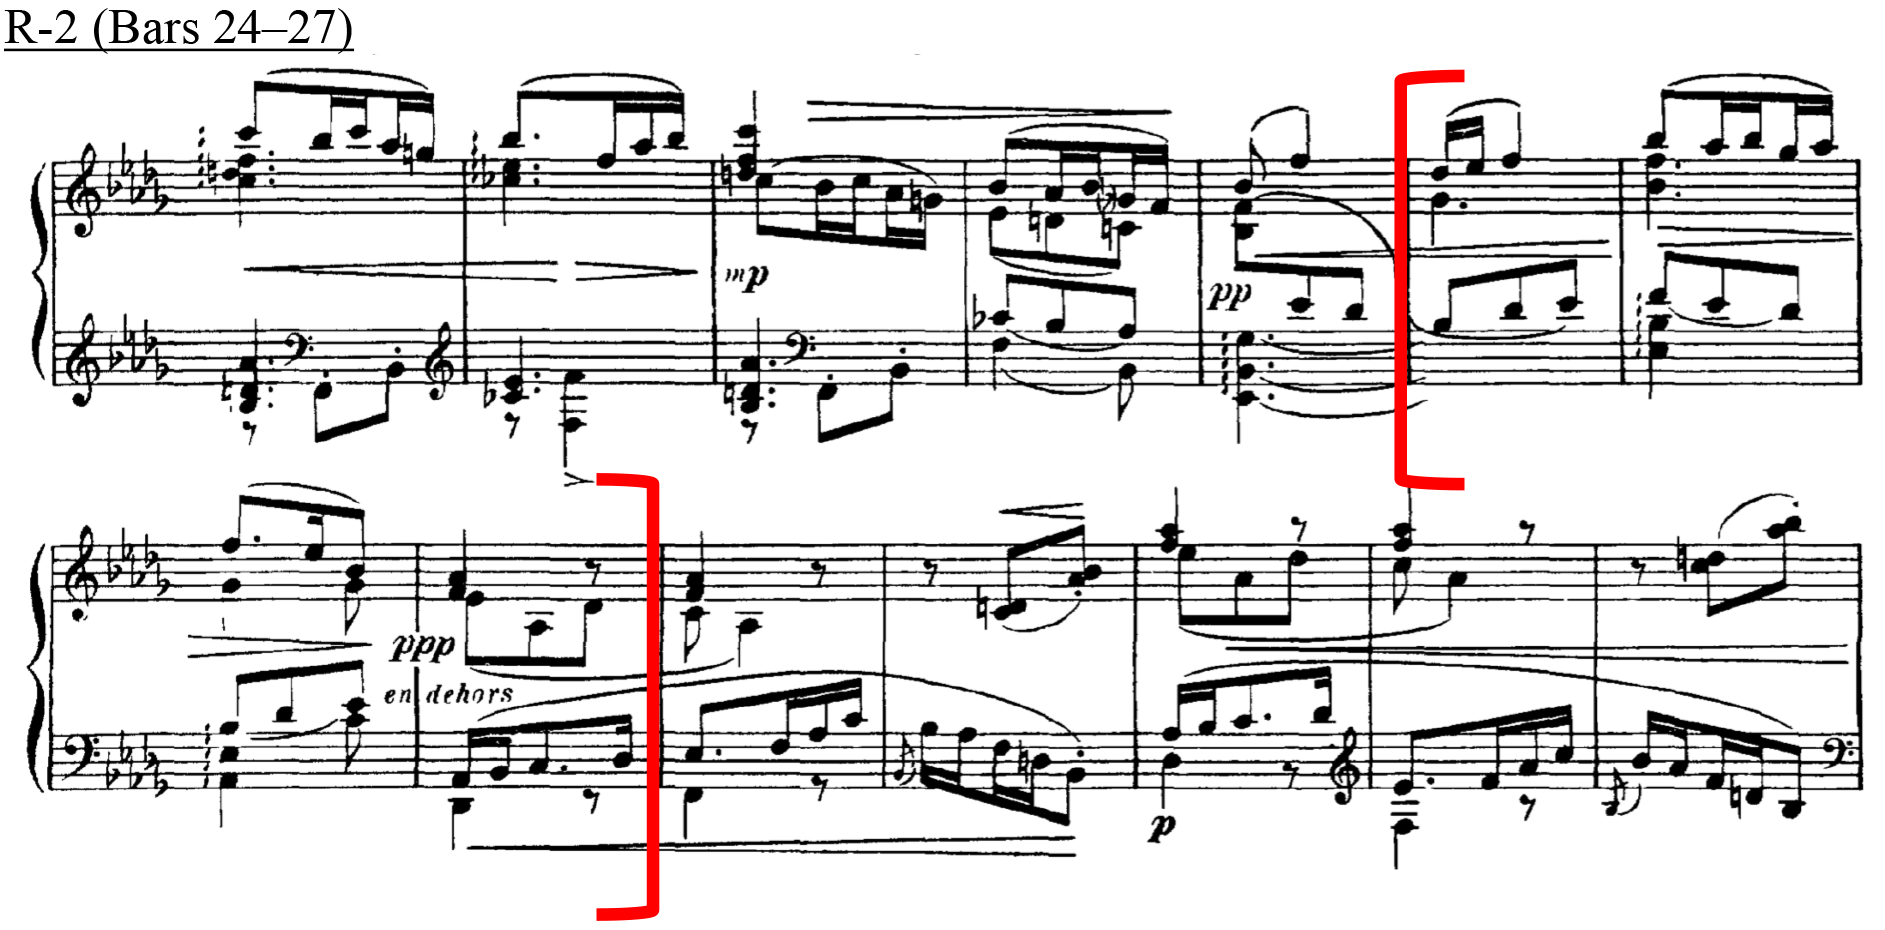
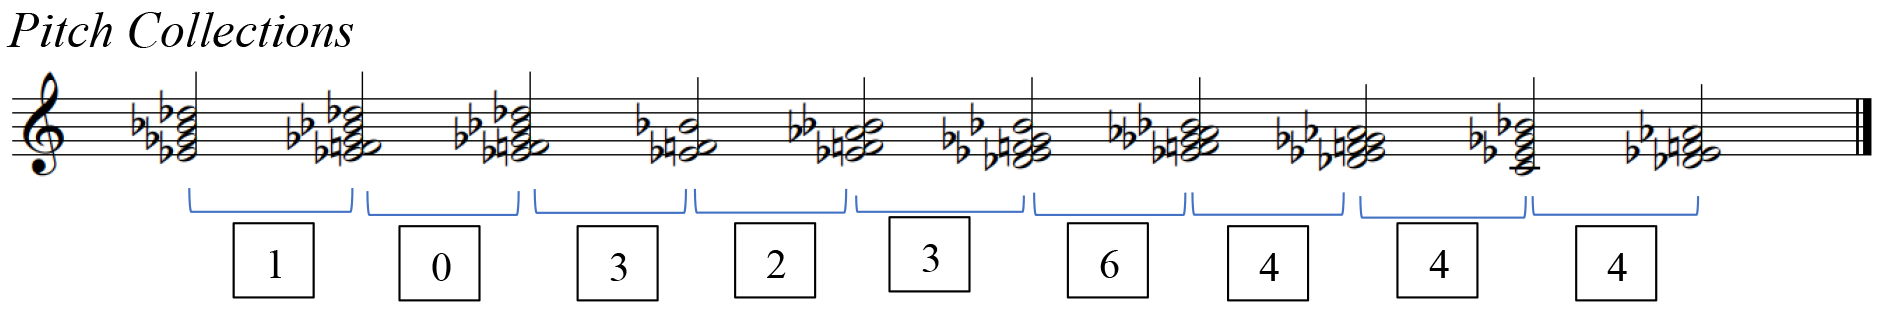
Clip R-2-1 R-2-2 R-2-3 R-2-4 R-2-5 R-2-6 R-2-7 R-2-8 R-2-9 AVL 1 0 3 2 3 6 4 4 4 MTR 2.97 2.92 2.17 2.57 3.06 3.32 2.82 2.68 2.01 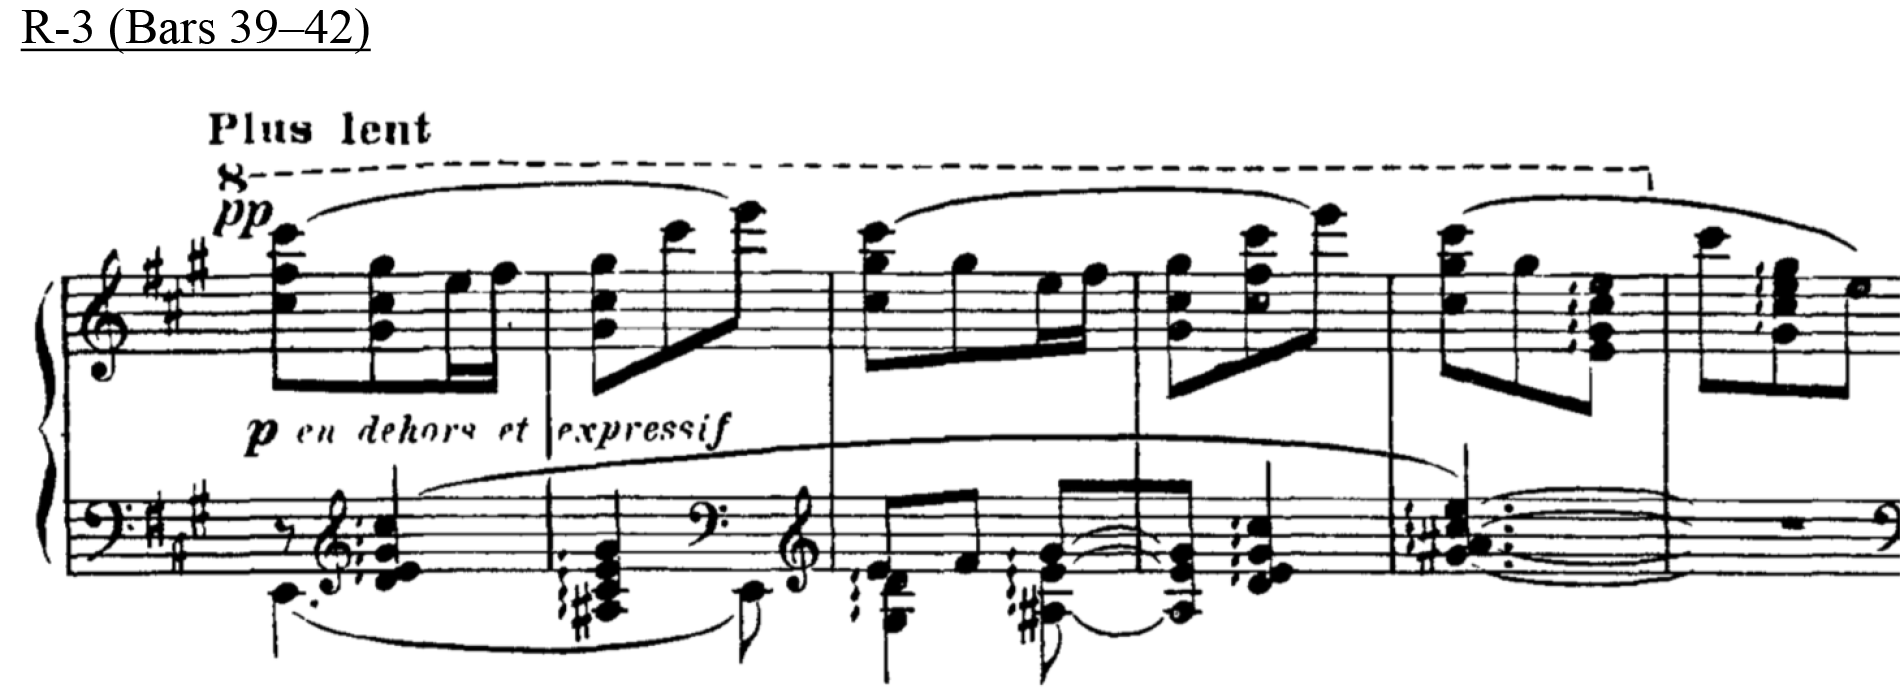
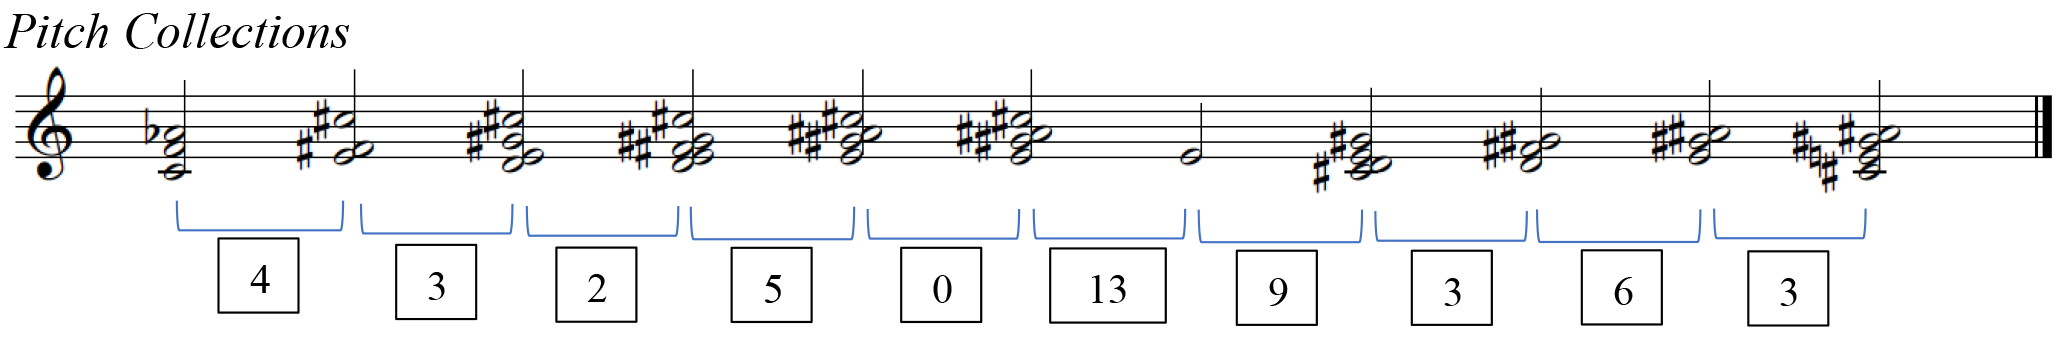
Clip R-3-1 R-3-2 R-3-3 R-3-4 R-3-5 R-3-6 R-3-7 R-3-8 R-3-9 R-3-10 AVL 4 3 2 5 0 13 9 3 6 3 MTR 3.27 3.25 3.03 3 2.41 1.54 3.75 3 3.43 2.76 - Stravinsky – Concerto for Piano and Wind Instruments
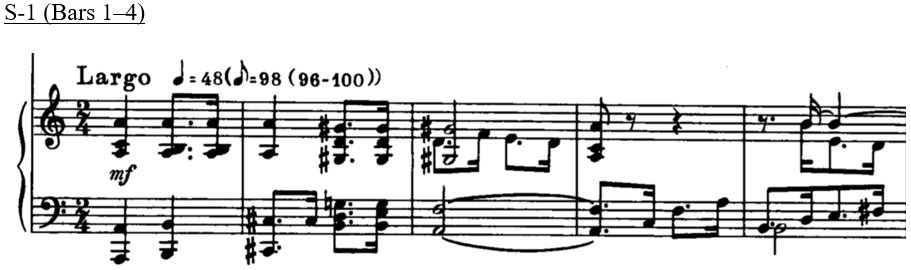
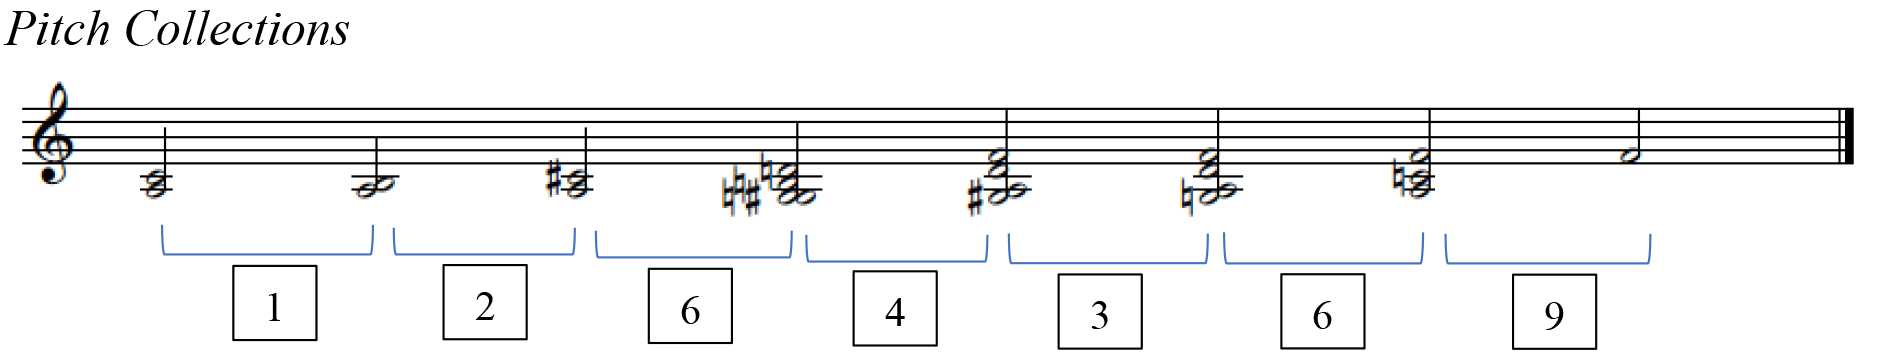
Clip S-1-1 S-1-2 S-1-3 S-1-4 S-1-5 S-1-6 S-1-7 AVL 1 2 6 4 3 6 9 MTR 2.25 1.97 3.90 3.90 3.24 1.97 1.49 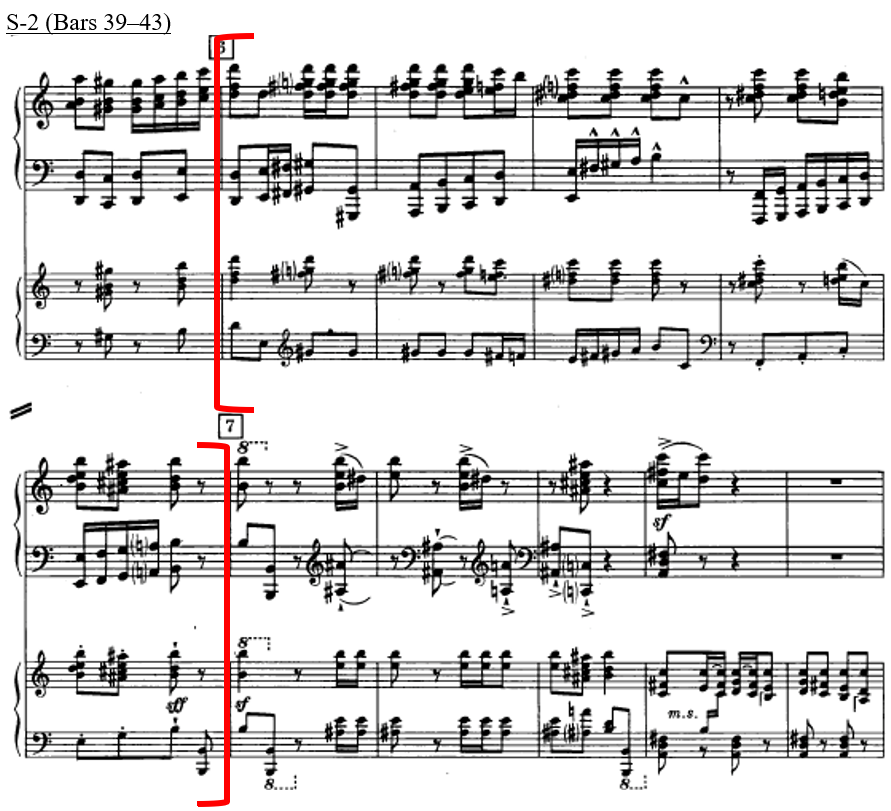
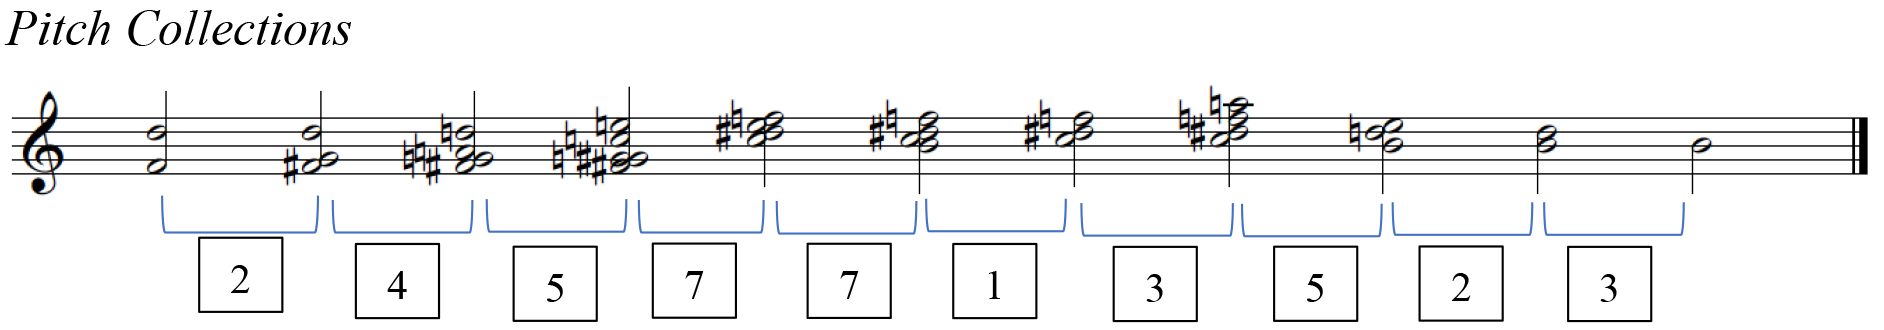
Clip S-2-1 S-2-2 S-2-3 S-2-4 S-2-5 S-2-6 S-2-7 S-2-8 S-2-9 S-2-10 AVL 2 4 5 7 7 1 3 5 2 3 MTR 3.27 2.90 4.06 4 3.25 2.55 3.22 2.13 1.75 1.40 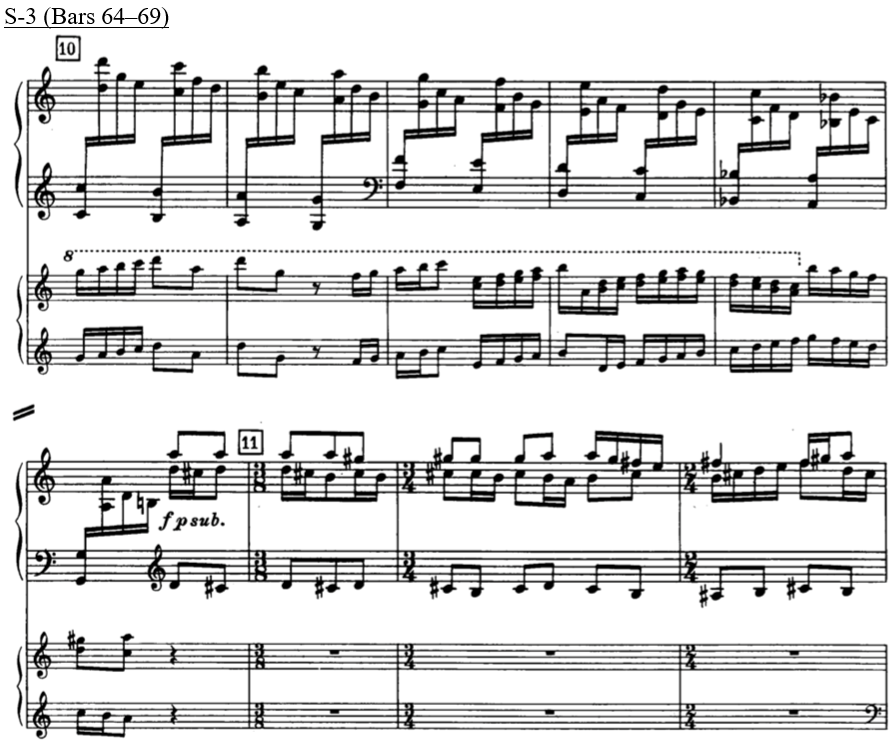
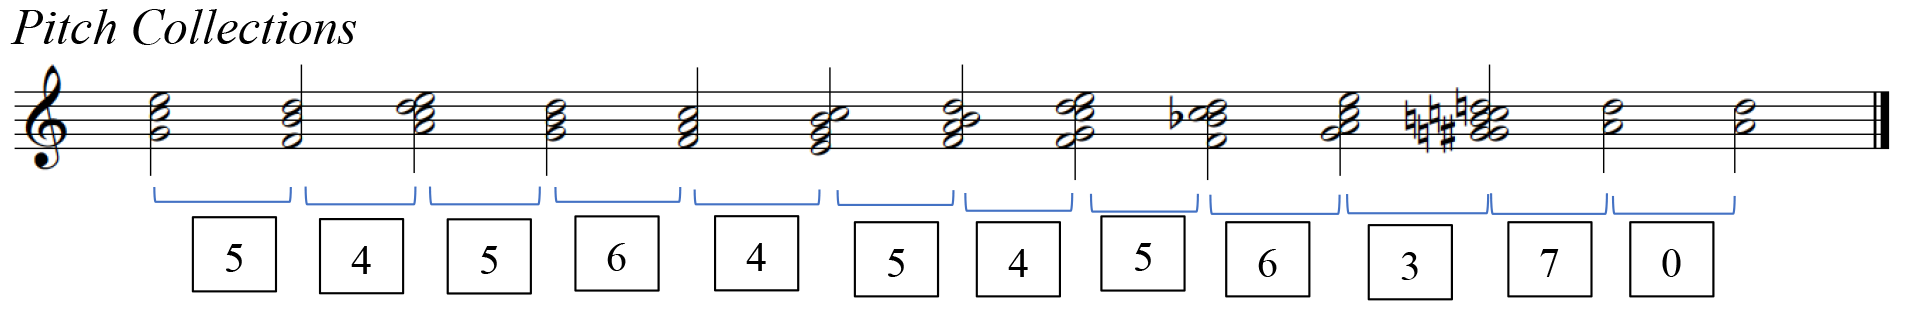
Clip S-3-1 S-3-2 S-3-3 S-3-4 S-3-5 S-3-6 S-3-7 S-3-8 S-3-9 S-3-10 S-3-11 S-3-12 AVL 5 4 5 6 4 5 4 5 6 3 7 0 MTR 2.01 3.21 1.71 1.70 2.62 2.89 3.33 2.09 2.86 3.65 2.16 1.57
