
SUMMARY
THIS data report introduces the MeloSol corpus: a collection of 783 monophonic melodies taken from A New Approach to Sight Singing: Fifth Edition (Berkowitz, Fontrier, Kraft, Goldstein, & Smaldone, 2011). The title MeloSol derives from a combination of the corpus' content— Melodic data— and the first name of the original author of the collection, Sol Berkowitz.
The corpus is divided into two major sections: a collection of sight-singing melodies composed specifically for pedagogical purposes (n = 629) taken from Chapter One and examples from Western classical literature (n = 154) taken from Chapter Five. The original text also contains materials for practicing rhythm (Chapter Two), Singing Duets (Chapter Three), Sing and Plays that incorporate a melody and piano accompaniment (Chapter Four), and Supplementary Exercises that are not included here. Within each of the larger sections exists five further subdivisions. These five subdivisions are mapped in conjunction with the trajectory of many aural skills curriculums.
For example, the first section of both the sight-singing melodies and the examples from Western classical literature align with melodies an undergraduate student in a music degree program might be expected to learn during their first semester of university in an aural skills classroom. As the original book was designed as a pedagogical text, each section of the book and consequently each melody within each section is meant to increase in complexity as new topics are introduced. The fifth and final section of both the sight-singing melodies and examples from the literature contain melodies which break from Western tonal practice. These contain either modal, atonal, or tonally ambiguous melodies. A visual depiction of the breakdown of melodies from the two larger sections is presented in Figure 1.
In terms of analyzable data, the 783 melodies are encoded in **kern format (Huron, 1994), with each individual file containing metadata listing the unique identifier, the chapter from which the melody originates, the section within that chapter of the larger text, its page number, as well as what mode the encoder labeled the melody as being in. Modes were only noted for a small subset of the corpus, and the vast majority of these melodies are either major (Ionian) or minor (Aeolian).
Overall, the corpus consists of 49,730 **kern tokens, comprising the notes, rests, and barlines. A subset of these are 36,641 notes. All melodies in the corpus were encoded by hand using the software MuseScore (Werner, Nicholas, & Bonte, 2019), initially saved as XML, then converted to **kern using the humdrum extras xml2hum tool (Sapp, 2008) with the current metadata added using the metadata_adder.R script found in the repository. Further additions to the metadata can be added with modifications to metadata_adder.R found in the scripts/R directory of the data repository.
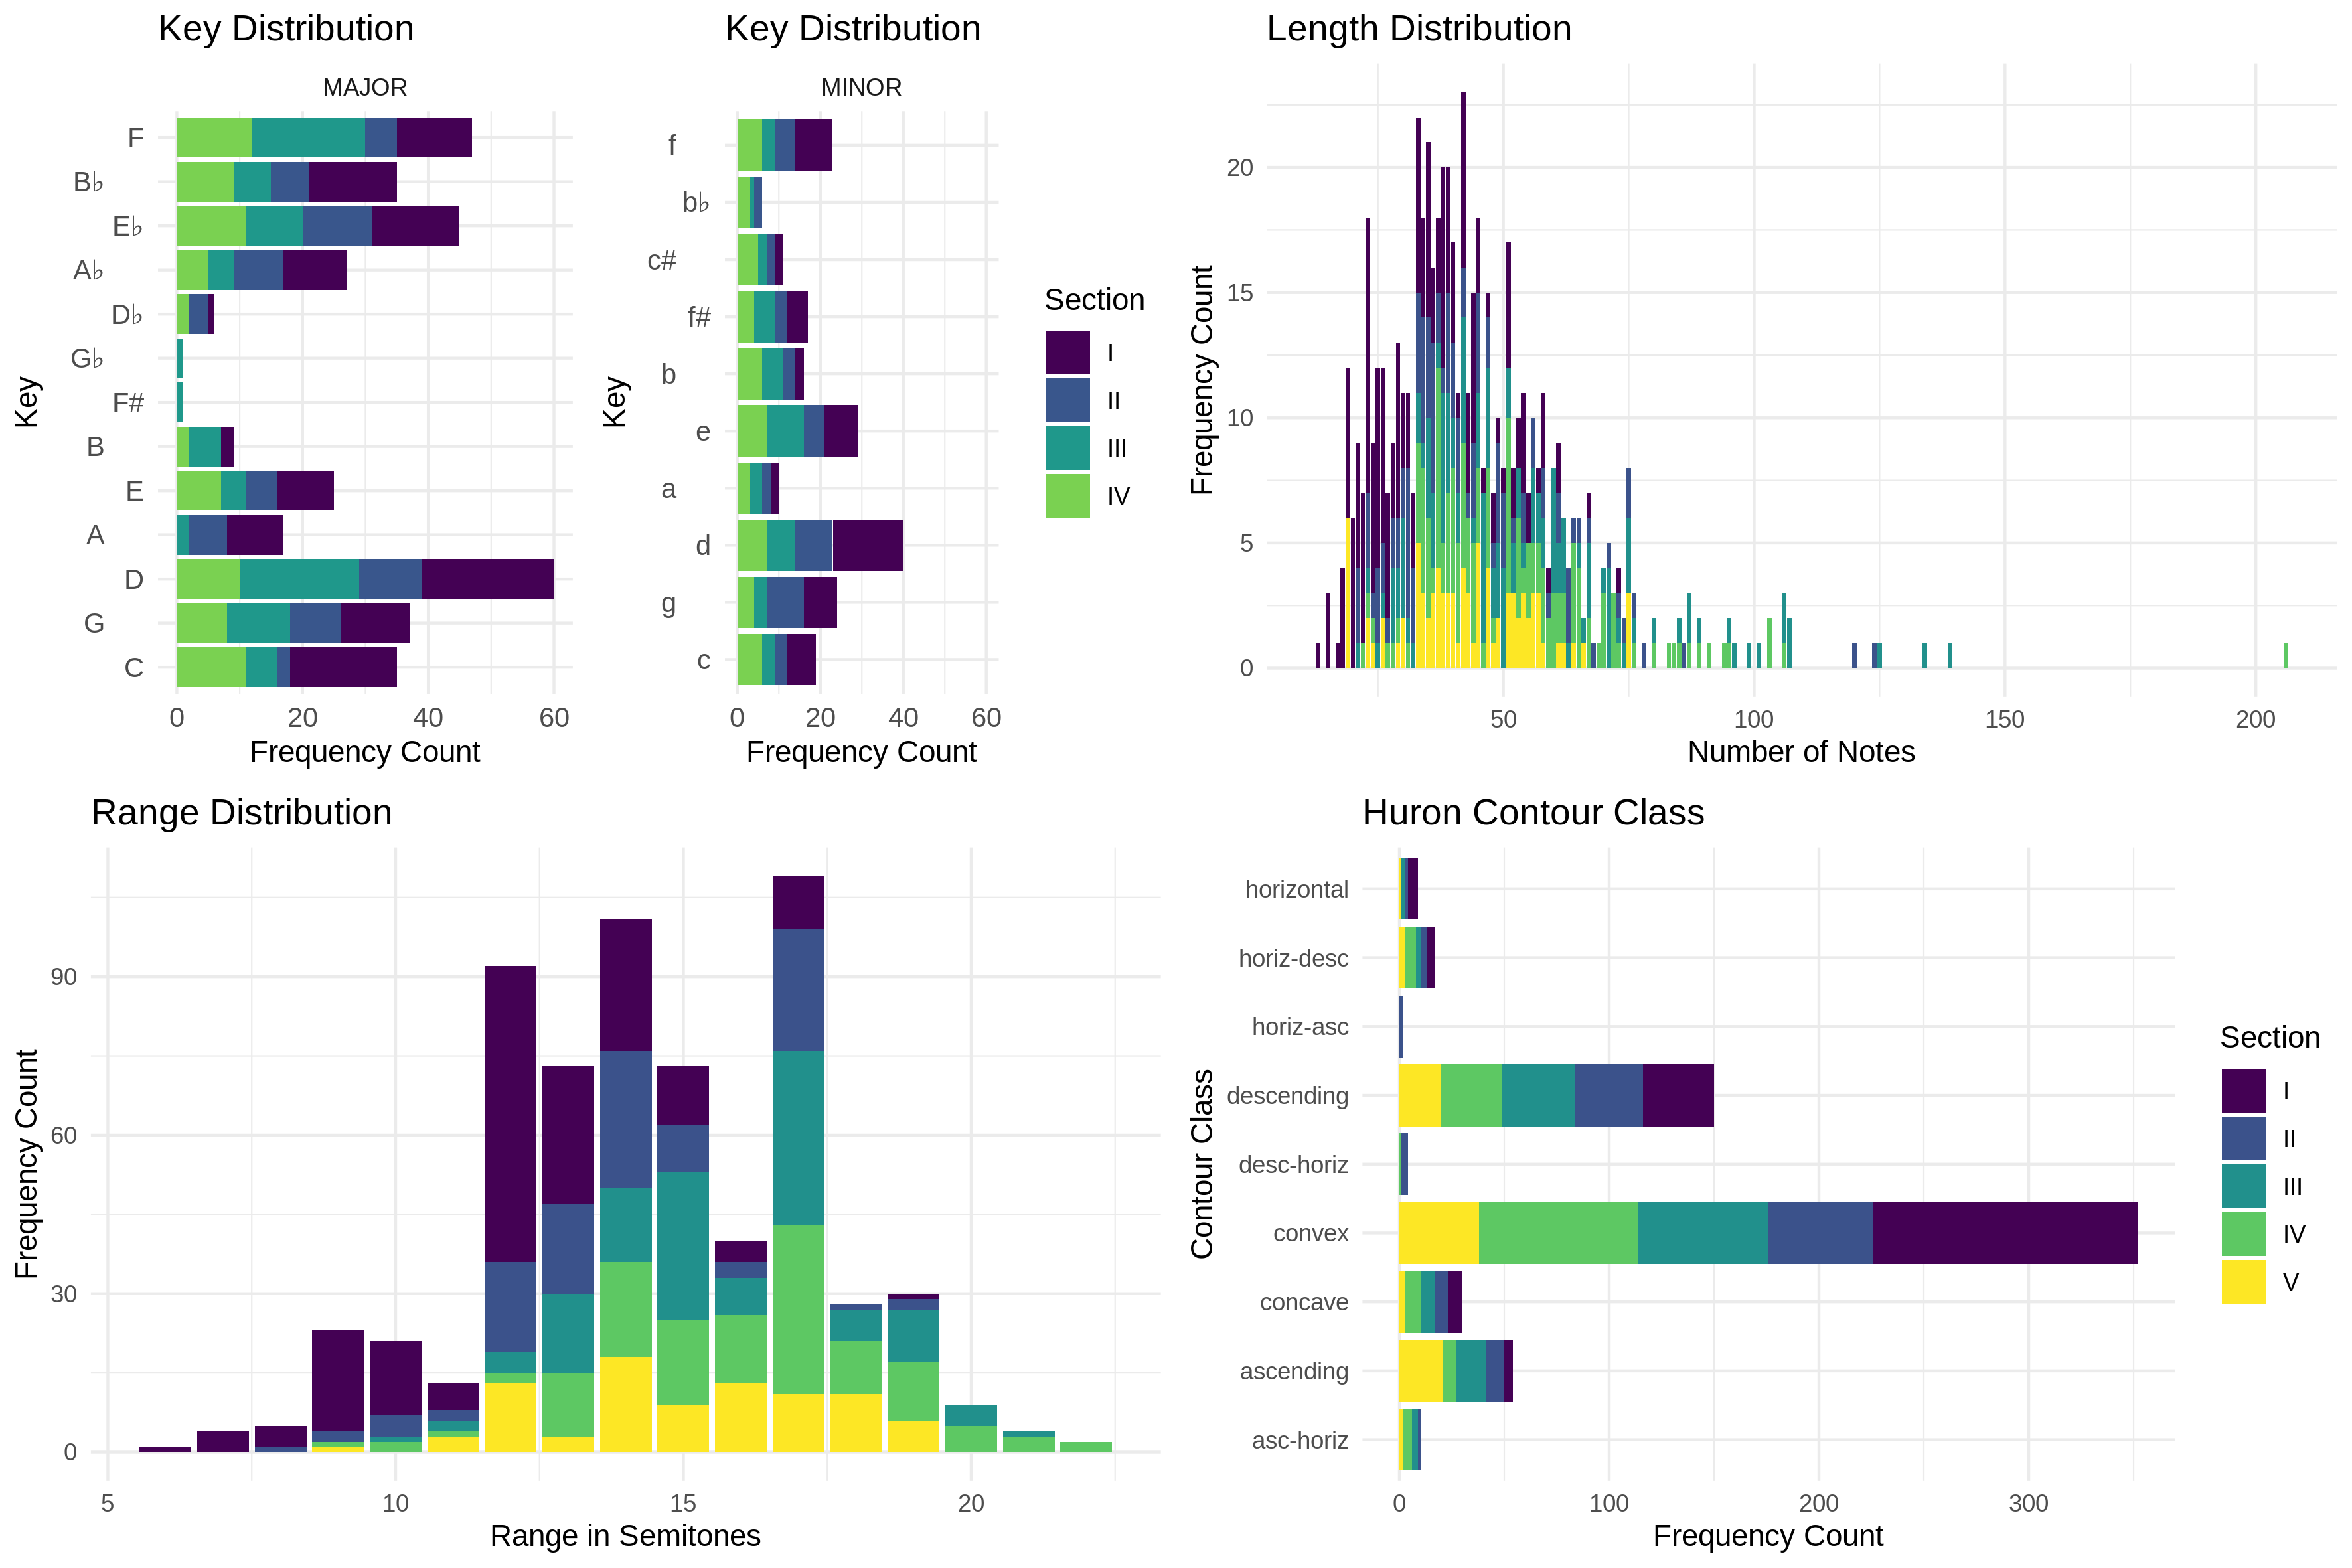
Fig. 1. Descriptive statistics of MeloSol.
The figures presented in this data report describe the MeloSol corpus from a macro perspective. I note that Section V was removed from the top left portion of Figure 1 as the majority of melodies in the atonal section of the corpus are encoded with a zero flat, zero sharp key signature and including those in the figure would skew C major and A minor's representation. The bottom right panel describing the Huron Contour Class is computed using the FANTASTIC toolbox (Müllensiefen, 2009) described below and was first presented by Huron (1996).
COMPARISON
In order to further contextualize the MeloSol corpus with others found in the literature on musical corpora, I briefly compare descriptive statistics from the MeloSol corpus with both The Densmore Collection of Native American Songs (Neubarth, Shanahan, & Conklin, 2018; Shanahan, Neubarth, & Conklin, 2016; Shanahan & Shanahan, 2014) as well as the European and Asian subset of the Essen Folk Song Collection (Schaffrath, 1995) (see Figure 2). I chose both the Densmore and Essen collections, as both corpora contain monophonic melodies. Further, I compare the MeloSol with the Essen collection as the Essen collection has been used as a proxy for representing the implicit understanding of the structure of Western, tonal music in computational models that depend theoretically on the concept of implicit, statistical learning (Demorest & Morrison, 2016; Huron, 2006; Pearce, 2018).
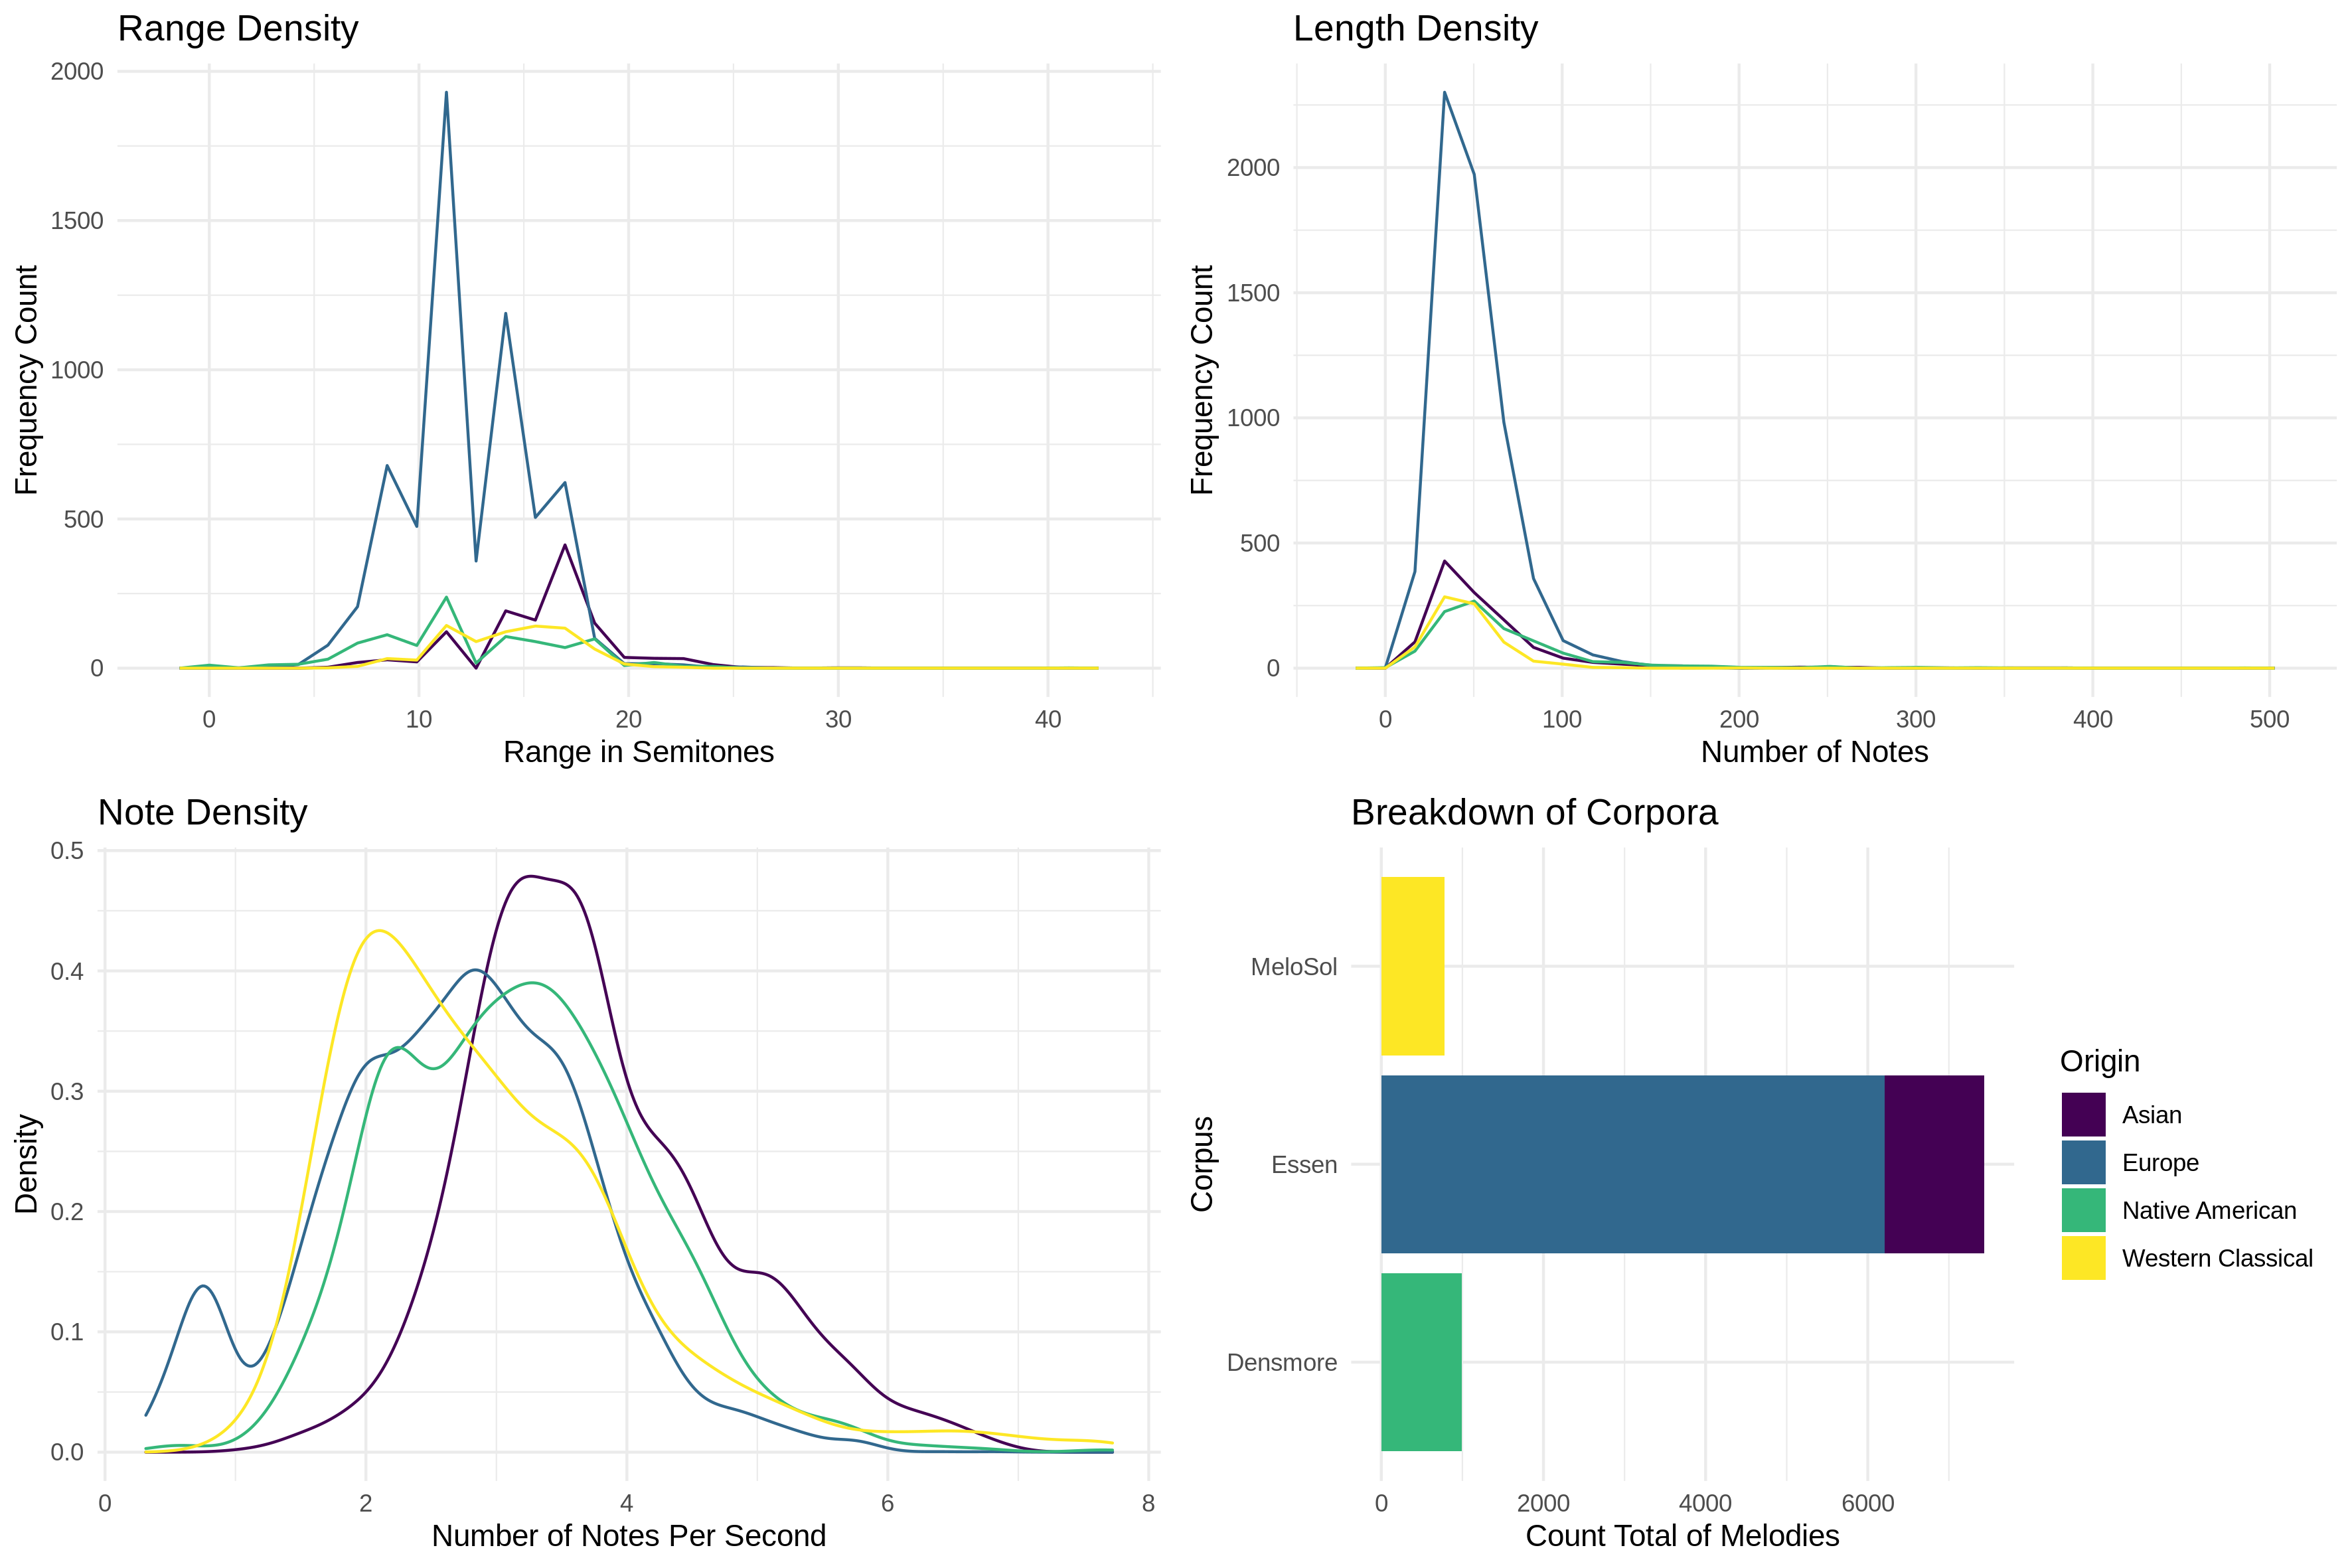
Fig. 2. Descriptive features of corpora. Yellow = MeloSol corpus, blue= European subset of the Essen Folk Song Collection, purple = Asian subset of the Essen Folk Song Collection, green = The Densmore Collection of Native American Songs
As evident in Figure 2, the MeloSol corpus— shown in yellow on all plots— is relatively smaller than the Essen (blue and purple) and the Densmore (green) by a factor of 9.5 and 1.3 respectively. Though given this large difference in total size, the distributions of some summary features exhibit similar properties. For example, as evident in the top row of Figure 2, all corpora tend to fall within the same bounds of both the range and length metrics but exhibit different patterns within those bounds. The range density of the Asian and European subsets of the Essen corpus have median pitch ranges of 17 and 12 semitones respectively. The Densmore appears to have a distinct peak at 11 semitones, contrasted with no clear peaks emerging from the MeloSol. This pattern could possibly reflect the compositional and didactic constraints of the MeloSol melodies compared with melodies that do not generate from such a constrained system. While some melodies in all corpora extend far beyond 100 notes, this might actually reflect the explicit repetition of musical material instead of the use of a repeat or da capo. Future users of this corpus may be interested in performing their own exploratory data analysis with the extreme outliers excluded, as more granular patterns are visible when explored within smaller bounds on the axes.
Figure 3 moves from data derived from count features of analyzable tokens to instead compute various summary statistics features derived from the FANTASTIC toolbox (Müllensiefen, 2009). The FANTASTIC toolbox, an acronym for Feature ANalysis Technology Accessing STatistics (In a Corpus), is a computational implementation of summary features of melodies inspired by work in computational linguistics, music theory, and music psychology. Brief descriptions of each feature are provided in the captions of the figures. For a complete description of each of the features, interested readers should consult the FANTASTIC documentation, but I note that all of the FANTASTIC computations for the MeloSol, Essen, and Densmore are found in the MeloSol repository for reproducible and future research.
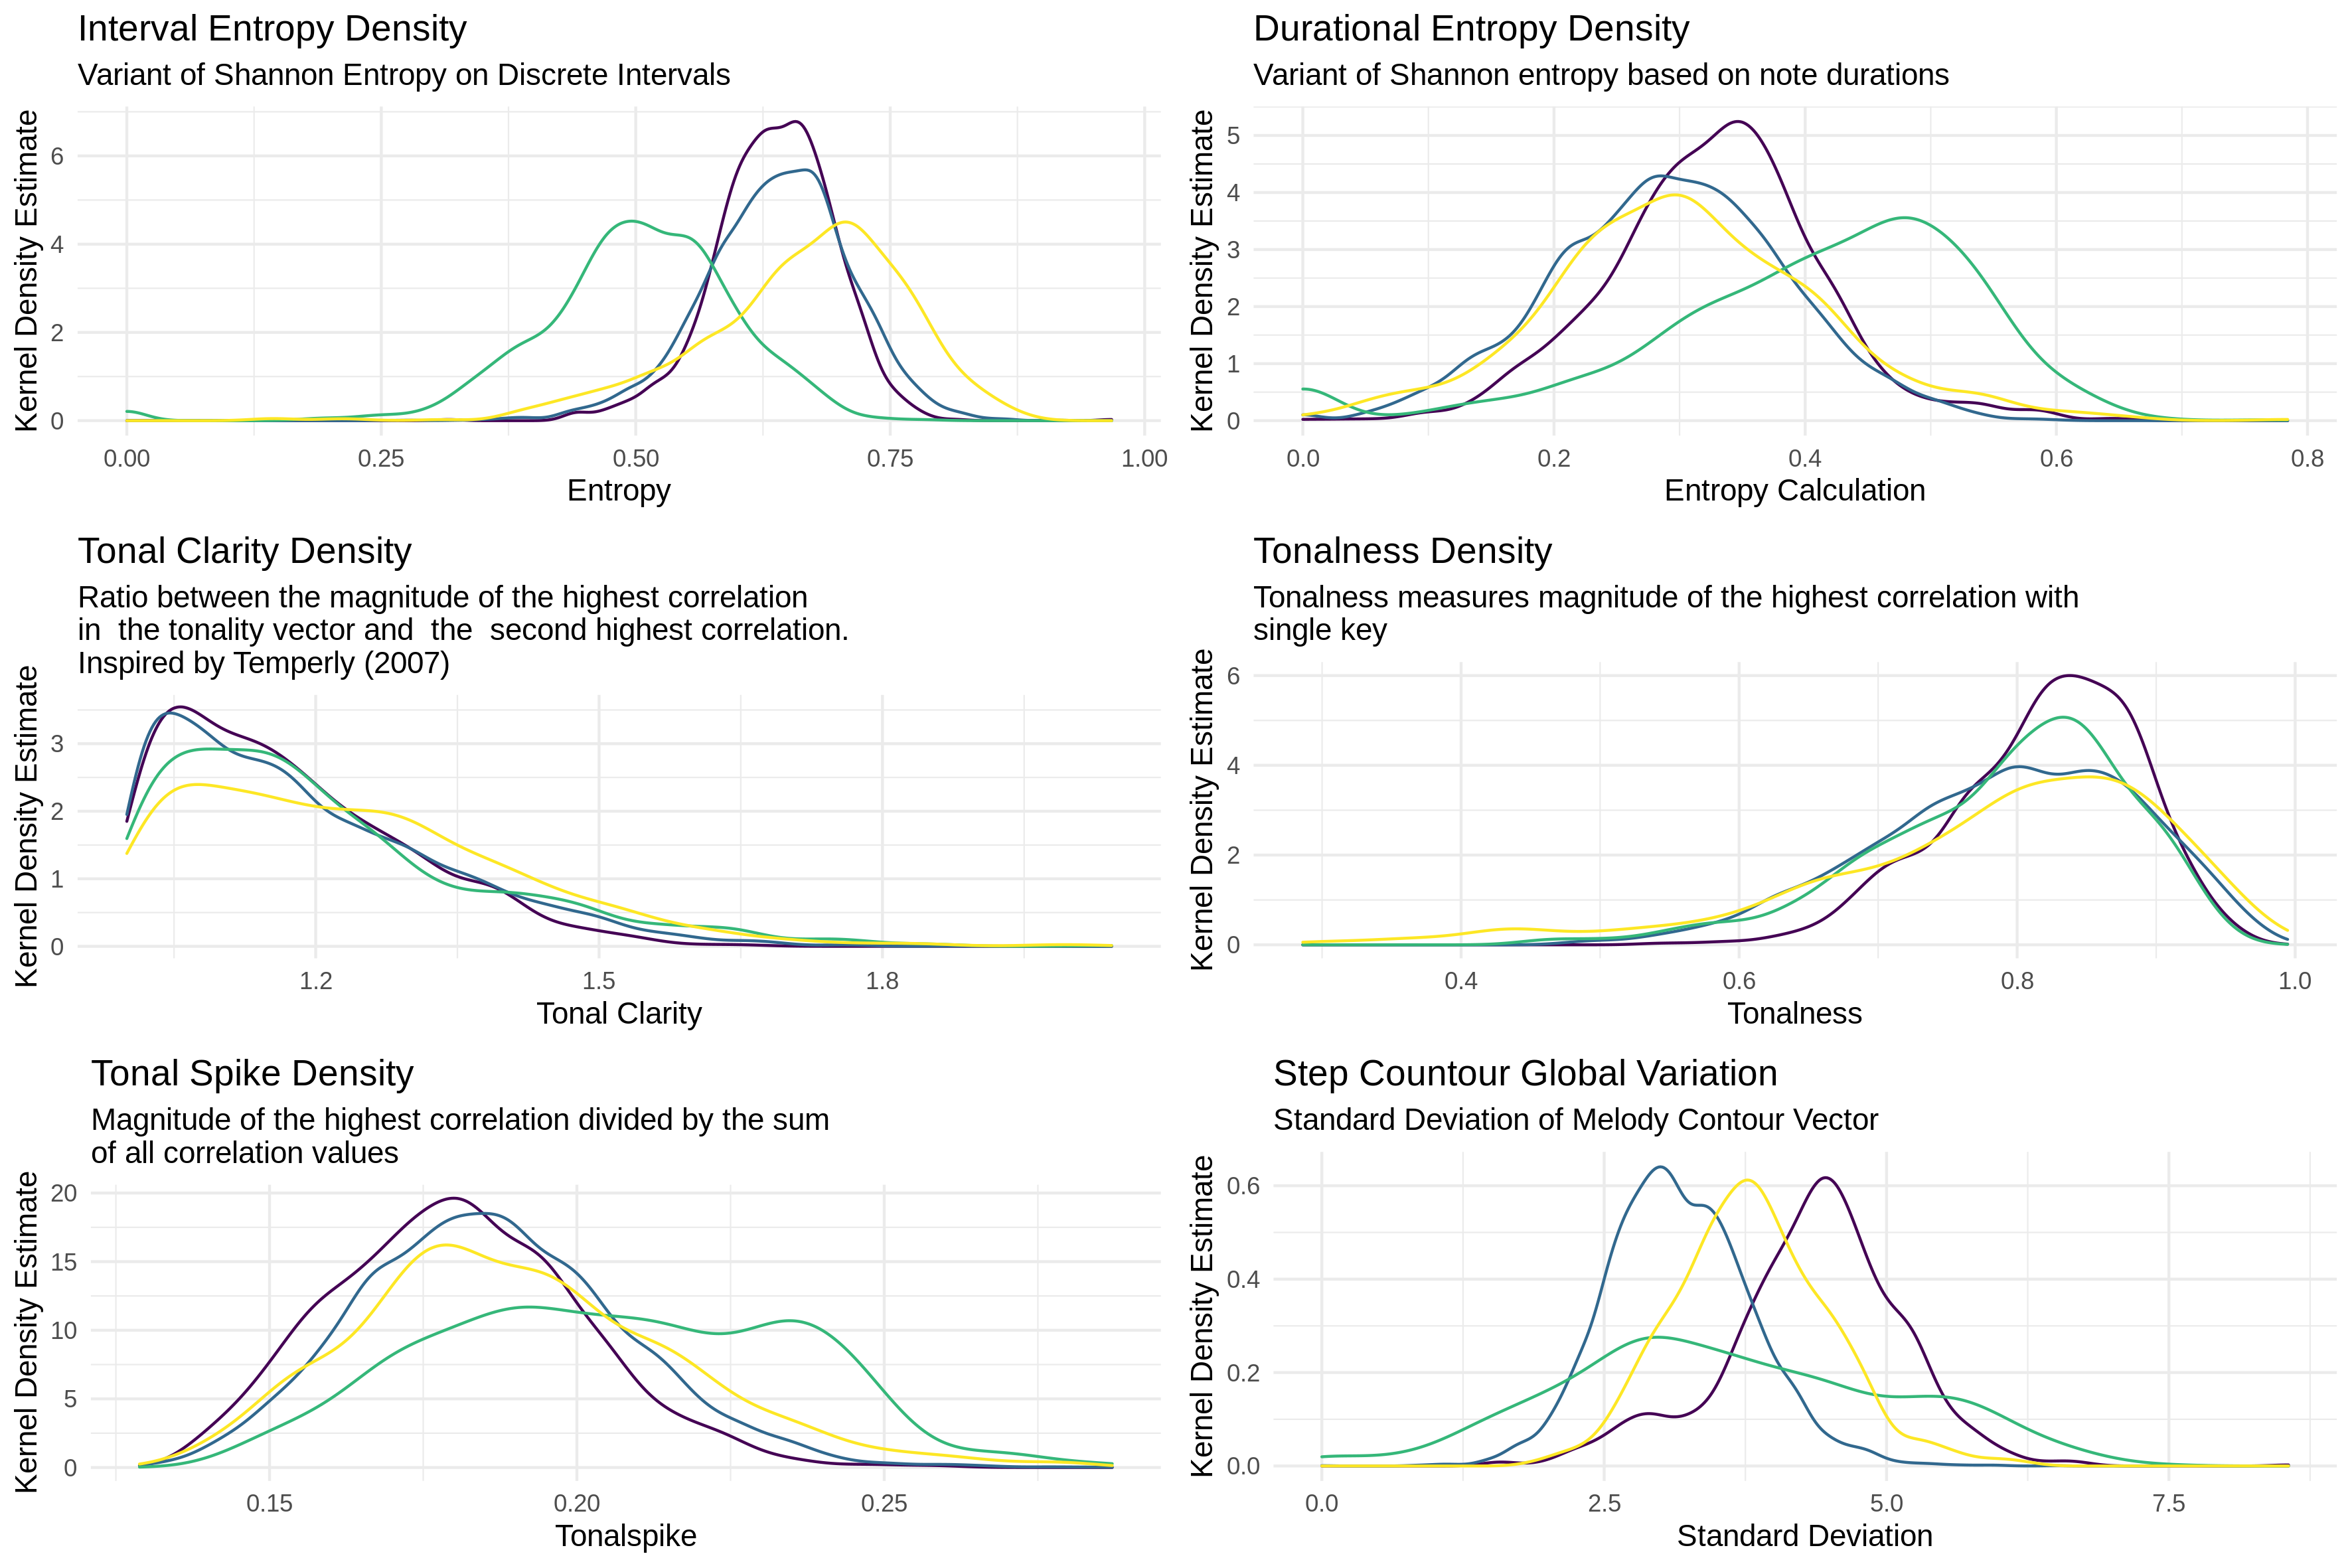
Fig. 3. FANTASTIC computed features of corpora. Yellow = MeloSol corpus, blue= European subset of the Essen Folk Song Collection, purple = Asian subset of the Essen Folk Song Collection, green = The Densmore Collection of Native American Songs
Of interest to readers specifically working with the MeloSol corpus might be the generally higher distribution of interval entropy (Figure 3, top left) — a measure derived from tools of information content—within MeloSol and the lower degree of durational entropy (which can be roughly understood as rhythmic entropy) when compared to the Densmore collection, again reflecting the unique pedagogical nature of this corpus. These higher interval entropy calculations most likely reflect the inclusion of more highly chromatic and atonal melodies in this corpus. Users of this corpus should be aware of the very clear stylistic diversity that is included in this corpus when considering which sections to decide to include in their analyses.
As the MeloSol corpus comprises Western, tonal music, this corpus might be used in order to continue research investigating empirical claims regarding patterns found in Western, tonal music. For example, work from Huron (1996) investigated the distribution of melodic arches in 6,251 melodies using the European subset of the Essen corpus. In Huron's first analysis of these arches, Huron proposes nine separate contour classes that are readily available for computation via the FANTASTIC toolbox. Since the MeloSol corpus does not have the phrase markings needed to exactly replicate the first analysis of Huron (1996), Figure 4 recreates the analysis of the nine proposed contour classes over the entire melodies from the combined corpus. Despite this, the contours of the MeloSol corpus' melodies tend to behave similarly to that of the Essen collection with a predominance of convex contours, followed by ascending, then descending contours as initially demonstrated by Baker (2019). This melody-level, as opposed to phrase-level, analysis demonstrates the need for future versions of the MeloSol corpus to incorporate finer granularity of annotations for phrase level analyses.
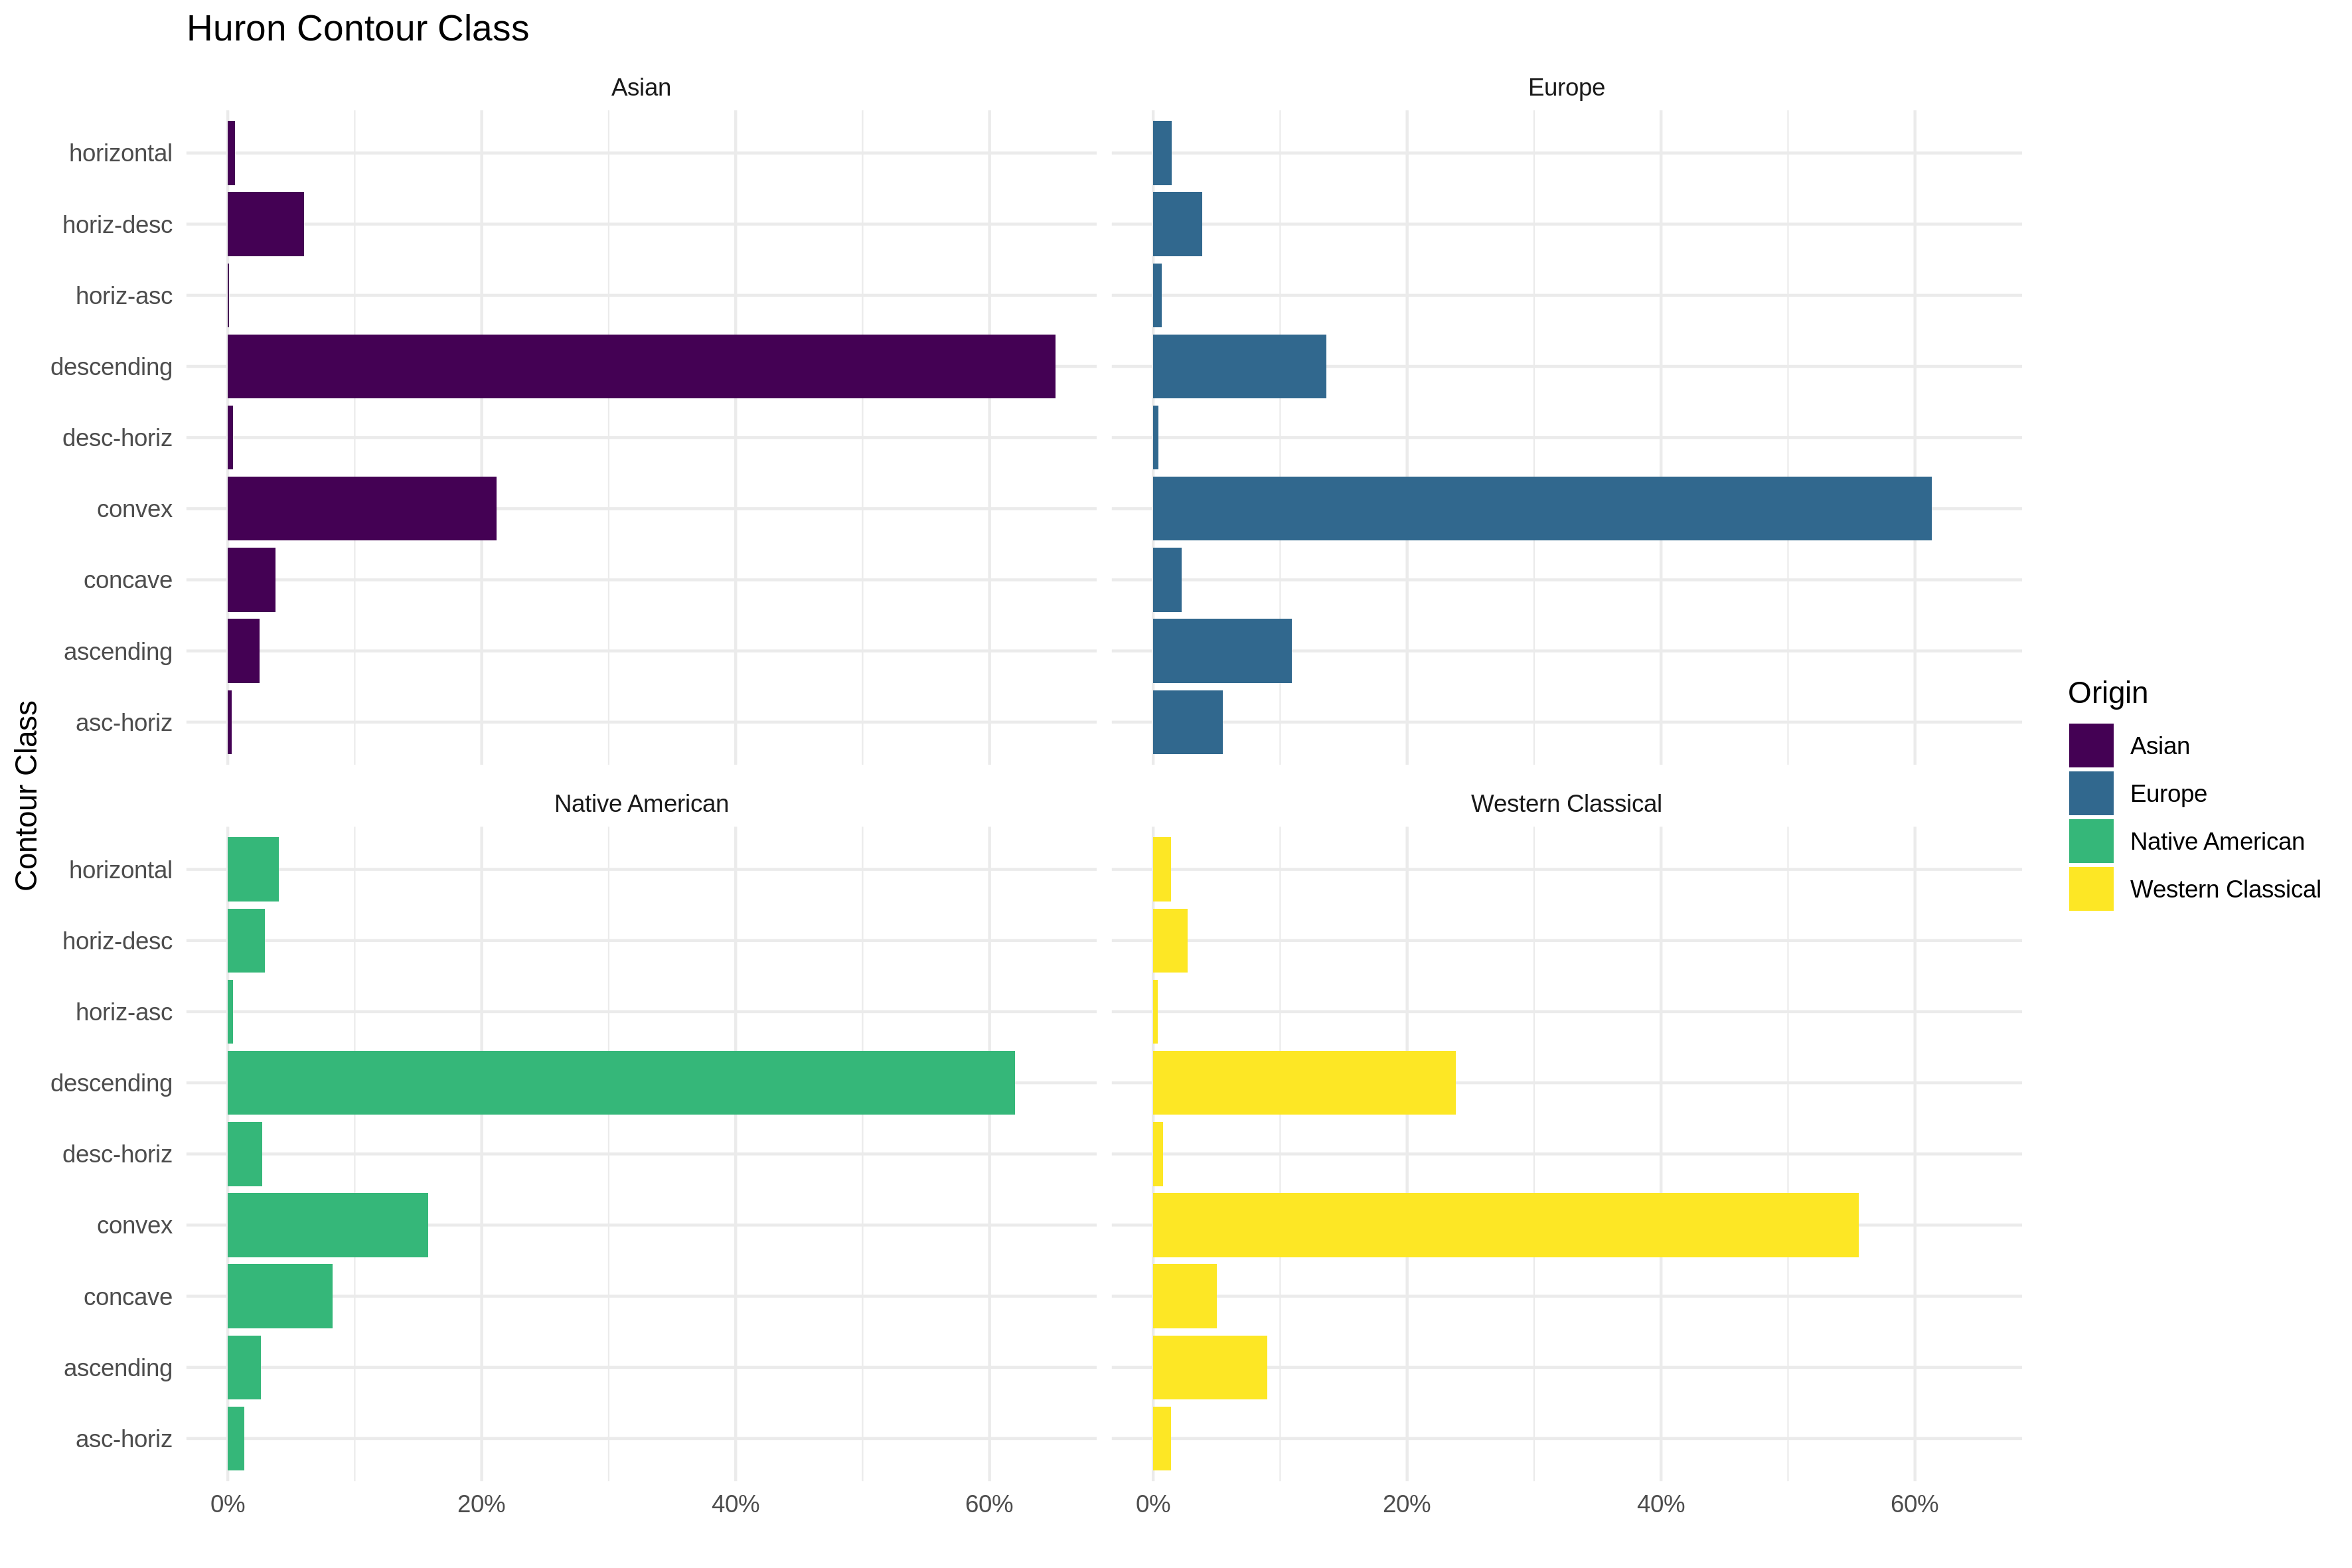
Fig. 4. Huron contour class comparison. Yellow = MeloSol corpus, blue= European subset of the Essen Folk Song Collection, purple = Asian subset of the Essen Folk Song Collection, green = The Densmore Collection of Native American Songs
As the MeloSol corpus contains music associated with Western, tonal music, the corpus could also be used in further work in lieu of the Essen collection as a dataset in which to train computational models of melodic expectation (Pearce, 2018) within music cognition research. In order to demonstrate the similarity between corpora, I provide estimations of the proportion of how frequently certain absolute intervals occur in both the Essen and MeloSol corpora. These melodic intervals, or bigrams, are calculated by using the melodic interval tool in the humdrum toolkit. Despite the relative difference in size of the corpora, Figure 5 displays the stability of these intervals.
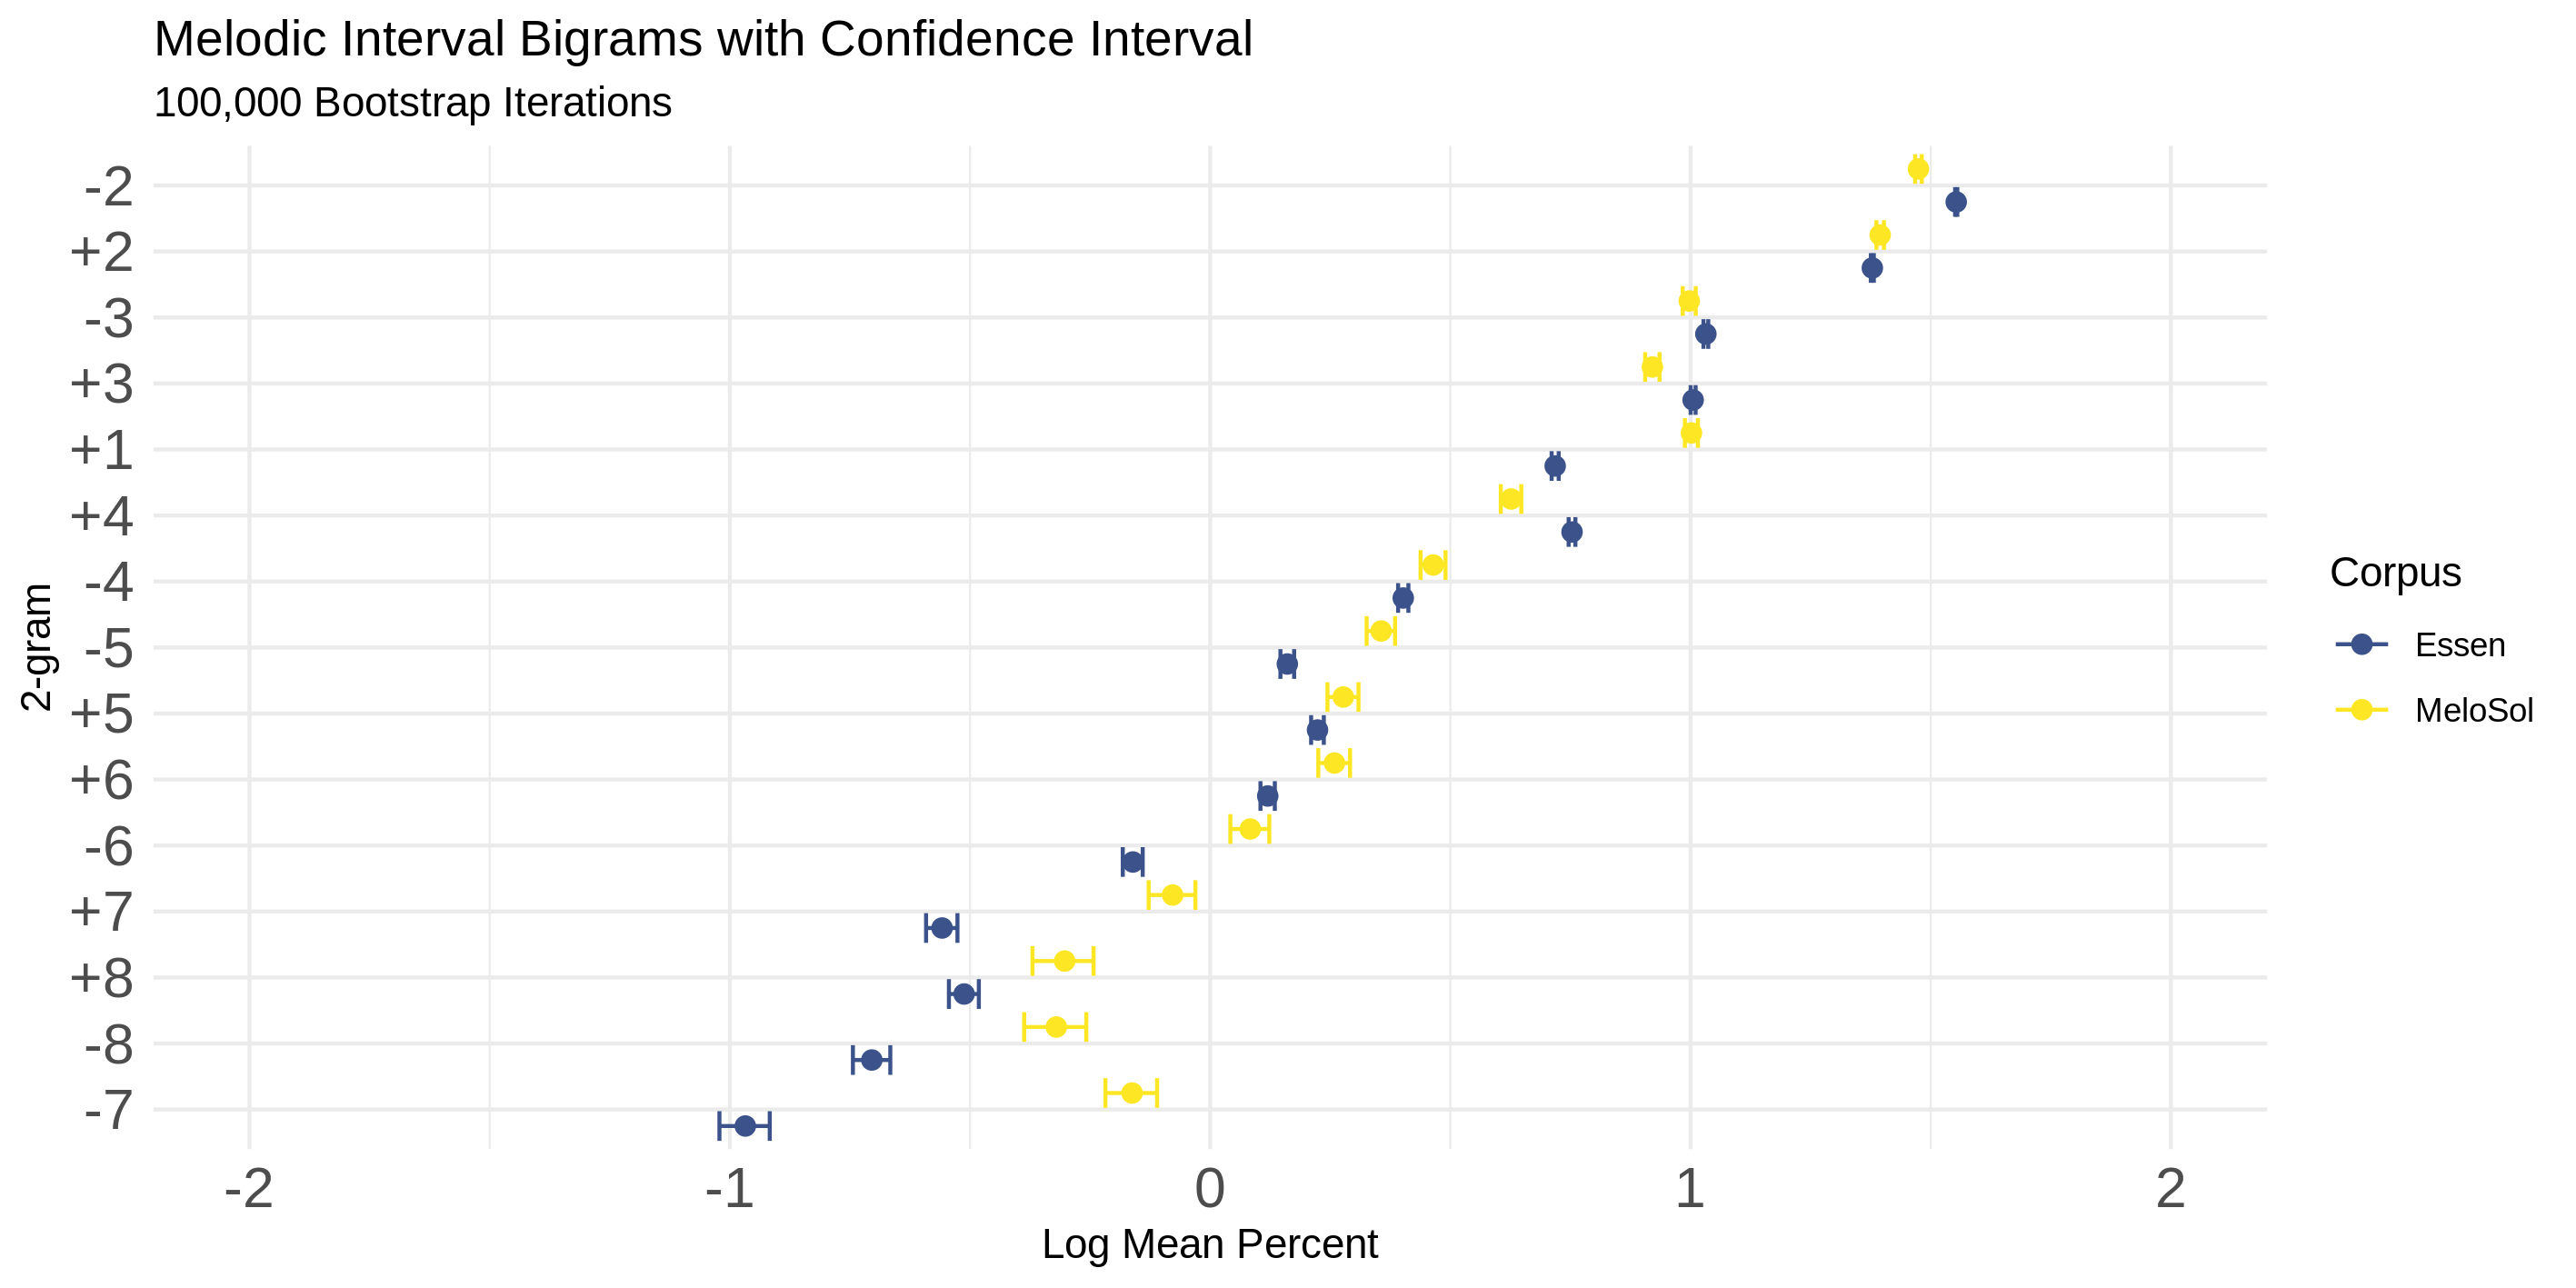
Fig. 5. Melodic interval bigrams correlation between MeloSol (yellow) and Essen (blue) n-grams.
The intervals of both the Essen and MeloSol corpora are presented with bootstrap confidence intervals (R = 100,000) for each proportion parameter. Said another way, Figure 5 demonstrates that the interval patterns in the corpora share very similar properties in terms of how frequently they occur. In interpreting this figure, if each interval from each corpus appeared with the same relative frequency, the pairings would match exactly. The presentation of intervals is arranged so that more frequently occurring intervals appear higher in the visualization. The horizontal axes represent the base 10 logarithm of the percentage of that bigram of all the bigrams in the corpus.
The similarity of intervals as indicated by the relative close proximity of pairings from each bigram suggests a high degree of stability given shorter transitional probabilities. In order to explore how the frequency of n-grams breaks down as a function of length of n-gram, Figure 6 plots the Spearman correlation coefficient reflecting the relationship between the ranked frequency of each size n-gram. For example, moving beyond a bigram that would just comprise two notes (one interval), a 4-gram would be a string of absolute consecutive intervals generated from five notes. Even at the 4-gram level, the Essen and the MeloSol corpora are strongly correlated at ρ(1402)= .802, although this pattern breaks down with longer n-grams. Scripts to reproduce these analyses can be found in the corpus repository.
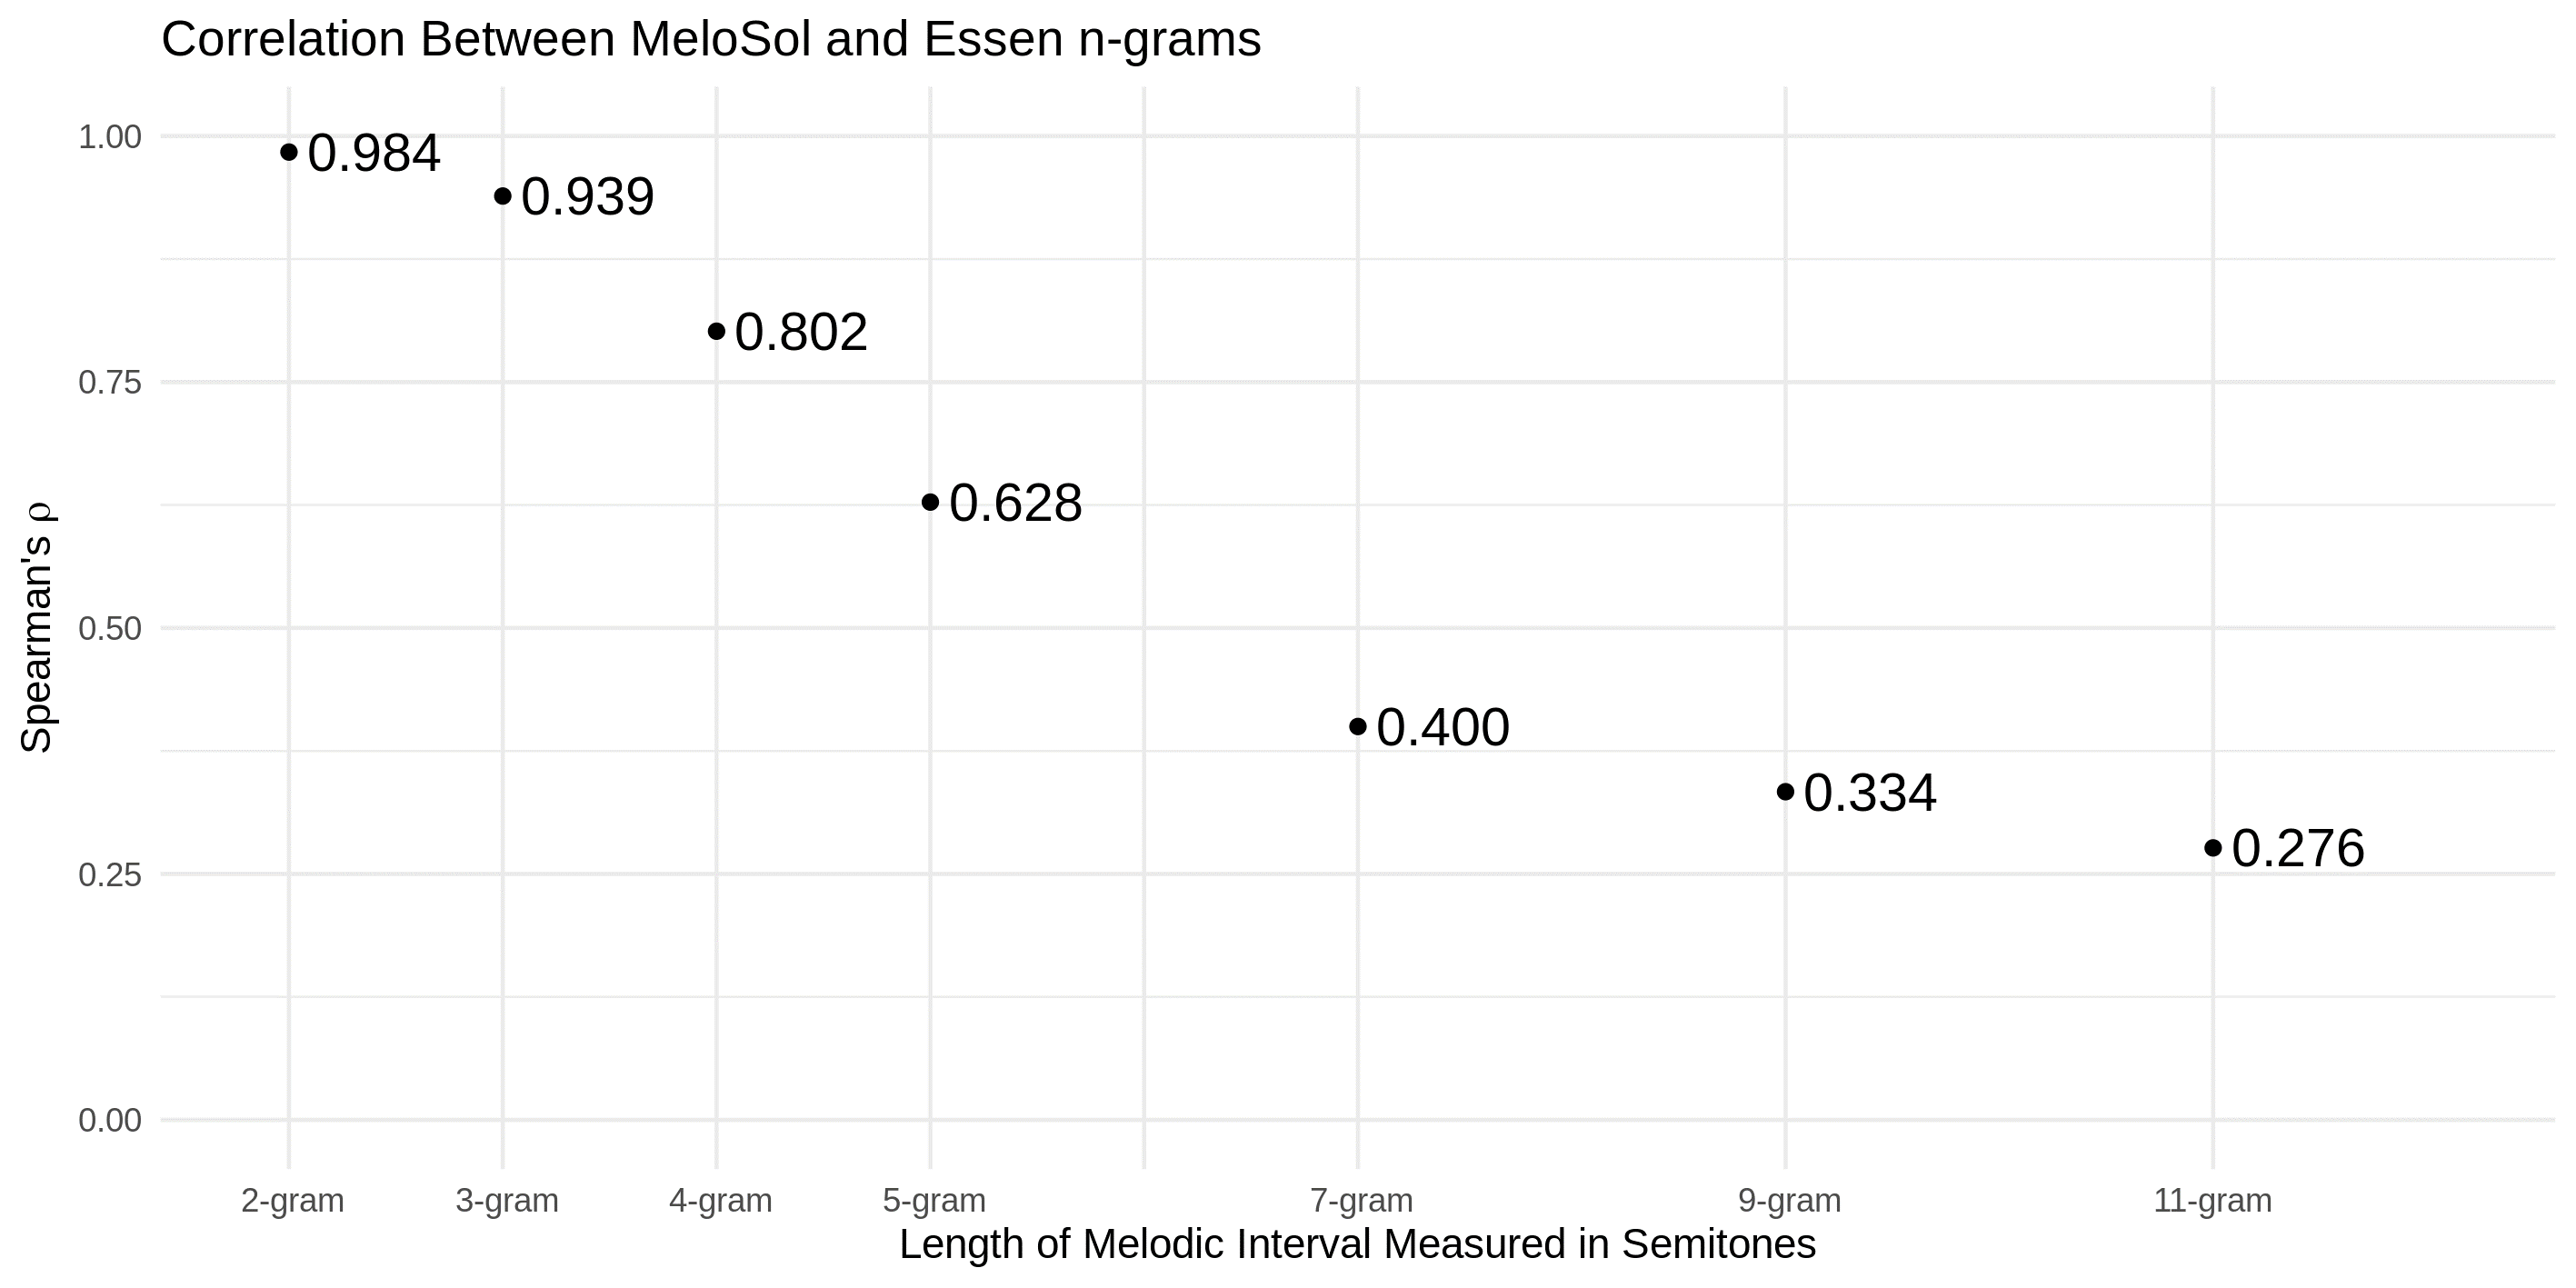
Fig. 6. Correlation between MeloSol and Essen n-grams.
As expected, an increased n in the n-gram results in a weaker relationship between the two corpora. Despite the MeloSol corpus being designed for didactic purposes, the MeloSol corpus appears to reflect many of the global characteristics of the Essen. Given many of the theoretical assumptions that come along with using a musical corpus as the basis for an individual's latent understanding of a musical structure either now (Huron, 2006) or the in the past (Byros, 2009), perhaps other corpora like the MeloSol could be chosen as the basis for these models rather than deferring to the Essen on account of size alone. Further research that combines perceptual assumption of statistical learning with corpus studies might further explore how different corpora either do or do not lead to different model fits when modeling perceptual data.
I finally note that as this corpus was initially developed in order to investigate how to make pedagogical improvements in aural skills classrooms. Using MeloSol for this purpose would be a logical extension to this program of research (Baker, 2019).
CORPUS
The corpus, accompanying data, scripts to reproduce all analyses, as well as the documentation for the MeloSol corpus can be found at www.github.com/davidjohnbaker1/melosol.
ACKNOWLEDGMENTS
I would like to thank Adam Rosado, Elizabeth Monzingo, and Connor Davis for their help encoding some of the melodies for this corpus, as well as Peter Harrison and Kework Kalustian for help on the bootstrap analysis. Additionally, I would like to thank Daniel Shanahan and Craig Sapp for technical support while working with and always teaching me things about humdrum, as well as the two anonymous peer reviewers for their ideas that helped improve this manuscript. This article was copyedited by Lottie Anstee and layout edited by Diana Kayser.
NOTES
-
Correspondence can be addressed to: Dr David John Baker, Louisiana State University, Music & Dramatic Arts Building, 4230 Dalrymple Dr, Baton Rouge, LA 70803, United States, Email: david.baker@gold.ac.uk.
Return to Text
REFERENCES
- Baker, D. J. (2019). Modeling melodic dictation. Doctoral dissertation, Louisiana State University, LA. Retrieved from: https://digitalcommons.lsu.edu/gradschool_dissertations/4960/
- Byros. V. (2009). Foundations of tonality as situated cognition. 1730-1830: an inquiry into the culture and cognition of eighteenth-century tonality with Beethoven's "Eroica" symphony as a case study. Doctoral dissertation, Yale University, CT.
- Berkowitz, S., Fontrier, G., Kraft, L., Goldstein, P., & Smaldone, E. (2011). A new approach to sight singing (5th ed). New York, NY: W.W. Norton.
- Demorest, S. M., & Morrison, S. J. (2016). Quantifying culture: the cultural distance hypothesis of melodic expectancy. In J. Y. Chiao, S. C. Li, R. Seligman & R. Turner (Eds.), The Oxford Handbook of Cultural Neuroscience (pp. 183-194). New York, NY: Oxford University Press.
- Huron, D. (1994). The Humdrum Toolkit: Reference Manual. Stanford, CA: Center for Computer Assisted Research in the Humanities.
- Huron, D. (1996). The melodic arch in Western folk songs. Computing in Musicology, 10, 3–23.
- Huron, D. (2006). Sweet anticipation. Cambridge, MA: MIT Press. https://doi.org/10.7551/mitpress/6575.001.0001
- Müllensiefen, D. (2009). Fantastic: Feature ANalysis Technology Accessing STatistics (In a Corpus): technical report v1.5. London, UK: Goldsmiths University of London.
- Neubarth, K., Shanahan, D., & Conklin, D. (2018). Supervised descriptive pattern discovery in Native American music. Journal of New Music Research, 47(1), 1–16. https://doi.org/10.1080/09298215.2017.1353637
- Pearce, M. T. (2018). Statistical learning and probabilistic prediction in music cognition: mechanisms of stylistic enculturation: statistical learning and prediction. Annals of the New York Academy of Sciences, 1423(1), 378–395. https://doi.org/10.1111/nyas.13654
- Sapp, C. (2008). Humdrum extras. [Computer Software]. Retrieved from: http://extras.humdrum.org/
- Schaffrath, H., & Huron, D. (1995). The Essen folksong collection in the humdrum kern format. Menlo Park, CA: Center for Computer Assisted Research in the Humanities.
- Shanahan, D., & Shanahan, E. (2014). The Densmore collection of Native American songs: a new corpus for studies of effects of geography, language, and social function on folk song. In M. K. Song (Ed.), Proceedings of the 13th International Conference for Music Perception and Cognition. Seoul, South Korea: College of Music, Yonsei University.
- Shanahan, D., Neubarth, K., & Conklin, D. (2016). Mining musical traits of social functions in Native American music. In J. Devaney, M. I. Mandel, D. Turnbull & G. Tzanetakis (Eds.), Proceedings of 17th International Society of Music Information Retrieval Conference (pp. 681-687). Canada: ISMIR. https://doi.org/10.5281/zenodo.1416408
- Schweer, W., Nicholas, F., & Bonte, T. (2019). MuseScore [Computer Software]. Muse Group.
