
AS musicians, we tend to imagine pitch and meter as intimately woven together, each informing our perception of the other. A listener might group pitches into harmonies with the help of a passage's metric accents, while the music's harmonic outline might help a listener identify accent. However, the exact nature of this interaction has been the subject of much debate in music psychology research. While several studies have shown no interactions between the domains of pitch and rhythm in judgments of melodic pleasantness (Makris & Mullet, 2003), memory (Krumhansl 1991), and attentiveness to change (Thompson, 1994), other studies show interaction in perceived emotion (Schellenberg, Krysciak, & Campbell, 2000), melody recognition (Abe & Okada, 2004), melodic patterning (Pfordresher, 2003) and pitch change (Jones, Johnson, & Puente, 2006).
But the interaction between tonal hierarchies and metrical hierarchies is especially ambiguous, and is a topic of increasing interest in music cognition discourse. By tonal hierarchy, we mean a system in which certain pitches are understood as more stable or structural than others, with pitches ranked or organized in terms of these stability/instability relationships (Lerdahl & Jackendoff, 1983; Krumhansl, 1990; Dibben, 1994). Krumhansl and Kessler's (1982) well-known key profile, shown in Figure 1a, models such a major-mode tonal hierarchy of scale degrees. The vector captures average "goodness of fit" ratings given by participants to probe tones after hearing tonally-orienting passages, with the notes of the tonic triad (^1, 3, 5) rated highest, after which appear the notes of the diatonic (major) scale outside the tonic triad (^2, 4, 6, 7), followed by the remaining non-diatonic (chromatic) degrees. Metrical hierarchies, on the other hand, involve alterations of strong-weak or strong-weak-weak patterns, and often include many nested levels of relative strength (Palmer & Krumhansl, 1990; London, 2004). Figure 1b shows an example of a metrical hierarchy drawn from Lerdahl & Jackendoff (1983), in which the number of dots indicates relative metrical strength and depth within the hierarchy. Here, every other low-level pulse is stronger, representing the relationship between eighth-note and quarter-note pulses; the two further emphasized layers represent the broader half-note pulse, and the yet broader whole-note pulse. These deeper or broader emphases are often construed as "metrical accents," showing these moments as marked or accented in terms of the broader pulse hierarchy (Cooper & Meyer, 1960; London, 2004).

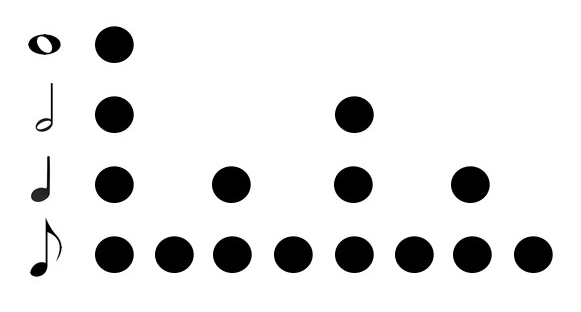
Fig. 1. Two representations of musical hierarchy: (a) Krumhansl's Major key profile vector, (b) Lerdahl and Jackendoff's 4/4 metric hierarchy
Importantly, both hierarchies can be understood as cognitive templates imposed upon music by listeners, rather than actual phenomena present in musical signals (Huron, 2006). Metrical patterns need not be consistently emphasized with relatively strong and weak accents in order to be perceived (London, 2004) just as tonally stable pitches do not need to be emphasized in order for a tonal hierarchy to be understood (Larson, 1997). In fact, much evidence points to listeners imposing hierarchies with very little musical context in both metric (Brochard et al, 2003; Desain & Honing, 2003; Palmer & Krumhansl, 1990) and tonal domains (Cuddy & Badertscher, 1987; Krumhansl, 1990; Smith & Schmuckler, 2004).
It is also true that musical corpora show that certain statistical properties align with these hierarchies. Key-profile vectors are highly correlated to the relative frequencies with which the scale degrees occur within Western-European tonal corpora, with more stable pitches occurring more frequently (Krumhansl, 1990; Aarden, 2003; Temperley, 2007; Huron, 2006; White, 2013b), and more stable harmonic structures (e.g., tonic triads) appearing more frequently than dissonant structures (White, 2013a; White 2014; White, 2015). Similarly, more note onsets tend to occur on relatively strong metrical positions (Boone, 2000), allowing for computational modeling and machine learning of meter using this property (Bello et al, 2005; Gouyon et al, 2006; Temperley, 2010; Zikanov, 2014).
Even though both hierarchies address ostensibly different musical domains, music theories often frame these hierarchies as interwoven, each informing the other. The preference rules of Lerdahl and Jackendoff (1983), for instance, indicate that metrical emphases should be chosen to correspond to changes of harmony, while prolongational boundaries should themselves be chosen to conform with metrical emphases.2 Corpus data also illustrates an interaction between these hierarchies, showing that the frequency of chords and scale degrees correlate with the metric strength on which they tend to sound: structures with higher overall frequencies in a data set tend to occur on metrically strong beats, while less-frequently occurring structures occur on weaker metrical positions (White, 2013b; Prince & Schmuckler, 2014).
Human-response experimentation has also indicated these two domains tend to be interconnected (Schmuckler, 1989; Boltz, 1991). For instance, in probe-tone experiments, when asked to report whether the heard probe tone occurred on a beat or off a beat, participants tended to report stable tones as being on a beat, even in metrically ambiguous situations (Prince, Thompson, & Schmuckler, 2009). Similarly, Rosenthal and Hannon (2016) found that metrical position affects listeners' ratings of probe-tones after being exposed to whole-tone melodies that followed a non-uniform key profile distribution.
The current study contributes to this research by explicitly testing whether listeners use tonal stability to choose a downbeat in a metrically ambiguous situation. Listeners use a myriad of musical characteristics when entraining to a metrical pattern, including the length/duration of sounds (Woodrow, 1909; Parncutt, 1994; Szelag et al, 1998; London, 2004; Repp, 2007; Ellis & Jones, 2009), notated meter (Vazan & Schober, 2000), melodic contour (Squire, 1901; Woodrow, 1911; Thomassen, 1982; 1983; Huron & Royal, 1996) and grouping (Fraisse, 1946; Hannon et al, 2004; Repp, Iversen, & Patel, 2008), as well as the interactions between these domains (Monahan, Kendall, & Carterette 1987; Drake, Dowling, & Palmer, 1991; Pfordresher, 2003; Toiviainen & Snyder, 2003; Abecasis et al, 2005; Acevedo, Temperley, & Pfordresher, 2013).
This study isolates the domain of tonal stability in monophonic pitch patterns to determine its effect on the identification of metrical accents. Specifically, we will present listeners with insufficient information to create a metric hierarchy, but sufficient information to create a tonal hierarchy, and then observe whether participants use the tonal hierarchy to determine the pattern of metric accents. While the first three experiments focus on this interaction, the final experiment will begin to investigate the inverse: whether participants disambiguate a tonal hierarchy using accentual information. While harmony, chord choice, and voiceleading are all of certain importance to musical hierarchies, in order to simplify our analysis and to isolate tonal and metric parameters, we will focus on monophonic stimuli in these experiments. In this way, we will gain some insight into the interaction between tonal and metric hierarchies.
EXPERIMENT 1
In order to isolate the effects of pitch stability, we designed an experiment in two parts: a tonal orientation and a forced-choice grouping task. The former's design draws on the tonal-orientation stimuli of probe tone experiments (e.g., Krumhansl, 1990; Aarden, 2003) in which a tonally-determinate chord progression is played for a participant. The second part, a forced-choice task, was based on "objective rhythmicization" tests. In these types of tasks, participants are asked to metrically entrain (i.e., identify relatively emphasized pulses) to a series of tones in which one musical parameter (e.g., pitch, duration, volume, speed) is somehow manipulated. Participants tap what they perceive as emphasized beats, with the parameter varying between trials in order to test its effect (see in Repp, 2005 for a review of "tapping" literature). (NB: These "objective" designs contrast with "subjective rhythmicization" tasks in which listeners hear an undifferentiated pulse like a constant metronome click; the listeners are then asked to metrically interpret that constant pulse.) This design allows us to ask direct questions of our participants, as we give them a situation with some type of tonal determinacy and ask them to choose their preferred metric accent. Tapping tasks also allow us to approximate (albeit crudely) a listener's perception of a metric hierarchy, as the listener is identifying one pulse as more marked/accented than the other. Relying on the findings of the above-cited studies of tonal hierarchies and the metric exposure experiments of Creel (2011), this experiment varies the probability/stability of pitch classes. That is, instead of – say – inducing a duple metrical pattern using a loud-soft-loud-soft pattern, we will manipulate the probability/stability of alternating pitches creating a stable-unstable-stable-unstable pattern. In this study, we restrict ourselves to repetitive monophonic patterns, to specifically isolate the position within a tonal hierarchy associated with single scale degrees. We hypothesize that, given minimal accentual information, participants will hear those pitches they deem as more probable or stable as metrically accented.
Method
PARTICIPANTS
29 undergraduates from the University of North Carolina at Greensboro's School of Music, Theater and Dance participated in return for a snack of their choice. All participants were enrolled in either the Bachelor of Music, the Bachelor of Music Education, or the Bachelor of Arts in Music programs. Median age was 20, and the group included 15 men, 13 women, and 1 genderqueer individual. Participants indicated the number of years they had studied music (0-5, 5-10, 10-15, 15+; for analysis purposes, these were coded using 4 random variables for each possible option), whether they had "some degree of absolute pitch," and their primary instrument.
MATERIALS AND PROCEDURE
All auditory stimuli were presented using in-house software written in MaxMSP (Zicarelli, 1998). Participants interacted with an external Apple Pro keyboard and listened with noise isolation headphones. The MIDI velocity value was set at 100 for the duration of the test, but participants were allowed to adjust the volume to their comfort level before the test began. MIDI patch 0 ("acoustic grand piano") was used throughout. The test was conducted in a soundproofed booth, and at the end participants were debriefed on the purpose of the experiment. Pitch height was randomized for each participant, with the program choosing a number between 45 and 65, using that number as the central MIDI pitch, and generating the experiment's pitch material from that central note. MaxMSP tracked the keystrokes for participants' tapping: a tap on a pulse was defined as occurring any time between the program's initiation of a pitch and the initiation of the following pitch.
The test proceeded in two parts, the tonal orientation and the forced-choice task. The tonal orientation included a I-IV-V7-I progression played three times, with each chord lasting 900 milliseconds. The voicing of the three chords was neutrally represented as three ordered sets, [0, 7 16], [-7, 9, 17], and [-5, 11, 17], where the central MIDI pitch is added to each number to create the sounding pitch sets (i.e., 0 represents the key's tonic pitch, 7 would be the dominant pitch seven semitones above, -7 would be the subdominant pitch 7 semitones below; the changing pitch level of the tonic changes the pitch level of the whole progression.)
In the forced choice task, participants heard a melody consisting entirely of two oscillating pitches. In order to mitigate the effect of leaps on accent perception, only pairs of scale degrees separated by whole-step were used. There were four instances of scale-degree pairs: ^1-2, ^2-3, ^4-5 and ^5-6 (in C major: {C-D}, {D-E}, {F-G}, and {G-A}, respectively). This distribution allowed us to control for biases toward lower or higher pitches: in two of these cases, the more stable/probable degree is lower, and in two it is higher. In order to not introduce bias toward the initiating pitch, the switchback pattern was randomized (i.e., ^1-2-1-2… versus ^2-1-2-1…), and the melody faded in over 7 seconds by adding a compounding value of 15 to each of the first 20 MIDI onsets' velocities. The crescendo began immediately after the tonally-orienting chord progression. When velocity reached 300, the value was constant for the remainder of the experiment. Fade-in began immediately after the orientation. The inter onset intervals (IOIs) were 350 milliseconds, (a tempo chosen to encourage duple groupings; London, 2004), and each note's duration was 315 milliseconds. Participants were asked to tap the spacebar on which of the two pitches they heard as the stronger pulse. The test ended when the participant had tapped 21 times. Participants were given at least one test version of the experiment; their responses were only recorded once they indicated that they understood the instructions and were comfortable with the tasks.
Participants were each given 3 trials after a single practice trial, with parameters randomized between each trial and the tonally-orienting chord progression occurring before each; each participant's session took approximately 3 minutes. Preference for a pulse was defined as tapping on a pitch more than 14 times (or > 66% of taps). Given the literature surrounding tonal/metric hierarchies, we hypothesized that participants' preference for more-stable pitches would yield an 80% effect size: given that a relatively strong effect was hypothesized, we aimed to recruit between 25 and 30 participants, a sample size in which a strong effect would be visible. The null hypothesis was that stability had no effect on the participants' behavior, and the pulses on which they tapped would follow a 50/50 – a p(.5) – distribution: following a two-tailed binomial distribution, fewer than 10 or more than 19 positive responses would be sufficient to reject this hypothesis with greater than 95% confidence. Given that the hypothesized effect was 80%, testing 29 recruited participants gave a power of 89.1% against a null hypothesis of p ≤ .05.
Results
For analysis, all results were transposed to C. As shown in Figure 2, 16 participants (55.2%) preferred the less stable pitch, 13 (44.8%) the more stable (recalling that "stability" refers to the scale degrees' relative weighting in key profile vectors as described above), resulting in a difference of 10.34%. To ensure consistency in the data, each participant's number of more-stable taps was analyzed using a three-way ANOVA with gender, training, and scale-degree pair as between-participant factors; no interactions were found to be significant. The absolute-pitch response was discarded as a possible factor, as only two participants indicated having it.
A binomial test assuming the null hypothesis shows the experimental categories to be not significant. This indicates that the effect size (the difference of 10.34%) is not sufficiently large enough to discard the null hypothesis. It also bears noting that these results do not indicate that there is necessarily no effect. While these results are nowhere close to the 80% expected effect size, these observations could be the result of a smaller effect: if, for instance, if the observed effect of 44.8% is the true mean, 29 participants only yields a power of 9.3% against the null hypothesis – a larger sample size would be required to see such a smaller effect. This shows a potential venue for further investigation.
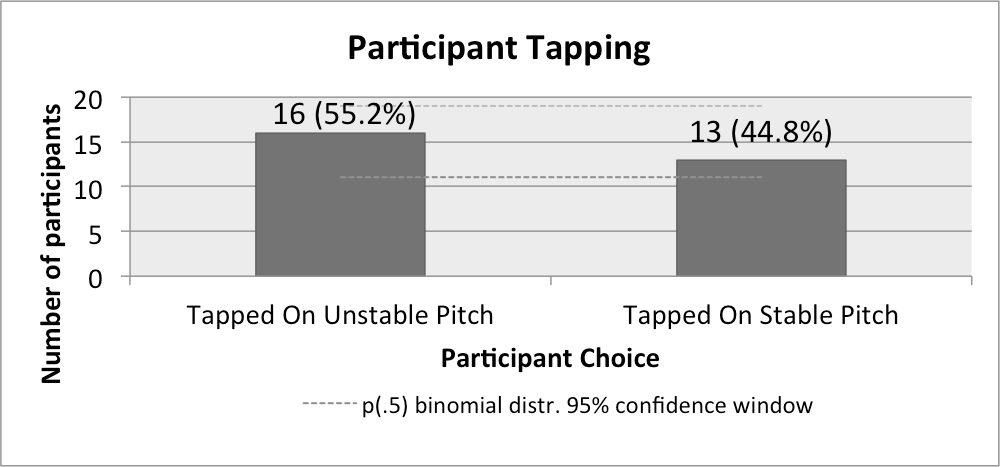
Fig. 2. Participants' preference for stable/unstable scale degrees
Discussion
The results indicate that pitch stability did not encourage participants to tap on consistent metric divisions. To investigate whether the other salient musical parameter – pitch height – influenced our results, Table 1 divides participant preference by the scale-degree pair they heard. While in each category there exists a preference for the higher note, these results are not significant (χ2 = .851; df = 3, p = .837). The pooled results (the total column) produce somewhat starker results – 24.2% more responses favored the higher pitch – however, this difference would not be sufficient to reject a null hypothesis (a p(.5) two-tailed binomial distribution = 0.132). While more statistical power would be required to reach a definitive conclusion, it should be noted that the observed preference conforms to the contour/accent models of Thomassen (1982) and Huron and Royal (1996).
| Solfege | Total Stable Taps | Total Unstable Taps | |||||
| Do-Re | Re-Mi | Fa-Sol | Sol-La | Total | |||
| Participants who tapped on higher degree | 5 | 2 | 2 | 2 | 11 (37.9%) | 13 (44.8%) | 16 (55.2%) |
| Participants who tapped on lower degree | 6 | 6 | 3 | 3 | 18 (62.1%) | ||
| Total | 11 | 8 | 5 | 5 | 29 (100%) | ||
While tonal hierarchies seemed to not encourage any consistent accent identification among participants, melodic schemata associated with tonal music may have overly influenced participants. It is possible, for instance, that listeners associated the whole steps with patterns of dissonance resolution (e.g., a 9-8 suspension over a tonic triad would place ^2 on the stronger pulse and ^1 on the weaker) and therefore encouraged listeners to hear certain patterns of metric accentuation. Because of the complex web of associations with tonal paradigms, Experiment 2 revises the previous design to recreate the effects of probability/stability in a non-tonal context, allowing us to exclude melodic and harmonic tonal associations from our design and focus solely on relative stability.
EXPERIMENT 2
Saffran et al (1999); Creel, Newport, and Aslin (2004); Loui, Wessel, and Kam (2006; 2010); and Loui (2012), have shown that participants can learn the norms of natural and synthesized grammars during relatively short exposure periods. The current study uses this insight to encourage the perception of stability in non-tonal contexts. In this design, participants are exposed to a probabilistically generated series of pitches designed to encourage them to hear one of the pitches as more stable than the others. As in the previous experiment, participants then perform a tapping task while hearing a melody that alternates between stable and unstable pitches. The exposure follows the overall format of Smith and Schmuckler (2004) and Rosenthal and Hannon (2016), work that tests whether listeners can distinguish a "tonic" from other non-tonic pitches after having heard that pitch far more often than others even if they heard a frequency distribution that does not strictly follow the standard tonal key profile. While these studies show that Western-acculturated listeners' feelings of stability were not manipulated as predictably when exposed to non-traditional (or non-tonal) pitch hierarchies as when they were exposed to the standard tonal pitch hierarchy, since the current study is only interested in simple distinctions between stable and unstable pitches, this same basic approach was adopted. To eschew associations with tonality, we chose a small set with no clear tonal orientation: a tritone. The tritone's symmetry also allows for the intervallic relationship between the stable and unstable pitches to be the same in all cases: if the higher or lower note is the more stable, in both cases the unstable pitch will be a tritone away. A simple unigram probabilistic model was created for the exposure session, in which one of the pitches was three times as likely to be generated as the other, reproducing the factor of difference between the values for diatonic and chromatic pitches in most key-profile vectors.
In order to ensure that this format of exposure was effective, a pilot study was run using a 5-minute exposure in which the participant heard one of the constituent pitches three times more frequently than the other. After exposure, the participants were asked "to sing tonic, Do, or the most stable pitch." This task approximated the participant's exposure effect in relation to a pitch hierarchy: it would test whether participants' feelings of stability would be affected by the exposure period. Of the 10 participants, each sang the more frequent pitch: our exposure format was deemed effective, but the same test of stability was preserved in the following experiment to ensure consistency.
Method
PARTICIPANTS
48 undergraduates and graduate students enrolled in music programs at UNCG participated in return for a variable cash sum. Median age was 20, and 28 participants identified as women, 19 as men, and 1 as genderqueer. Students who participated in the previous experiment were allowed to participate in this experiment. (Anecdotally, there seemed to be much overlap between participation in this, the previous, and subsequent studies; however, given that each participant was anonymized in our dataset, specifics concerning any participation overlap are not available. Note that, given the small number of genderqueer participants, it would be especially difficult to retain their anonymity in repeated tests.) Participants again indicated their years of musical training and whether they had absolute pitch.
MATERIALS AND PROCEDURE
The same hardware and software was used as in the previous experiment. To focus attention, the test was presented as a game of chance in which participants were told they would "have the chance to win between 1 and 3 dollars by identifying strong beats." Participants then received a baseline of $1, with 10 cents added for each keystroke on the more frequent pitch, receiving a maximum of $3, the details of which were explained to the participants in a debriefing after the test. Again, participants practiced the tasks at least once before engaging in the recorded test.
The test progressed in three parts: an exposure, an audiating task, and a forced-choice task. For the exposure, participants heard an algorithmically composed pitch sequence lasting five minutes, consisting only of the two notes of the tritone. To control for the possibility that height affected judgments, each participant heard one of two possible "height cases," with higher and lower pitches occurring more frequently in the exposure session, respectively. In each, one pitch had a threefold greater likelihood of being generated than the other. Transposition level was randomized with the program choosing the lower note between MIDI pitches 45 and 65, and the other pitch generated 6 semitones higher. IOIs were 450 m.s., each note had a duration of 200 ms, and MIDI velocity was set at 120. To avoid boredom, foster associations between the exposure and metrical accent, and to practice the forced-choice task, participants were given a "dummy task" – tapping the spacebar during the exposure to group the pitches they heard into metrical groupings, switching between groups of 2 and groups of 3 as they saw fit.
After five minutes, participants removed the headphones and the exposure melody continued to be played over the computer's speakers such that both participant and test administrator could hear it. Participants were then asked to sing the pitch that they heard as more stable of the two. A successful response was recorded if the participant sang or hummed the more frequent pitch; if any other pitch was sung or the response was inaudible, the response was recorded as unsuccessful.
For the forced-choice task, participants used the headphones to listen to a melody that oscillated between the two members of the tritone, fading in as in Experiment 1. They were instructed to tap the spacebar on the alternating note they heard as the stronger pulse. After 30 taps, the test ended. Each of the participant's taps was recorded, and a successful trial was defined as tapping 20 times ( > 66%) on one of the two pitches.
The increased number of participants reflects both a concern that the previous experiment's hypothesized effect may have been too high and that exposure to a non-tonal stimulus may produce less reliable participant responses. We therefore hypothesized that 2/3 (66.67%) of our participants would respond positively to the stimulus. Our null hypothesis again was represented by a p(.5) two-tailed binomial distribution; with 48 participants, 96% of the probability mass is accounted for between 17 and 31 responses, inclusive. Given the participation, the hypothesized effect size yields a power of 55.1%. Additionally, we believed that participants would be strongly drawn to associate the more frequent pitch with stability, and hypothesized an 80% effect positive response rate, yielding a power of 99% against a null hypothesis of p ≤.05.
Results
As shown in Figure 3, 22 participants (45.83%) tapped on the more frequent pitch, while 41 (87.5%) audibly identified the more frequent pitch as the more stable. The latter finding is sufficient to reject the null hypothesis (p<.001). The former finding falls within the null hypothesis's 95% confidence interval. A four-way ANOVA analyzing the amount of times participants tapped on the more stable beat with the between-participant factors of height case, gender, years of training, and whether they sang the more frequent pitch showed no significant interactions. Figure 3 additionally shows tapping responses under the different height cases. 30 participants (62.5%) tapped on the higher pitch of the tritone and the 18 (37.5%) tapped on the lower. While suggestive, this effect size is not strong enough to discount the null hypothesis with 95% confidence (p = .055).

Fig. 3. Number of participants who tapped on the more frequent pitch, who audiated the more frequent pitch, and who tapped on the higher pitch
Discussion
Again, this data shows no evidence that pitch frequency affected participants' responses; however, the responses again suggest that pitch height might exert some effect. Although this effect size is not strong enough to discount the null hypotheses, the 25% difference in pitch-height responses suggests that participants gravitate not toward the domain of stability, but to the domain of pitch height. (Recall that the experiment only had a power of 55.1% with a 66% effect size, which would naturally hold for a similarly subtle trend toward tapping on the higher pitch.) But, it is also possible that the leap still encouraged schematic associations: during the debriefing, several of the participants suggested that the melodic leap in the stimulus sounded "cadential," while others suggested that the tritone evoked associations with sirens, of which the higher pitch is usually louder. Additionally, while the exposure was shown to be sufficient for consciously identifying stability with the more frequent pitch, it may have not been sufficient to internalize that stability. Indeed, several of the exposure experiments cited above involve much longer periods of exposure. Experiment 3 was therefore designed to take into account these issues.
EXPERIMENT 3
Given the possibility that the exposure time of Experiment 2 was insufficient and that the stimulus might have tonal associations, Experiment 3 was designed in the same vein as Experiment 2, but with a different, fully symmetrical, non-tonal set and a longer exposure period.
Method
PARTICIPANTS
28 undergraduates from the UNCG's School of Music, Theater and Dance participated in return for $10. Median age was 20, with 16 men, 11 women, and 1 genderqueer participant. Hardware and software were the same as in Experiments 1 and 2, and again we did not exclude students if they had participated in the previous experiments.
MATERIALS AND PROCEDURE
The experiment progressed in three steps: practice, exposure, and the forced-choice task. A fully-diminished seventh chord (set class [0369]) was chosen as the underlying set since it is both maximally symmetrical and tonally ambiguous when appearing on its own. For each participant, a central pitch between MIDI pitches 45 and 65 was randomly chosen, and the fully-diminished seventh chord was generated by adding three minor thirds above that pitch. For instance, if MIDI pitch 60 (middle C) was chosen, the four pitches would be 60, 63, 66, and 69 (or C, D♯, F♯, and A). This chord is tonally ambiguous in that it could function as a leading-tone seventh chord (vii°7) in four different keys: in the spelling given above, the chord could be in the key of D♭/C♯, E, G, or B-flat.
To practice, the participants heard randomly generated pitches of a fully-diminished seventh and were given the practice task of tapping the spacebar on alternate pitches, entraining to the pulse using groups of two notes. This practice task occurred twice, once without headphones and once with the headphones on.
During the exposure, participants listened to a probabilistically-generated string of pitches from the underlying set. We divided the new larger set into two subsets: the pitches of one of the constituent tritones would have a probability three times greater than those of the other tritone. This allowed for two height cases, with either the pitches of the lower tritone (i.e., [C, D♯, F♯, A]) or higher (i.e., [C, D♯, F♯, A]) being generated more frequently. Following Loui (2012), participants listened to the stimulus for 30 minutes. They were instructed to be attentive, and to not fall asleep, use their phones, or do any other work. To mitigate boredom effects, participants were provided with coloring books, crayons, and colored pencils to use if they desired.
After the exposure session, participants heard an algorithmically generated series of pitches from the same fully-diminished seventh set, now alternating between pitches of the subsets heard more and less frequently in the exposure, randomly choosing one of the notes from each subset. (Using our C-based set, the series would alternate between [C or F♯] and [E♭ or A].) Again, to control for bias toward the initiating pitch, the subset heard first was randomized, and the series faded in as in earlier experiments. The participants were instructed to choose which alternating pulse they heard as the stronger pulse, and to tap the spacebar on that stronger pulse. (Our choice of having two frequent and two infrequent pitches was informed by this task: were participants to hear a single more frequent pitch, each alternating pulse in the forced-choice task would have returned to that single pitch. Participants could have then identifies the same-different-same-different melodic contour, obscuring our findings' relationship to our experimental question.) After 30 taps, the test ended and results were recorded. Again, a successful trial was defined as 20 or more taps on one of the pulses (> 66%).
We hypothesized two potential distributions: a strong distribution resulting from exposure (80% expected positive response) and a weaker effect (66.67% expected positive response). The null hypothesis, a 50% distribution, would have a 97.2% confidence interval between 8 and 20 positive responses. This results in a power of 94.6% given a hypothesized 80% distribution, and a power of 41.7% given a hypothesized 66.67% distribution.
Results
Table 2 shows the number of participants who tapped on the pitches more frequently heard in the exposure session and the number of participants who tapped on the higher pitch: 15 (53.5%) tapped on the more frequently-heard pitch, and 13 (46.4%) tapped on the less frequent one; 16 (57.1%) tapped on the higher set and 12 (42.9%) tapped on the lower set. None of these effect sizes were sufficient to reject the null hypothesis. Again, we see a slightly larger effect of pitch height than of frequency-heard; however the difference in effect size (53.5% versus 57.1%) is quite small. However, the divisions in Table 2 are significant when analyzed using a chi-square test, returning a relatively high effect size (χ2(1, N = 28) = 3.8769, p =.049, Cramer's V = .372). This significance likely arises from participants preferring to choose the higher subset when it was less frequent.
| On which pitch did the participant tap? | |||
| More frequent | Less frequent | Total | |
| Which pitch did the participant hear more frequently? | |||
| High | 6 (21.4%) | 10 (35.7%) | 16 (57.1%) |
| Low | 9 (32.1%) | 3 (10.7%) | 12 (42.9%) |
| Total | 15 (53.5%) | 13 (46.4%) | 28 (100%) |
Discussion
Overall, the previous three experiments have found no evidence that pitch stability (or frequency of occurrence) effects participants' tapping. If anything, pitch height seems to provide a more salient parameter for tapping responses; however, tests with greater power would need to be undertaken to show this more definitively. Additionally, pairs with starker contrasts (for instance, using chromatic pitches) within a tonal hierarchy could produce different results. However, these results show that the tested relationships within the tonal/stability hierarchies did not encourage a feeling of metric accent in these monophonic situations with the expected strong sizes. Nevertheless, our experimental designs offer the opportunity to begin investigating whether this interaction might hold in the opposite direction, with metrical hierarchies encouraging tonal hierarchies. The following experiment re-designs Experiment 1 to investigate whether listeners are encouraged into certain tonal orientations by certain metrical hierarchies.
EXPERIMENT 4
The following experiment manipulates the design of Experiment 1, but now testing whether participants use metric information to orient themselves in an ambiguous tonal context. Although some previous work investigating the relationship between tonal orientation and metric hierarchy has used probe tones or timed reaction tasks (Prince et al, 2009), others have employed the more complex decision-making task of matching a stimulus with an accompaniment (Hannon et al, 2004). We adopt the latter approach, with participants matching a metrically-determined musical stimulus with a tonally-orienting harmonization: a dominant seventh.
Method
PARTICIPANTS
33 undergraduates from the University of North Carolina at Greensboro's School of Music, Theater and Dance participated in return for a snack of their choice. The median age was 21, and the group included 22 men, 9 women, and 2 genderqueer individuals, allowing for participation overlap with previous experiments. The same hardware and software were used as in previous experiments.
MATERIALS AND PROCEDURE
The stimulus was based on that of Experiment 1: an oscillating whole step, the lowest pitch of which was randomly generated between MIDI pitches 45 and 65. Both notes had IOIs and durations identical to Experiment 1. Two emphasis cases were introduced to induce a feeling of metric accent. Based on the above-cited work on objective rhythmicization, we differentiated the two pitches with velocities of a factor of 10, with one pitch set at MIDI velocity value 50 and the other at 500. The harmonization choices were based on the chords used to provide tonal contexts in Experiment 1, with each constituent note's velocity set at 100 but now with a duration of 900 m.s., ensuring that the sound would sustain over several repetitions of the oscillating pattern. Figure 4 schematizes the potential harmonizations available to the participants, transposed to C. In their non-transposed form (i.e., in relation to a C-D oscillating whole step), the harmonizing chords were G7, F7, and B-flat7. Each dominant seventh exists in only one key: that is, even though no tonic chord is sounded, the tonally-determinate nature of these dominant sevenths will suggest a tonal orientation. Here, the tonal orientations would be C (choice 1), B-flat (choice 2) and E-flat (choice 3), therefore harmonizing C-D as scale degrees ^1-2 (choice 1), ^2-3 (choice 2), or ^6-7 (choice 3). These three choices allowed us to control for the placement of the tonally stable pitch within the whole-step, with ^1 and ^3 being more stable than ^2, and with ^6 and ^7 similar within key profiles.
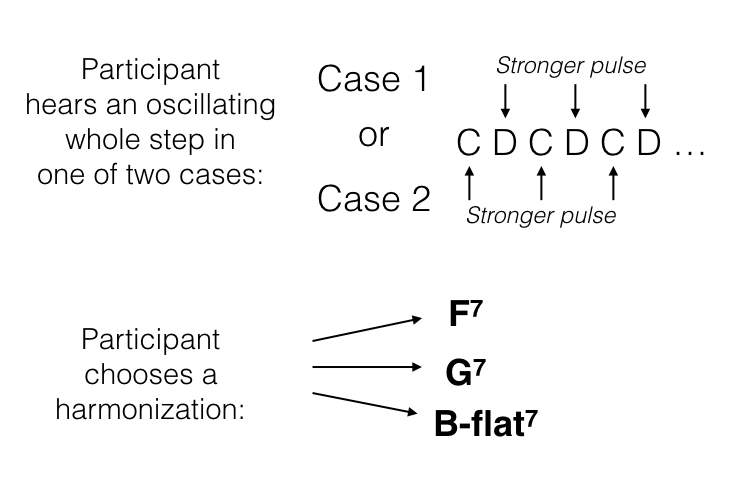
Fig. 4. The oscillating whole step heard by participants, and their harmonization choices, transposed to C
A potential confounding factor would be the participants' preference to align the louder pitch with the chord tones, a factor taken into account in the ensuing analyses. It was due to this concern that we did not include the other two whole-steps of the major scale, ^4-5 and ^5-6, since their harmonizations (in relation to a C-D whole step, C7 and D7, respectively) both placed one member of the dyad as the chord's root. We also voiced the dominant-seventh chords such that neither pitch of the sounding dyad would appear in the chord if at all possible: to this end, the G7 and F7 omitted the chordal fifths. Two major triads were used as the harmonization choices for the practice and intermediary tasks, one whose lowest pitch was the lower of the melody, one whose lowest pitch was the higher of the melody (C major and D major triads in relation to a C-D whole step).
Each participant engaged in 3 harmonization trials, with all triads preceded by a practice/intermediary task. Between all trials and practice/intermediary tasks, the oscillating whole step and harmonizing chords changed to a different (random) transposition. The practice/intermediary tasks asked participants to choose the triad that "better fits the pattern." By pressing the "1" and "2" keys, participants heard the lower and higher major triads, respectively. After hearing them as many times as they liked, a choice was made by pressing SHIFT-1 or SHIFT-2. The three harmonization trials progressed likewise. Upon hearing the whole step melody, participants tried different harmonizations by pressing the "3", "4", and "5" keys, making their choice by combining that number with the SHIFT key.
The emphasis cases were presented in two possible orders over the three trials (randomly assigned between participants). In the first ordering, trial 1 emphasized the lower pitch and trials 2-3 emphasized the higher; in the second ordering, the emphases were switched such that trial 1 emphasized the higher pitch, and 2-3 emphasized the lower. In both orderings, the emphasis case changed between trials 1 and 2 but not between 2 and 3, allowing us to analyze whether a change in emphasis affected participant response. We hypothesized that participants would gravitate toward harmonizations in which the emphasized note was more consonant, such that G7 and B-flat 7 would be chosen more frequently when D was emphasized and F7 would be chosen more frequently when C was emphasized, with a hypothesized effect of 80%. The null hypothesis was that the emphasized note would not effect which choice was made by participants such that the two possible emphases within each harmonization choice could be accounted for by a 50% binomial distribution. (Given that the number of emphasis cases would be randomly generated and harmonizations would be chosen by the participants, confidence intervals would be calculated during the analysis stage.) Since our experimental and null hypotheses involve categorical responses (the choice between three harmonizations) to categorical variables (emphasized note), a chi-square test was used, and Cramer's V was used to quantify the resulting effect size.
Results
For analysis, all results were transposed to conform to a C-D oscillating melody (with F7, G7, and B-flat7 as the harmonization choices). The number of times participants tapped on each seventh chord was analyzed using a three-way MANOVA with emphasis case, gender, and training as between-participant factors. We found no significant interactions. However, in a one-way MANOVA, the number of times each seventh was chosen differed significantly as a function of emphasis case for G7 (F(1, 31) = 4.57, p = .04) and F7 (F(1, 31) = 4.62, p = .04). (Note that these results are somewhat suspect, since the harmonization choices are not entirely independent, as addressed below.) In order to further investigate the role accent might play in these results, Table 3 shows the number of times participants chose each harmonization in both cases. Harmonizations significantly change with emphasis case and exhibit a reasonable effect size, (χ2(2, N=99) = 9.684, p = .008, Cramer's V = .313).
| Trial Number | Louder pitch | ||||
| C | D | Total | |||
| First Trial | Chord Chosen | B-flat7 | 6 | 11 | 17 |
| F7 | 6 | 1 | 7 | ||
| G7 | 4 | 5 | 9 | ||
| Total | 16 | 17 | 33 | ||
| Second Trial | Chord Chosen | B-flat7 | 8 | 4 | 12 |
| F7 | 5 | 2 | 7 | ||
| G7 | 4 | 10 | 14 | ||
| Total | 17 | 16 | 33 | ||
| Third Trial | Chord Chosen | B-flat7 | 8 | 8 | 16 |
| F7 | 6 | 2 | 8 | ||
| G7 | 3 | 6 | 9 | ||
| Total | 17 | 16 | 33 | ||
| Total for all trials | Chord Chosen | B-flat7 | 22 | 23 | 45 |
| F7 | 17 | 5 | 22 | ||
| G7 | 11 | 21 | 32 | ||
| Total | 50 | 49 | 99 | ||
As evident in the table and the MANOVA testing, this effect of emphasis appears to be due to participants' preference for F7 when C is emphasized, and for G7 when D is emphasized. Since each observation was not independent (an individual participant could show a consistent preference for a particular harmonization, for instance), a binomial mixed effects model was also run on data categorizing harmonization choice by the participant producing the response. Controlling for these individual preferences, the model still found that when D was louder, participants chose G7 more frequently (p = .028) and when C was louder, they chose F7 more frequently (p = .007); no effect of loudness was found for B-flat7 harmonizations (p = .77).
Given that B-flat7 was the most frequent choice overall but was not predicted by emphasis, we investigated whether other factors affected participants' selections. Table 4 divides participants harmonizations for Trials 2 and 3 based on whether their choice represents a change from their previous harmonization. The categories are significant (χ2(1, N = 66) = 4.190, p = .041) although the effect is relatively small (Cramer's V = .252). Recalling that the two orders change emphasis case between the first and second trial but not between the second and third, it seems that a change in emphasis case results in a change of harmonization. (The tonal context of the previous trial would not provide an explanation for these results, as the transpositional level of each trial was randomized.) While a preference for aligning chord tones with emphasized pitches explains these findings in relation to F7 and G7, that tendency would not explain retaining or changing B-flat7 harmonizations. We therefore investigated the choices made by participants before and after they chose B-flat7.
| Compared to previous choice of harmonization | ||||
| Changed harmonization | Did not change harmonization | Total | ||
| Trial Number | Second | 25 | 8 | 33 |
| Third | 17 | 16 | 33 | |
| Total | 42 | 24 | 66 | |
Table 5 shows the 45 times participants chose the B-flat7 harmonization in relation to their next and previous choices, and in relation to the trial number. Of those who chose B-flat7 on their first choice, only 17.64% chose B-flat7 for their 2nd choice. Of those who chose B-flat7 on their second choice, 58.33% retained that choice in the final trial. We might hypothesize that the choices made by participants after choosing B-flat7 would be predicted by emphasis case, just as in the pooled results of Table 3. However, they are not: as shown in Table 6, if we categorize the 29 choices made by participants after choosing B-flat7 by emphasis case, the divisions are not significant (χ2 (2, N = 29) = 2.632, p = .268) although the effect size is reasonable (Cramer's V=.301). Alternatively, dividing these results by trial number produces more compelling results. As seen in Table 7, dividing the 29 choices that followed a selection of B-flat7 by trial number restores some of the significance of these divisions (χ2(2, N = 29) = 5.816, p = .055) and increases the effect size (Cramer's V = .448).3
| Next Choice | Total | |||||
| Trial Number | Previous Choice | B-flat7 | F7 | G7 | N/A | |
| One | N/A | 3 | 6 | 8 | 17 | |
| Two | B-flat7 | 1 | 0 | 2 | 3 | |
| F7 | 3 | 0 | 1 | 4 | ||
| G7 | 3 | 1 | 1 | 5 | ||
| Total | 7 | 1 | 4 | 12 | ||
| Three | B-flat7 | 7 | 7 | |||
| F7 | 1 | 1 | ||||
| G7 | 8 | 8 | ||||
| Total | 16 | 16 | ||||
| All | B-flat7 | 1 | 0 | 2 | 7 | 10 |
| F7 | 3 | 0 | 1 | 1 | 5 | |
| G7 | 3 | 1 | 1 | 8 | 13 | |
| N/A | 3 | 6 | 8 | 0 | 17 | |
| Total | 10 | 7 | 12 | 16 | 45 | |
| Emphasized Note | ||||
| C | D | Total | ||
| Choice | B-flat7 | 7 | 3 | 10 |
| F7 | 6 | 1 | 7 | |
| G7 | 6 | 6 | 12 | |
| Total | 17 | 12 | 29 | |
| Trial Number | ||||
| Second | Third | Total | ||
| Choice | B-flat7 | 3 | 7 | 10 |
| F7 | 6 | 1 | 7 | |
| G7 | 8 | 4 | 12 | |
| Total | 17 | 12 | 29 | |
Discussion
Since significant results arise not only from divisions by emphasis case but also potentially by trial number, it seems that changes in metric divisions do seem to encourage changes in preferred harmonizations. In other words, participants' decisions change when emphasis changes, even when their chord choice does not align chord tones with emphasized pitches. While particular choices made during the harmonization task are not always determined by the emphasized note, changes in preferences are significantly affected by changes in emphasis.
It bears further discussion as to why B-flat7 responses might differ from F7 and G7. One account for this finding is that the scale-degree interpretations of the D-C dyad produced by the F7 and G7 harmonizations (^3-2 and ^2-1, respectively) are familiar neighboring dissonances, while that imposed by the B-flat7 (^7-6) is a less probable progression.4 The responses to F7 and G7 may therefore not be the result of a preference for emphasized chord tones per se, but rather of the interaction between well-known dissonance treatments and meter. Alternatively, while D is the third of a B-flat dominant seventh, C would be the chordal ninth. Given that dominant ninths are far from unusual in tonal repertoires, participants may have been hearing both pitches as chord tones. Furthermore, when listening to the series of choices, B-flat7 might have been heard as the resolution of the F7 choice: as listeners scroll through the potential harmonization, B-flat7 may have been the more satisfying choice not because of the emphasis in the stimuli per se, but because it is the final chord of satisfying the "falling fifth" chord progression embedded within the range of choices.
Regardless of the reasons behind participants' preference for B-flat7, the overall data suggest connections between metrical hierarchies and preferences for tonally-orienting harmonizations. As we hypothesized, participants prefer to align accented pitches with chords tones of the harmonizing dominant sevenths.5 However, when participants did not use chord-tone participation to make their choice – as was the case when they chose B-flat7 – their choices were influenced by changes in metric emphasis: when the emphasized pitch changed between the first and second trials, participants changed tonal orientation with a reasonable effect. Within this subset of responses, the emphasized notes do not point toward a determinate tonal context, but rather illustrate that changing emphasis is correlated to a change in harmonization.
Importantly, even if only the preference for metrically strong chord tones were true, these findings would still indicate that metrical hierarchies can affect tonal hierarchies. In this case, emphasized notes encourage listeners to prefer certain harmonizations, and these harmonizations point toward tonal contexts. While not directly causal, the process still results in meter affecting tonal determinacy. However, some of our results sidestep this intermediary step with emphasized notes seeming to directly influence a listener's preference toward particular tonal contexts.
GENERAL DISCUSSION
In Experiment 1, we saw that participants' identification of a metrically-accented pulse (as measured by a tapping task) was not influenced by tonal stability when they heard a repetitive monophonic stream in some key. Experiments 2 and 3 attempted to synthesize a feeling of pitch stability by exposing participants to atonal sets in which a subset of the pitches occurs more frequently than the set's complement, and testing whether this exposure influenced how participants grouped the pulses into strong and weak beats. While participants indicated that exposure did influence their perception of pitch stability, exposure did not influence their identification of metrical emphases. Finally, Experiment 4 reorganized the format of Experiment 1, presenting participants with a metrically defined but tonally-ambiguous melody in order to determine whether participants preferred to harmonize the melody with different tonally-orienting chords depending on the metric context. Here, participants did choose certain harmonies in certain metrical contexts; while some of the effect could be attributed to an overall preference for aligning strong beats with chord tones, further analysis showed that a change of metrical context might have influenced changes in chord preference.
Two important points can be drawn from these findings: in the context of these experiments, we found no evidence showing that tonal hierarchies help determine ambiguous metrical hierarchies; but, we did find evidence that metrical hierarchies might influence a listener's preferred tonal hierarchies. Metrical hierarchies seem to be able to influence the production of tonal orientation, with the inverse not appearing to hold true in these constrained monophonic contexts.
Of course, this is not to say that pitch and harmony have no influence on meter. Phenomena like pitch height, changes in harmony, and melodic/harmonic schema are not addressed in this work, and almost certainly contribute to metrical interpretation (as seen, for instance, in Hannon et al, 2004). Furthermore, our investigation specifically examined ambiguous contexts and the initial formation of cognitive hierarchies; metric and tonal hierarchies almost certainly interact in rich and complicated ways when both are determined. Additionally, while monophonic stimuli allowed us to rely on the extensive literature concerning the relationships between individual scale degrees, it is certainly possible that the hierarchies associated with chords and harmonic functions might have a significant effect on meter identification. Indeed, more work needs to be done to investigate the role that harmonic rhythm, voice-leading, tonal schema, chord function, and other more complex tonal structures might have on metric identification.
The context of these experiments may also have been too simple to encourage sufficiently complex metric and tonal hierarchies such that the two domains interact. It might be the case that metric and pitch-stability hierarchies only interact when the complex associations of tonality are evoked, and the simple stable/unstable dichotomy presented in Experiments 2 and 3 may have not been sufficient to engage such interaction. Our approach to identifying metrical accents was also very simple. Throughout the experiments, we only tested duple strong/weak patterns and encouraged no nested hierarchical relationships. Furthermore, Experiment 4 encouraged strong-beat identification only via volume accents. Future investigations might increase the richness of the metrical hierarchies both with higher orders of nested relationships and with other types of accents. Additionally, the results of our last experiment could be attributed not to a cognized metric hierarchy, but to the accent pattern within the stimulus: further work might continue this line of inquiry by encouraging accent identification through a different task such as asking the participant to conduct or to observe metric notation.
Nevertheless, this work does contribute to ongoing investigations concerning the interaction of metric and tonal hierarchies. While our negative results do not comprise a full-fledged argument against meter as a strong player in tonal orientation, they do indicate that, given a tonally-indeterminate monophonic context, listeners can use meter – or at least emphasis patterns – to make tonal decisions, and that listeners seem to not use key to make metric determinations.
ACKNOWLEDGEMENTS
The author would like to thank Ian Quinn for his insightful input into earlier versions of this article. I would also like to thank the UNCG Institutional Review Board and the UMass Statistical Consulting and Collaboration Services for their invaluable insight into the interpretation of this data, as well as my lab assistants on this project, Joe Barker and Daniel Wolf.
NOTES
- Correspondence can be addressed to: Dr. Christopher White, University of Massachusetts Amherst, 273 Fine Arts Center East, 151 Presidents Dr., Amherst, MA 01003-9330, or at cwmwhite@umass.edu.
Return to Text - Metrical Preference Rule 9 states, "Prefer a metrical analysis that minimizes conflict with the [harmonic] time-span reduction" (p. 90), and Time Span Reduction Preference Rule 1 states, "Of the possible choices for head of a time-span T, prefer a choice that is in a relatively strong metrical position" (p. 160).
Return to Text - Similarly, of the 33 participants, only 1 chose B-flat7 three times in a row, a phenomenon that may have some significance given a p(.091 [or, .4545^3]) binomial distribution, p = .14.
Return to Text - For instance, in the Yale-Classical Archives Corpus (White, 2013b; ycac.yale.edu), the ordered series of prime-form set classes resulting from a ^7-6-7 melody over a dominant seventh is 55% less likely than that resulting from ^5-6-5, and 72% less likely than ^3-2-3. While this representation does not take inversion or melodic content into account, it nevertheless conforms to this musical intuition.
Return to Text - Incidentally, this finding was reproduced in the intermediary and practice triad harmonizations as well. Participants chose the triads whose root was the emphasized pitch, with case significantly affecting triad choice (χ2 = (1, N = 99) = 9.537, p = .002).
Return to Text
REFERENCES
- Aarden, B. J. (2003). Dynamic Melodic Expectancy. Ph.D. Dissertation, The Ohio State University.
- Abe, J. I., & Okada, A. (2004). Integration of metrical and tonal organization in melody perception. Japanese Psychological Research, 46, 298–307. https://doi.org/10.1111/j.1468-5584.2004.00262.x
- Abecasis, D. Brochard, R., Granot, R., & Drake, C. (2005). "Differential Brain Responses to Metrical Accents in Isochronous Auditory Sequences." Music Perception, 22 (3), 549–562. https://doi.org/10.1525/mp.2005.22.3.549
- Acevedo, S., Temperley, D., & Pfordresher, P.Q. (2014). Effects of Metrical Encoding on Melody Recognition. Music Perception, 31(4), 372–386. https://doi.org/10.1525/mp.2014.31.4.372
- Bello, J., Daudet, L., Abhallah, S., Duxbury, C., Davies, M., & Sander, M. (2005). A tutorial on onset detection in music signals. IEEE Transactions on Speech and Audio Processing, 13, 1035–1047. https://doi.org/10.1109/TSA.2005.851998
- Boltz, M. G. (1991). Some structural determinants of melody recall. Memory and Cognition, 19, 239–251. https://doi.org/10.3758/BF03211148
- Boone, G.M. (2000). Marking Mensural Time. Music Theory Spectrum, 22(1), 1–43. https://doi.org/10.2307/745851
- Brochard, R., Abecasis, D., Potter, D., Ragot, R., & Drake, C. (2003). The "ticktock" of our internal clock: Direct brain evidence of participantive accents in isochronous sequences. Psychological Science, 14, 362–366. https://doi.org/10.1111/1467-9280.24441
- Cooper, G. & Meyer, L. (1960). The Rhythmic Structure of Music. Chicago: The University of Chicago Press.
- Creel, S. C., Newport, E. L., & Aslin, R. N. (2004). "Distant melodies: Statistical learning of nonadjacent dependencies in tone sequences." Journal of Experimental Psychology: Learning, Memory, and Cognition, 30, 1119 –1130. https://doi.org/10.1037/0278-7393.30.5.1119
- Creel, S.C. (2011). Specific previous experience affects perception of harmony and meter. Journal of Experimental Psychology: Human Perception and Performance, 37, 1512-1526. https://doi.org/10.1037/a0023507
- Cuddy, L. L., & Badertscher, B. (1987). Recovery of the tonal hierarchy— Some comparisons across age and levels of musical experience. Perception and Psychophysics, 41, 609–620. https://doi.org/10.3758/BF03210493
- Desain, P., & Honing, H. (2003). The formation of rhythmic categories and metric priming. Perception, 32, 341–365. https://doi.org/10.1068/p3370
- Dibben, N. (1994). The Cognitive Reality of Hierarchic Structure in Tonal and Atonal Music. Music Perception, 12(1), 1–25. https://doi.org/10.2307/40285753
- Drake, C. W., Dowling, W.J., & Palmer, C. (1991). Accent structures in the reproduction of simple tunes by children and adult pianists. Music Perception, 8, 315-334. https://doi.org/10.2307/40285505
- Ellis, R. J., & Jones, M. R. (2009). The role of accent salience and joint accent structure in meter perception. Journal of Experimental Psychology: Human Perception and Performance, 35, 264–280. https://doi.org/10.1037/a0013482
- Fraisse, P. (1946). Contribution à l'étude du rhythme en tant que forme temporelle. Journal de Psychologie Normale et Pathologique, 39, 283–304.
- Gouyon, F., Widmer, G., Serra X., & Flexer, A. (2006). Acoustic cues to beat induction: a machine learning perspective. Music Perception, 24(2), 177-188. https://doi.org/10.1525/mp.2006.24.2.177
- Hannon, E.E., Snyder, J.S., Eerolna,T., & Krumhansl, C.L. (2004). The role of melodic and temporal cues in perceiving musical meter. Journal of Experimental Psychology: Human Perception and Performance, 30, 956-974. https://doi.org/10.1037/0096-1523.30.5.956
- Huron, D. & Royal, M. (1996). What is Melodic Accent? Converging Evidence from Musical Practice. Music Perception, 13, 489-516. https://doi.org/10.2307/40285700
- Huron, D. (2006). Sweet Anticipation: Music and the Psychology of Expectation. Cambridge, MA: The MIT Press.
- Jones, M. R., Johnston, H. M., & Puente, J. (2006). Effects of auditory pattern structure on anticipatory and reactive attending. Cognitive Psychology, 53, 59–96. https://doi.org/10.1016/j.cogpsych.2006.01.003
- Krumhansl, C. L. (1990). Cognitive foundations of musical pitch. New York: Oxford University Press.
- Krumhansl, C. L. (1991). Memory for musical surface. Memory and Cognition, 19, 401–411. https://doi.org/10.3758/BF03197145
- Krumhansl, C. L., & Kessler, E. J. (1982). Tracing the dynamic changes in perceived tonal organization in a spatial representation of musical keys. Psychological Review, 89, 334–368. https://doi.org/10.1037/0033-295X.89.4.334
- Larson, S. (1997). The Problem of Prolongation in 'Tonal' Music: Terminology, Perception, and Expressive Meaning. Journal of Music Theory, 41(1), 101–136. https://doi.org/10.2307/843763
- Lerdahl, F., & Jackendoff, R. (1983). A Generative Theory of Tonal Music. Cambridge, MA: The MIT Press.
- London, J. (2004). Hearing in time: Psychological aspects of musical meter. New York: Oxford University Press. https://doi.org/10.1093/acprof:oso/9780195160819.001.0001
- Loui, P., Wessel, D., & Kam, C. H. (2006). Acquiring New Musical Grammars – a Statistical Learning Approach. Proceedings of the 28th Annual Conference of the Cognitive Science Society, 1711-1716.
- Loui, P., Wessel, D. L., & Hudson Kam, C. L. (2010). Humans Rapidly Learn Grammatical Structure in a New Musical Scale. Music Perception, 27(5), 377-388. https://doi.org/10.1525/mp.2010.27.5.377
- Loui, P. (2012). Learning and liking of melody and harmony: Further studies in artificial grammar learning. Topics in Cognitive Science, 4, 1–14. https://doi.org/10.1111/j.1756-8765.2012.01208.x
- Makris, I., & Mullet, E. (2003). Judging the pleasantness of contour–rhythm–pitch–timbre musical combinations. American Journal of Psychology, 116, 581–611. https://doi.org/10.2307/1423661
- Monahan, C., Kendall, R., & Carterette, E. (1987). The effect of melodic and temporal contour on recognition memory for pitch change. Perception and Psychophysics, 41, 576–600. https://doi.org/10.3758/BF03210491
- Palmer, C., & Krumhansl, C. L. (1990). Mental representations for musical meter. Journal of Experimental Psychology: Human Perception and Performance, 16, 728–741. https://doi.org/10.1037/0096-1523.16.4.728
- Parncutt, R. (1994). A perceptual model of pulse salience and metrical accent in musical rhythms. Music Perception, 11, 409-464. https://doi.org/10.2307/40285633
- Pfordresher, P. Q. (2003). The role of melodic and rhythmic accents in musical structure. Music Perception, 20, 431–464. https://doi.org/10.1525/mp.2003.20.4.431
- Prince, J.B. and Schmuckler, M.A. (2014). Music Perception, 31(3), 254–270. https://doi.org/10.1525/mp.2014.31.3.254
- Prince, J.B., Thompson, W. F., & Schmuckler, M.A. (2009). Pitch and Time, Tonality and Meter: How Do Musical Dimensions Combine? Journal of Experimental Psychology, 35(5), 1598–1617. https://doi.org/10.1037/a0016456
- Repp, B.H. (2005). Sensorimotor synchronization: A review of the tapping literature. Psychonomic Bulletin & Review, 12(6), 969–992. https://doi.org/10.3758/BF03206433
- Repp, B. H. (2007). Hearing a melody in different ways: Multistability of metrical interpretation, reflected in rate limits of sensorimotor synchronization. Cognition, 102(3), 434–54. https://doi.org/10.1016/j.cognition.2006.02.003
- Repp, B.H., Iversen, J.R., & Patel, A.D. (2008). Tracking an imposed beat within a metrical grid. Music Perception, 26, 1–18. https://doi.org/10.1525/mp.2008.26.1.1
- Rosenthal, M. & Hannon, E. (2016). Cues to Perceiving Tonal Stability in Music: The Role of Temporal Structure. Music Perception, 33(5), 601–612. https://doi.org/10.1525/mp.2016.33.5.601
- Saffran. J.R, Johnson, E. K., Aslin, R. N., & Newport, E. L. (1999). "Statistical learning of tone sequences by human infants and adults," Cognition, 70: pp. 27–52. https://doi.org/10.1016/S0010-0277(98)00075-4
- Schellenberg, E. G., Krysciak, A. M., & Campbell, R. J. (2000). Perceiving emotion in melody: Interactive effects of pitch and rhythm. Music Perception, 18, 155–171. https://doi.org/10.2307/40285907
- Schmuckler, M. A. (1989). Expectation in music—Investigation of melodic and harmonic processes. Music Perception, 7, 109–150. https://doi.org/10.2307/40285454
- Szelag, E., Kowalska, J., Rymarczyk, K., & Pöppel, E. (1998). Temporal integration in a participantive accentuation task as a function of child cognitive development. Neuroscience Letters, 27(257.2), 69–72. https://doi.org/10.1016/S0304-3940(98)00809-X
- Smith, N. A., & Schmuckler, M. A. (2004). The perception of tonal structure through the differentiation and organization of pitches. Journal of Experimental Psychology: Human Perception and Performance, 30, 268–286. https://doi.org/10.1037/0096-1523.30.2.268
- Squire, C. R. (1901). Genetic study of rhythm. American Journal of Psychology, 12, 546–560. https://doi.org/10.2307/1412147
- Temperley, D. (2007). Music and Probability. Cambridge: The MIT Press.
- Temperley, D. (2010). Modeling Common-Practice Rhythm. Music Perception, 27(5), 355–376. https://doi.org/10.1525/mp.2010.27.5.355
- Thompson, W. F. (1994). Sensitivity to combinations of musical parameters: Pitch with duration, and pitch pattern with durational pattern. Perception and Psychophysics, 56, 363–374. https://doi.org/10.3758/BF03209770
- Toiviainen, P., & Snyder J. S. (2003). Tapping to Bach: Resonance-Based Modeling of Pulse. Music Perception, 21(1), 43–80. https://doi.org/10.1525/mp.2003.21.1.43
- Thomassen, J. (1982). Melodic accent: Experiments and a tentative model. Journal of the Acoustical Society of America, 71, 1596-1605. https://doi.org/10.1121/1.387814
- Thomassen, T. (1983). Erratum. Journal of the Acoustical Society of America, 73, 373. https://doi.org/10.1121/1.389590
- Vazan P., & Schober, M. F. (2000). The 'Garden Path' Phenomenon in the Perception of Meter. Paper read at the Annual Meeting of the Society for Music Perception and Cognition, Toronto, November 3.
- White, C. (2013a) An alphabet reduction algorithm for chordal N-grams. In: Yust, J., Wild, J. (eds.) Mathematics and Computation in Music, LNCS, vol. 7937, Springer, Heidelberg. https://doi.org/10.1007/978-3-642-39357-0_16
- White, C. (2013b) Some Statistical Properties of Tonality, 1650-1900. Ph.D. Dissertation, Yale University.
- White, C. (2014) Changing styles, changing corpora, changing tonal models. Music Perception, 31(2), 244–253. https://doi.org/10.1525/mp.2014.31.3.244
- White, C. (2015). A Corpus-Sensitive Algorithm for Automated Tonal Analysis. In: Tom Collins, T., Meredith,D. Volk, A (eds.), Mathematics and Computation in Music. LNAI, vol. 9110. Springer, Heidelberg. 115–121. https://doi.org/10.1007/978-3-319-20603-5_11
- Woodrow, H. (1909). A quantitative study of rhythm. Archives of Psychology, 18, 1–66.
- Woodrow, H. (1911). The role of pitch in rhythm. Psychological Review, 18, 54–77. https://doi.org/10.1037/h0075201
- Zikanov, K. (2014). Metric Properties of Mensural Music: An Autocorrelation Approach. National Meeting of the American Musicological Society, Milwaukee.
- Zicarelli, D. (1998). An extensible real-time signal processing environment for Max. Paper presented at the Proceedings of the International Computer Music Conference, University of Michigan, Ann Arbor, MI.
