
WHAT is rock? Is it a genre? A style? A conglomeration of genres and subgenres, styles and substyles? Is it a single entity at all? Or is it such a diffuse and subjective category that study of its underlying structure is doomed to failure?
Recent empirical studies of rock (or pop/rock) harmony have touched upon these questions. Referring to their study of a sample of songs from Rolling Stone magazine's "500 Greatest Songs of All Times," DeClercq and Temperley (2011) write: "'rock' proves to be a problematic term. … It might be argued that what our corpus represents is not a single unified style, but perhaps several styles, each of which may have a more consistent harmonic logic than is reflected by the data we have presented above (this brings to mind Everett's six 'tonal systems')" (pp. 50–51). Similarly, John Ashley Burgoyne concludes his (2011) dissertation by analyzing a sample of songs from the Billboard Hot 100, reiterating the point that "most proportions derived from data are 'over-dispersed'" (p. 188), with the harmonic structure of the McGill Billboard corpus being no exception. By "over-dispersed", Burgoyne means that the harmonic structures of individual songs are noticeably different from the average structures of the corpus. This song-by-song uniqueness is not surprising, given the creativity of songwriters, but it problematizes the use of corpus-wide averages as representative measures of the pop/rock corpus, let alone the greater population of which the corpus is a sample.
The problematic nature of the terms "rock," "pop," and "pop/rock" likely emerges for numerous reasons. First, these terms are applied to very large repertoires of music by musicians and listeners alike. Hendrik Schreiber (2015) investigated user-generated genre tags in online music services and found that "pop/rock" was applied to as much as 60% of recent popular songs; when separated into finer grained categories, "pop" was applied to roughly 7%, "rock" to 39%, and the rock-related terms "metal" and "punk" were applied to another 7% of songs (p. 246). "Rock" and "pop/rock" seem to be very broad categories, and perhaps ill-defined, or at least diversely defined, among listeners.
Second, there is a disconnect between genre and style that is not always accounted for in empirical musical studies. Allan F. Moore (2001) addresses this distinction in detail. For our purposes, it is most significant to note the social component to genre and the structural focus of style. When computational theorists study the structure of songs, we cannot assume a shared underlying structural grammar simply because listeners have categorized songs according to the same genre. For example, in an article introducing the Million Song Dataset, Bertin-Mahieux, Ellis, Whitman, and Lemere (2011) provide sample genre tags for Britney Spears and Bon Jovi from The Echo Nest and from Musicbrainz. Bon Jovi is tagged as "Adult Contemporary," "Arena Rock," and "80s" (The Echo Nest); and "Hard Rock," "Glam Metal," and "American" (Musicbrainz). Britney Spears is tagged as "Teen Pop," "Soft Rock," and "Female" (The Echo Nest); and "Pop," "American," and "Dance" (Musicbrainz). Even without an empirical comparison of the structural properties of these two artists' music, we can see likely social components to these tags that would be difficult to delineate structurally. For example, what makes Britney Spears's music "female," especially since several her songs were written by men? And why is Bon Jovi's music "hard" rock while Britney Spears's music is "soft" rock? Is there an objective structural feature set that delineates hard from soft in this context, or is there a social, and gendered, component to these genre tags, as is likely with the "female" tag applied to Britney Spears? Furthermore, consider the tags likely contributed by those whose musical preferences differ. We suggest that a fan of country or gospel is more likely to use the word "metal" when describing Bon Jovi than a fan of Judas Priest and Black Sabbath is. At the very least, we cannot rule out the possible subjectivity of these terms without further empirical study.
Whatever the reasons, it would be beneficial to study further the possibility of multiple stylistic practices being contained within the broad genre labels of "pop" and "rock," especially when considering these terms over the course of a time period as broad as that represented by the Rolling Stone and McGill Billboard corpora.
However, there is a chicken-and-egg problem here. To precisely define "rock" or one of its potential sub-styles empirically, we need to know what songs do and do not belong within the category of "rock." However, as Burgoyne (2011) and DeClercq and Temperley (2011) show, we do not know which songs do and do not belong inside that category. For that, we need to define the style structurally based on data from the songs contained in it, which requires knowing which songs belong to the style; which requires defining the style structurally; and so on, ad infinitum.
There is an empirical tool that can assist us with this problem. Both Burgoyne (2011) and DeClercq and Temperley (2011) mention the machine-learning technique of cluster analysis as a possible tool for discovering the emergent harmonic styles represented in these corpora. K-Means cluster analysis is an unsupervised machine-learning algorithm that takes a collection of data points, measures the Euclidean distance from each other in some predefined space, and attempts to find the tightest clusters of data points: those groups of points (in this case, songs) that are the most near (like) each other, but the most distant from (unlike) the points in other clusters. This tightness-of-clusters property is a sum-of-squares statistical measurement called inertia.
There are several clustering methods available, including hierarchical clustering, model-based clustering, and a host of other classification algorithms that can play a similar role. We chose K-means because it combined an ease of implementation with an output that could readily be used to test our analytical hypotheses (see Analytical Methods, below). Specifically, K-means cluster analysis generates a list of discrete categories, assigns each song to a single category, which we can then use to compare to (sub-)genre and (sub-)style categories proposed in other studies. Moreover, those categories are emergent, determined by the statistical properties of the songs subjected to analysis, rather than an a priori definition of the categories, or the corpus as a whole.
In other words, K-means cluster analysis gives us a tool to address the chicken-and-egg problem: collect a large dataset of popular songs, define each song as a point in harmonic-practice space, perform a cluster analysis of the corpus in that space, and uncover the clustering solution with the best inertia and the greatest musicological significance. Then we can analyze the songs in each cluster to find what specific harmonic practices are contained within the larger corpus, whose properties have been averaged over the corpus-wide analysis.
We performed such an analysis on the songs in the McGill Billboard dataset. As the following results demonstrate, there do seem to be multiple distinct harmonic (sub-)grammars present in the McGill Billboard corpus, and the results of the K-means cluster analysis help us to define those (sub-)grammars precisely, adding nuance to our understanding of the harmonic structural properties of pop/rock music.
THE DATASET
To conduct this study, we used the McGill Billboard dataset (Version 2.0, available from http://ddmal.music.mcgill.ca/billboard, and described in detail in Burgoyne, 2011). This dataset, which we will refer to as BB, contains detailed harmonic information for 730 songs taken from the Billboard Hot 100 Singles charts from August 1958 through November 1991 (Burgoyne 2011, p. 131). Because it is derived from the Hot 100, it is a sample of songs that were popular at some point in their history, but does not claim to represent a single genre. In fact, the Hot 100 list routinely comprises a variety of genres, and as noted above, presents a statistically "over-dispersed" harmonic practice, with most songs exhibiting significantly different harmonic structures than the corpus average. Thus, BB not only provides a ready-made collection of harmonically tagged musical data for computational analysis, but it also presents an ideal environment for testing the hypothesis that there are multiple structural grammars in the broad category of pop/rock music.
However, BB is not entirely ready-made for such an analysis. The dataset contains detailed harmonic tagging, but as absolute chord designations (i.e., lead-sheet symbols like "C" or "Am7") rather than relative to a tonic (i.e., Roman numerals, representing chord function within a key). Thus, we created a parser (a Python script) that would use the absolute chord data and the tonic pitch provided in BB's metadata for each song, and produce a list of chords as functional entities, represented by Roman numerals. We did not apply any "local" analysis of key changes. Rather, we simply assigned each chord a Roman numeral relative to the global tonic of the song, as provided in the metadata of each BB song file.
We also decided to use those Roman numerals to represent only the scale-degree of the chord's root, not chord quality (major, minor, etc.), the presence of chord extensions (sevenths, ninths, elevenths, thirteenths), the absence of chord tones (power chords), or the presence of suspended tones (typically seconds or fourths). This was partly because of the emphasis on root progressions in many theories of tonal harmony, but mostly because of statistical concerns. When dealing with bigrams (chord-to-chord progressions) and twelve possible chord roots, there are 144 (12x12) possible bigrams, and thus 144 dimensions to a potential cluster analysis. This is already a high-dimensional study, especially given the size of the dataset, and most of these dimensions will be empty for a given song (that is, zero occurrences of that bigram). Each additional chord parameter adds twelve new possible starting and ending chords, rapidly increasing the dimensionality of the harmonic space. And since a very small set of chord qualities and configurations account for such a high percentage of the chords in the corpus (five chord types ― major and minor triads, and dominant-, minor-, and major-seventh chords ― account for 85.7% of the chords in the corpus; Burgoyne, 2011, p. 163), the potential statistical payoff of accounting for a variety of chord types was low and came at both a computational and a statistical cost.
Once we had the harmonic data reduced and translated to chord roots relative to a tonic, we analyzed each song for its chord-progression content. For each chord-to-chord transition (bigram), we calculated the probability of the arrival chord given the starting chord. Given a IV chord, what is the probability, in a song, that the following chord is I? Flat-II? II? … VII? For each song, this analysis produced 144 probability values: I–I, I–♭II, I–II, … VII–VII. The twelve probabilities that start with the same chord (e.g., I–I, I–♭II, … I–VII) sum to 1 (or to 0, if the starting chord is not present in the song). This set of 144 values served as the basis of both our corpus-wide average calculations and the cluster analysis.
The following Table 1 is a sample bigram analysis for a single song, "Does Anybody Really Know What Time It Is?" by Chicago, represented as a 12x12 table. Probabilities represent the probability of the target chord (top row) given the preceding chord (left column). Each row sums to 1 or 0.
| I | ♭II | II | ♭III | III | IV | ♭V | V | ♭VI | VI | ♭VII | VII | |
|---|---|---|---|---|---|---|---|---|---|---|---|---|
| I | 0.0 | 0.0 | 0.0 | 0.0 | 0.0 | 0.364 | 0.0 | 0.091 | 0.182 | 0.0 | 0.273 | 0.091 |
| ♭II | 0.0 | 0.0 | 0.0 | 0.0 | 0.0 | 0.0 | 0.0 | 0.0 | 0.0 | 0.0 | 1.0 | 0.0 |
| II | 0 | 0 | 0 | 0 | 0 | 0 | 0 | 0 | 0 | 0 | 0 | 0 |
| ♭III | 0.0 | 1.0 | 0.0 | 0.0 | 0.0 | 0.0 | 0.0 | 0.0 | 0.0 | 0.0 | 0.0 | 0.0 |
| III | 0.0 | 0.0 | 0.0 | 1.0 | 0.0 | 0.0 | 0.0 | 0.0 | 0.0 | 0.0 | 0.0 | 0.0 |
| IV | 0.75 | 0.0 | 0.0 | 0.0 | 0.0 | 0.0 | 0.0 | 0.25 | 0.0 | 0.0 | 0.0 | 0.0 |
| ♭V | 0 | 0 | 0 | 0 | 0 | 0 | 0 | 0 | 0 | 0 | 0 | 0 |
| V | 0.5 | 0.0 | 0.0 | 0.0 | 0.0 | 0.0 | 0.0 | 0.0 | 0.0 | 0.5 | 0.0 | 0.0 |
| ♭VI | 0.5 | 0.0 | 0.0 | 0.0 | 0.5 | 0.0 | 0.0 | 0.0 | 0.0 | 0.0 | 0.0 | 0.0 |
| VI | 0.5 | 0.0 | 0.0 | 0.0 | 0.0 | 0.0 | 0.0 | 0.0 | 0.0 | 0.0 | 0.5 | 0.0 |
| ♭VII | 0.8 | 0.0 | 0.0 | 0.0 | 0.0 | 0.0 | 0.0 | 0.0 | 0.0 | 0.2 | 0.0 | 0.0 |
| VII | 0.0 | 0.0 | 0.0 | 0.0 | 0.0 | 0.0 | 0.0 | 0.0 | 0.0 | 0.0 | 1.0 | 0.0 |
| I | ♭II | II | ♭III | III | IV | ♭V | V | ♭VI | VI | ♭VII | VII | |
|---|---|---|---|---|---|---|---|---|---|---|---|---|
| I | 0.0 | 0.005 | 0.089 | 0.044 | 0.031 | 0.347 | 0.002 | 0.227 | 0.049 | 0.107 | 0.092 | 0.007 |
| ♭II | 0.441 | 0.0 | 0.159 | 0.043 | 0.058 | 0.038 | 0.066 | 0.087 | 0.055 | 0.0 | 0.038 | 0.014 |
| II | 0.228 | 0.02 | 0.0 | 0.009 | 0.056 | 0.125 | 0.002 | 0.465 | 0.01 | 0.05 | 0.031 | 0.003 |
| ♭III | 0.162 | 0.043 | 0.114 | 0.0 | 0.019 | 0.255 | 0.0 | 0.092 | 0.131 | 0.009 | 0.167 | 0.007 |
| III | 0.06 | 0.012 | 0.162 | 0.036 | 0.0 | 0.279 | 0.006 | 0.084 | 0.0 | 0.346 | 0.005 | 0.008 |
| IV | 0.504 | 0.001 | 0.052 | 0.027 | 0.039 | 0.0 | 0.007 | 0.268 | 0.024 | 0.026 | 0.05 | 0.001 |
| ♭V | 0.216 | 0.059 | 0.054 | 0.007 | 0.027 | 0.216 | 0.0 | 0.23 | 0.056 | 0.0 | 0.041 | 0.095 |
| V | 0.618 | 0.001 | 0.04 | 0.005 | 0.03 | 0.196 | 0.005 | 0.0 | 0.028 | 0.053 | 0.024 | 0.001 |
| ♭VI | 0.213 | 0.022 | 0.002 | 0.093 | 0.003 | 0.096 | 0.02 | 0.214 | 0.0 | 0.045 | 0.286 | 0.006 |
| VI | 0.153 | 0.007 | 0.273 | 0.001 | 0.094 | 0.286 | 0.001 | 0.132 | 0.017 | 0.0 | 0.028 | 0.008 |
| ♭VII | 0.399 | 0.001 | 0.013 | 0.057 | 0.006 | 0.289 | 0.0 | 0.103 | 0.084 | 0.041 | 0.0 | 0.007 |
| VII | 0.209 | 0.03 | 0.045 | 0.03 | 0.414 | 0.092 | 0.045 | 0.03 | 0.0 | 0.046 | 0.06 | 0.0 |
Table 2 contains the song-by-song average for the entire corpus. All average probability tables in this article have been normalized so that each row sums to 1. Because some songs will have zeroes for each value in a row, not all averages will sum to 1 without this normalization, leading to difficulty reading and interpreting the tables. Normalized rows make both within-table and cross-table comparisons easier.
ANALYTICAL METHODS
The goal of this study is to use the machine-learning technique of K-means cluster analysis in combination with ad hoc human analysis to test the hypothesis that the McGill Billboard dataset contains exemplars of multiple harmonic grammars, rather than a single harmonic grammar represented by a corpus-wide probabilistic average (see Table 2). In statistical terms, we hypothesize that the BB corpus is not a sample of a single population of "pop/rock" songs, but rather a mixture of samples from various musical styles. We also hope to produce empirical data that problematizes the equating of style and genre, something that is not uncommon in the machine learning community when addressing musical data, particularly in discussions of music recommendation systems (for examples, see Flexer et al., 2006, and Prockup et al., 2015).
To test this hypothesis, we subjected the 144-dimensional bigram (chord-to-chord transition) analysis described above to a K-means cluster analysis. Like all unsupervised machine-learning algorithms, K-means cluster analysis has the advantage of the resulting clusters―in this case, the harmonic grammars present in the corpus―being emergent. However, the number of clusters must be predetermined by the analyst, and can be anything from one cluster (a trivial case) to 730 clusters (another trivial case, with each cluster containing a single song). How do we choose the appropriate number of clusters? We will refer to the number of clusters as the cardinality of the clustering solution.
For a dataset the size of BB, it is not difficult to run the clustering algorithm multiple times with different cardinalities, even on a personal computer. Further, each clustering solution produces a single inertia value that represents the tightness of the clusters, making it easy to compare the results of many cardinalities to find the tightest fit.
However, the more clusters contained in a solution, the more unwieldy the musical analysis. Harmonic "grammars" proliferate, and categories become too small to represent a meaningful generalization of a musical practice. Furthermore, our study would also hit a human bottleneck if we were to analyze the musical significance of the 144 probability values in each of the 266,815 clusters produced by running the algorithm on each cardinality from 1 to 730. To find an optimal clustering solution, we need to form a specific hypothesis to test, limiting the algorithmic output to something that is both analyzable by humans and has the potential to represent something that is musically meaningful. With that in mind, we formed two specific hypotheses based on existing research on style and genre in popular music, and sought clustering solutions in and around those hypothetical scenarios.
The first hypothesis comes from Everett's (2004) six "tonal systems," three of which were divided into two subsystems, rendering a potential of 6–9 harmonic grammars in music Everett categorized as "rock" (note the genre–style relationship). It is important to note that in Everett's article, he purposefully went outside the popularity charts to find songs that he believed were important or influential in rock history. This resulted in at least one tonal system that likely would not exist in a study that, like ours, is based entirely on the Billboard charts. Based on Everett's study, then, we hypothesized that there were between five and nine harmonic (sub-)grammars in the BB corpus, and thus that a clustering solution with cardinality 5, 6, 7, 8, or 9 would be optimal.
The second hypothesis comes from Schreiber (2015), who settled on a list of fifteen genre tags for popular music, based on user-generated tags for songs affiliated with another popular music dataset. We decided to test the hypothesis that the relationship between user-tagged genre and structural style would be strong and, therefore, there would be fifteen harmonic (sub-)grammars in the BB corpus, leading to an optimal clustering solution with cardinality 15. (Note that because we find the genre–style conflation to be problematic, and because harmonic grammar is not the only distinguishing marker of a musical style, we predicted that cardinality 15 would not likely produce the optimal clustering solution.)
To test these hypotheses, as well as other options near to them, we constructed a set of scripts (using Python and the machine-learning toolkit SciKit-Learn) that would run the clustering algorithm for cardinalities 1–15. This would give us a base-line inertia value for a corpus-wide average (cardinality 1), as well as all cardinalities suggested by the Everett-based hypothesis and the Schreiber-based hypothesis, and other values between those. (We were also open to the possibility of testing a higher cardinality if the results of these tests suggested it would be useful, but as will be discussed in what follows, that was not the case.). All code, as well as the parsed and key-oriented version of the BB corpus that we used, can be found in our GitHub repository for this project (github.com/corpusmusic/bb-cluster). We invite interested readers to reproduce our results, as well as to submit corrections and/or enhancements to the repository.
RESULTS
The results of each clustering solution for the 730-song corpus can be found in our GitHub repository (https://github.com/corpusmusic/bb-cluster/blob/master/song_metadata_and_clusters.csv). In what follows, we discuss the implications of those solutions statistically and musicologically.
Inertia values
Our clustering script produced solutions with the following inertia values (where lower is better):
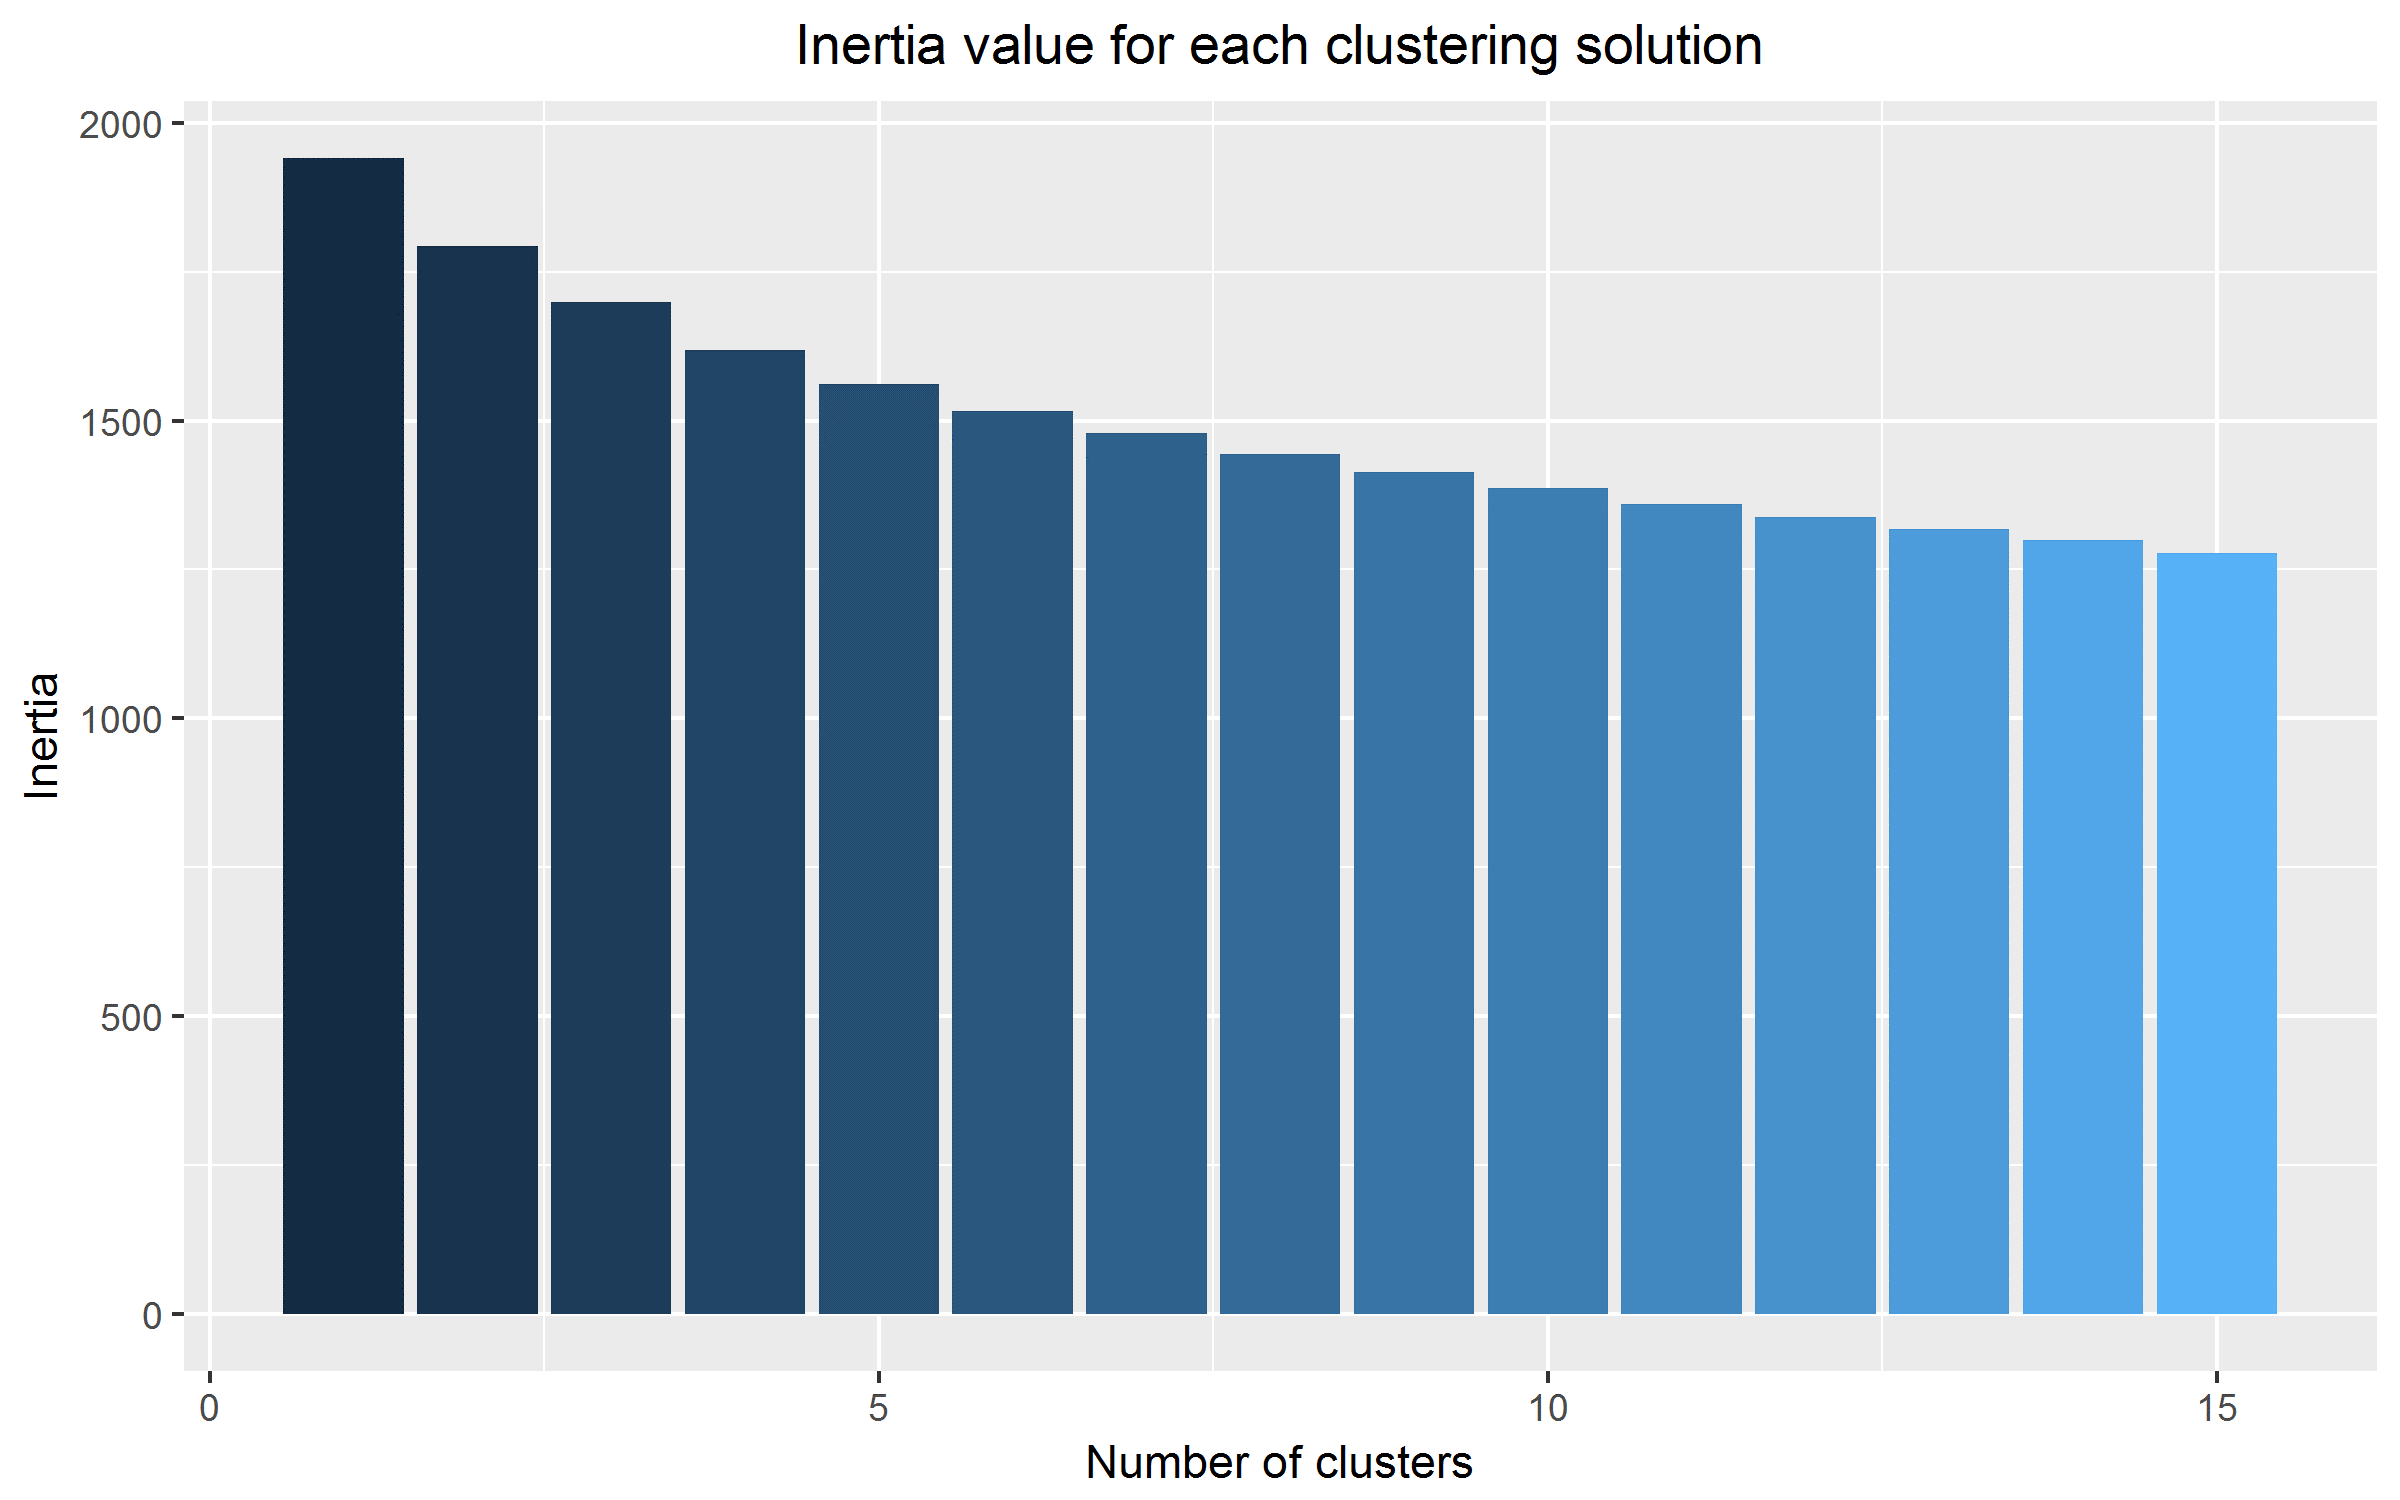
Figure 1. Inertia values for K-means cluster analysis of McGill Billboard dataset, with cardinalities 1–15.
Increasing the number of clusters, unsurprisingly, brings the inertia down. Also, it is not surprising that the more clusters there are, the less of an impact the addition of a single cluster to the model has on the inertia value. Taken on its own, this list of inertia values suggests that the 15-cluster solution is the best of those tested, but also suggests that increasing the number of clusters still further would result in tighter, more meaningful clusters.
However, it is typical for inertia to decrease as the number of clusters increases, even if the higher-cardinality clustering solutions do not provide any additional useful insights. One method to find the optimal solution in such a situation is to find the point at which increasing the number of clusters generates a much smaller decrease in inertia than at previous points. This method is called the elbow criterion because when plotting the inertia for each cardinality of clusters, as in Figure 1, the change from large drops in inertia to small drops in inertia looks like an elbow. However, for our cluster analysis no such elbow occurs. Rather, the curve is smooth.
There are several other standard statistical practices for determining the optimal number of clusters in a k-means analysis. (See Manning et al., 2008, p. 356ff.) However, since we are searching for a meaningful generalization of harmonic practice, our knowledge of musical theory can inform the analysis of our model, as well. As discussed above, we want to find a balance between reflecting the nuance of each individual song (a 730-cluster solution) and the generalizability of a single grammar or common set of patterns that allows us to speak at the level of a stylistic practice. Thus, we must examine the musical significance of the clustering solutions in addition to the statistical tightness of the clusters before drawing any conclusions. To do this, we evaluated the clustering solutions according to two musical criteria: nuance and generalizability.
As we define it for this study, a clustering solution demonstrates nuance by placing songs into different clusters when they are based on stylistic or grammatical differences in their harmonic structures. For example, blues-based songs tend to privilege chord progressions like V–IV–I that do not fit into the grammatical pattern of common-practice classical harmony (subdominant–dominant–tonic patterns like IV–V–I). A musically meaningful clustering solution will generally place blues-based and classical-based songs in different clusters.
On the other hand, a musically meaningful clustering solution will demonstrate generalizability in that distinctive properties of that cluster can be used by musicians to make predictions about the harmonic structures of other similar songs and can be used prescriptively to compose new songs that match the practice. In other words, a generalizable solution is one that does not overfit the training set. For example, while blues/classical seems a priori to be an appropriate distinction between clusters, distinguishing songs that make use of different tonic-expansion chords does not―for example, songs that frequently use I–V–I early in a phrase compared to songs that frequently use I–IV–I early in the phrase.
Balancing these musical considerations means that there is necessarily a feedback loop between existing harmonic theory and emergent results from our model. We found, though, that the dialog between existing theory and our model, as well as the different emphases of several different clustering solutions, provide a degree of insight into pop/rock harmonic practices that a single clustering solution cannot. In what follows, we present what we found to be the most musically meaningful clustering solutions, and the story that emerges from considering them together.

Figure 2: Map of emergent clusters and their relationships, moving from full corpus through eight-cluster solution.
Musical analysis of the clusters
Before walking through the details of each individual clustering solution, it is helpful to consider the results altogether. As we analyzed each cluster in each solution, we found that not only did specific harmonic practices define specific clusters, but that several of those practices consistently appeared as cluster-defining features across a range of cardinalities. As cardinalities increase from two to roughly eight clusters, these distinctions of practice increase in nuance, while still maintaining generalizability. However, beginning around the 9-cluster solution, increasing the number of clusters does not lead to new, emergent practices, but instead leads to an overly fine distinction of specific, low-level chord progressions, such as specific means of tonic expansion. Thus, the categories that emerge from our model as we increase the number of clusters from one to eight form a loose kind of hierarchy that is helpful in distinguishing pop/rock harmonic practices at different levels of precision. The specific practices that emerge include many categories already noted in the analytical literature, as well as some new, emergent categories of harmonic practice that bring further clarity to our understanding of pop/rock harmony.
Consider the following network visualization (Figure 3) of chord transitions in the entire BB corpus (see Table 2 for specific chord transition probabilities). While certain chord progressions are clearly more common than others, the mixture of multiple practices can be readily seen―classical-based or "authentic" progressions like II–V–I, blues-based or "plagal" progressions like IV–I, modal progressions like ♭VII–I, and so on.
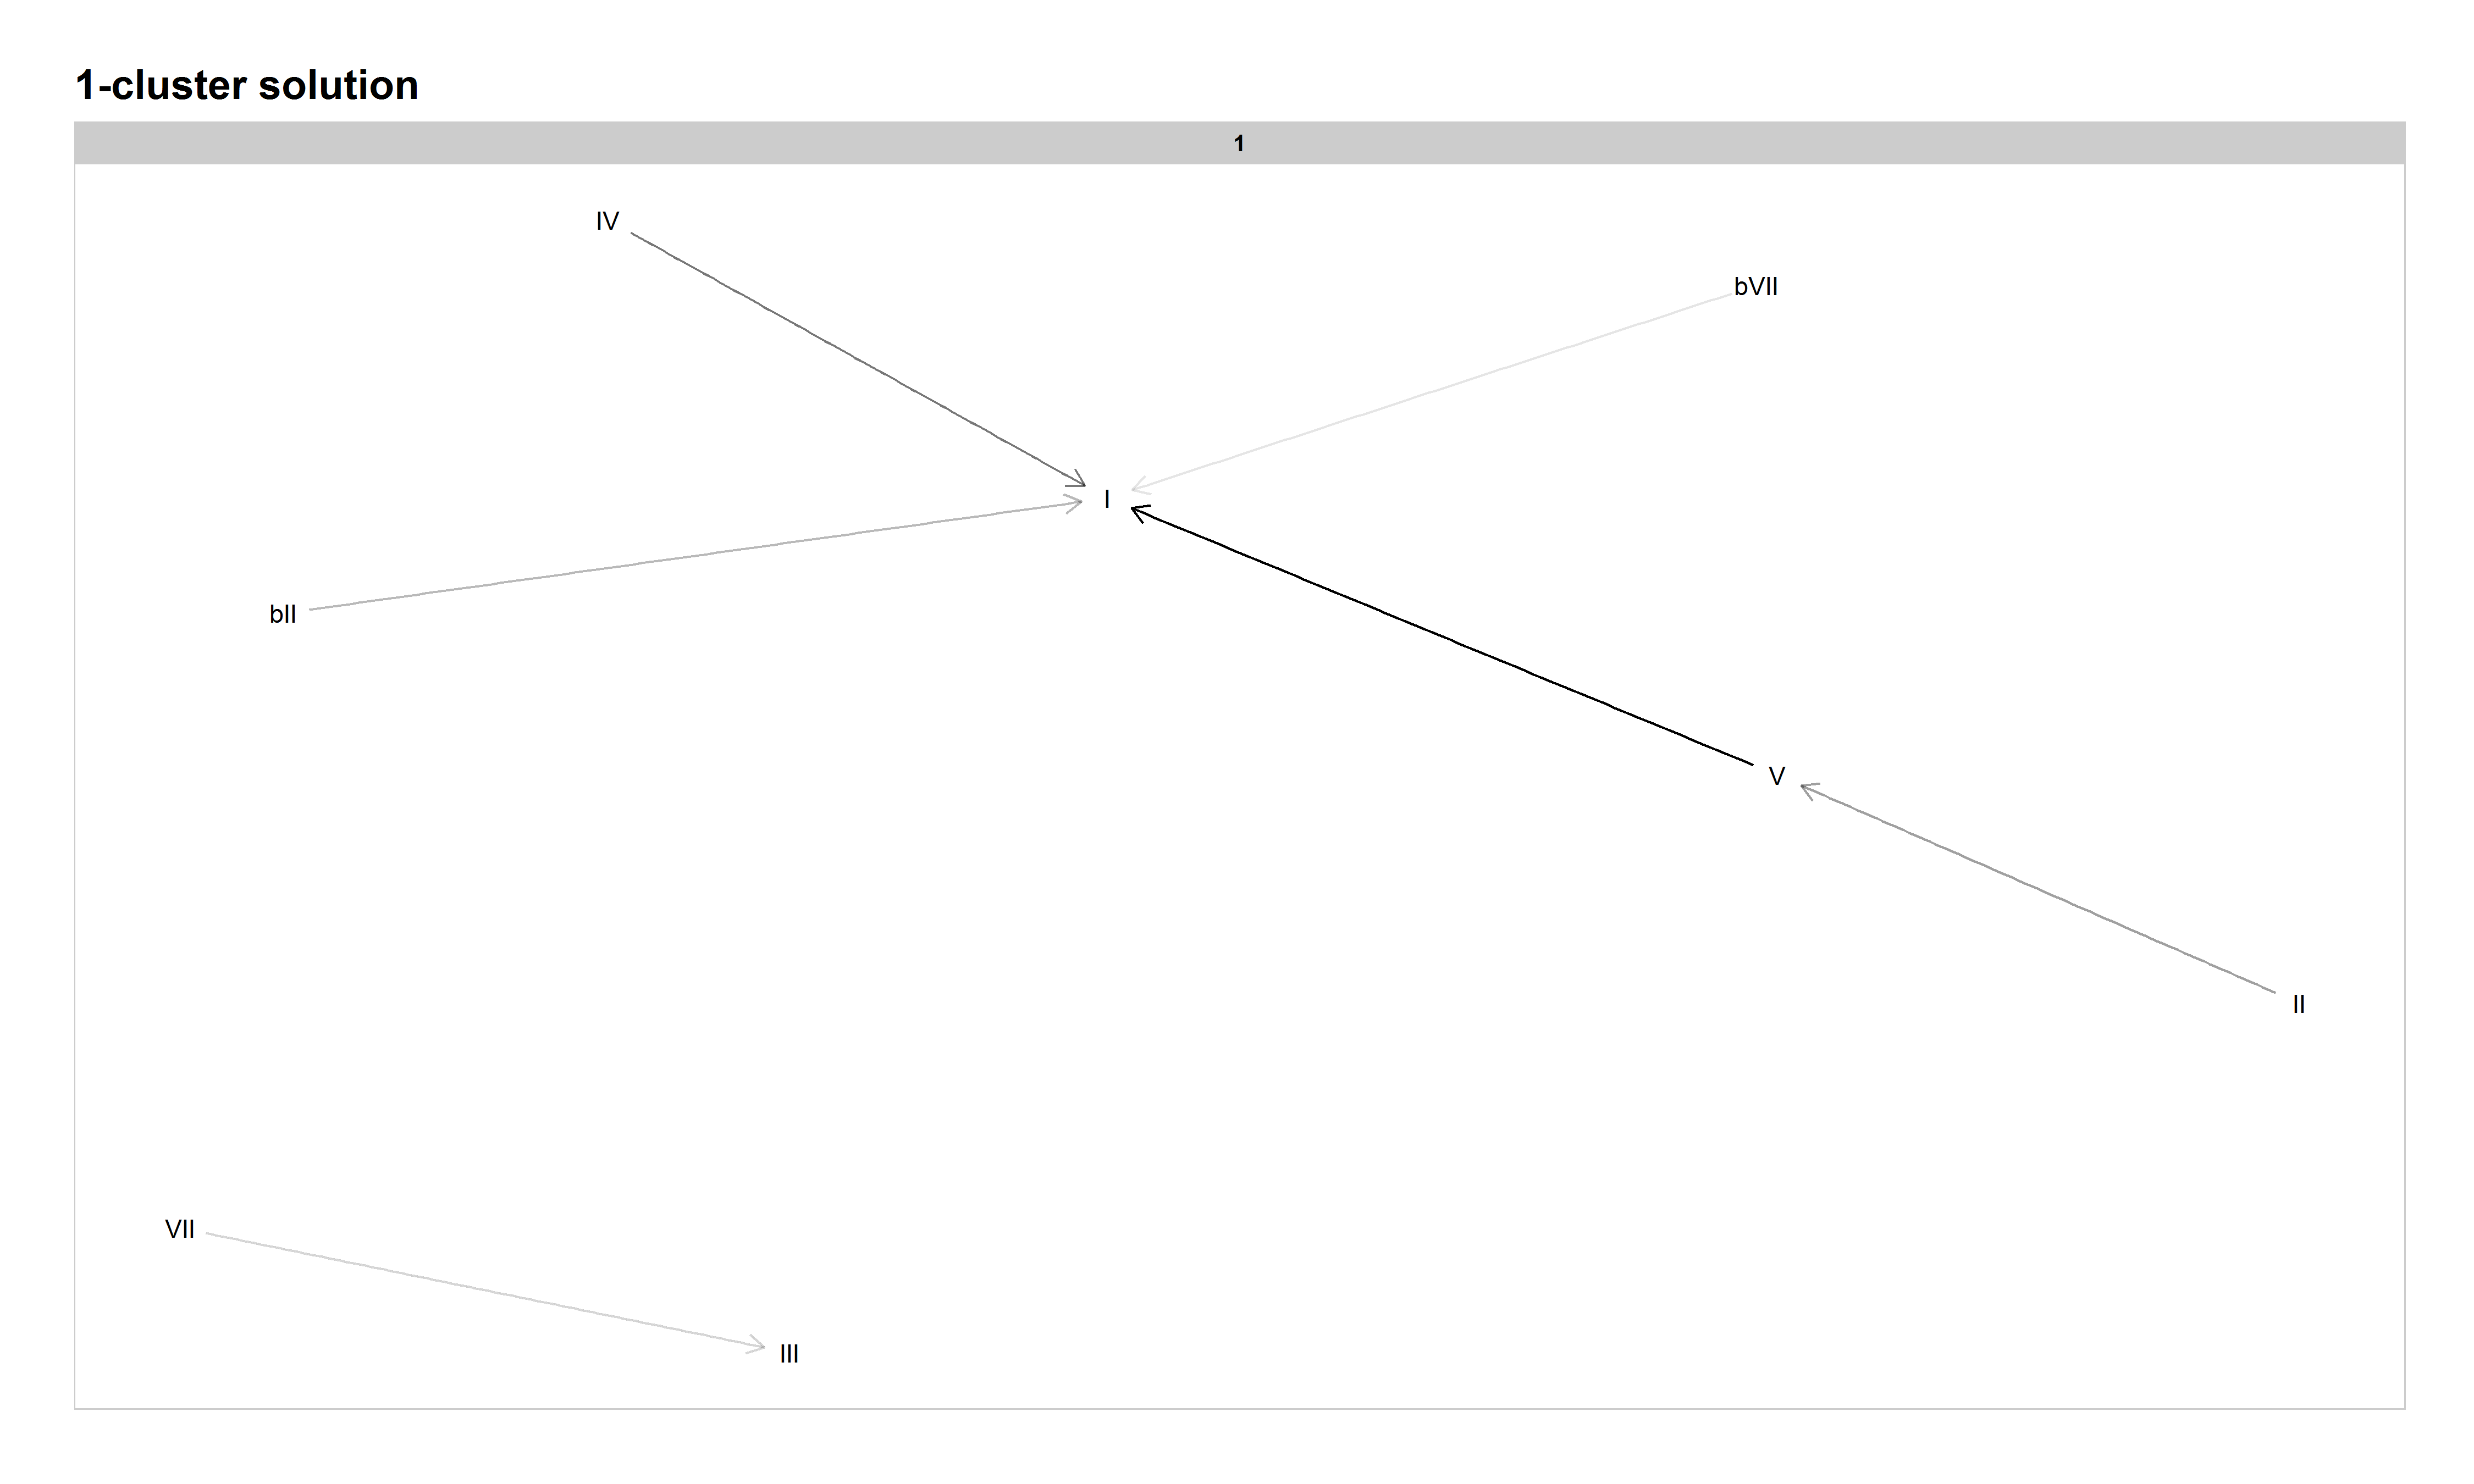
Figure 3: Network graph of harmonic progressions in the McGill Billboard dataset. Darker lines denote higher-probability progressions. Only progressions with a probability of 0.35 or greater, given the starting chord, are included.
When our model divides the corpus into two clusters, though, a distinction between authentic progressions (Cluster 1, analogous to the classical tonal system from Everett, 2004) and plagal progressions (Cluster 2) emerges. Sample songs for the authentic Cluster 1 include "Will You Love Me Tomorrow" by The Shirelles (1961), "Help!" by The Beatles (1965), "Hocus Pocus" by Focus (1973), "Heartbreaker" by Pat Benetar (1980), and "Need You Tonight" by INXS (1988); sample songs for the plagal-focused Cluster 2 include "The Twist" by Chubby Checker (1962), "Dream Police" by Cheap Trick (1979), and "White Wedding" by Billy Idol (1983). This distinction between classical-based and blues-based (or descending and ascending circle-of-fifths) is readily made by musicians, and that distinction is borne out by the differences in transitional probability profiles between these two clusters (see our GitHub repository for a complete set of probability tables).
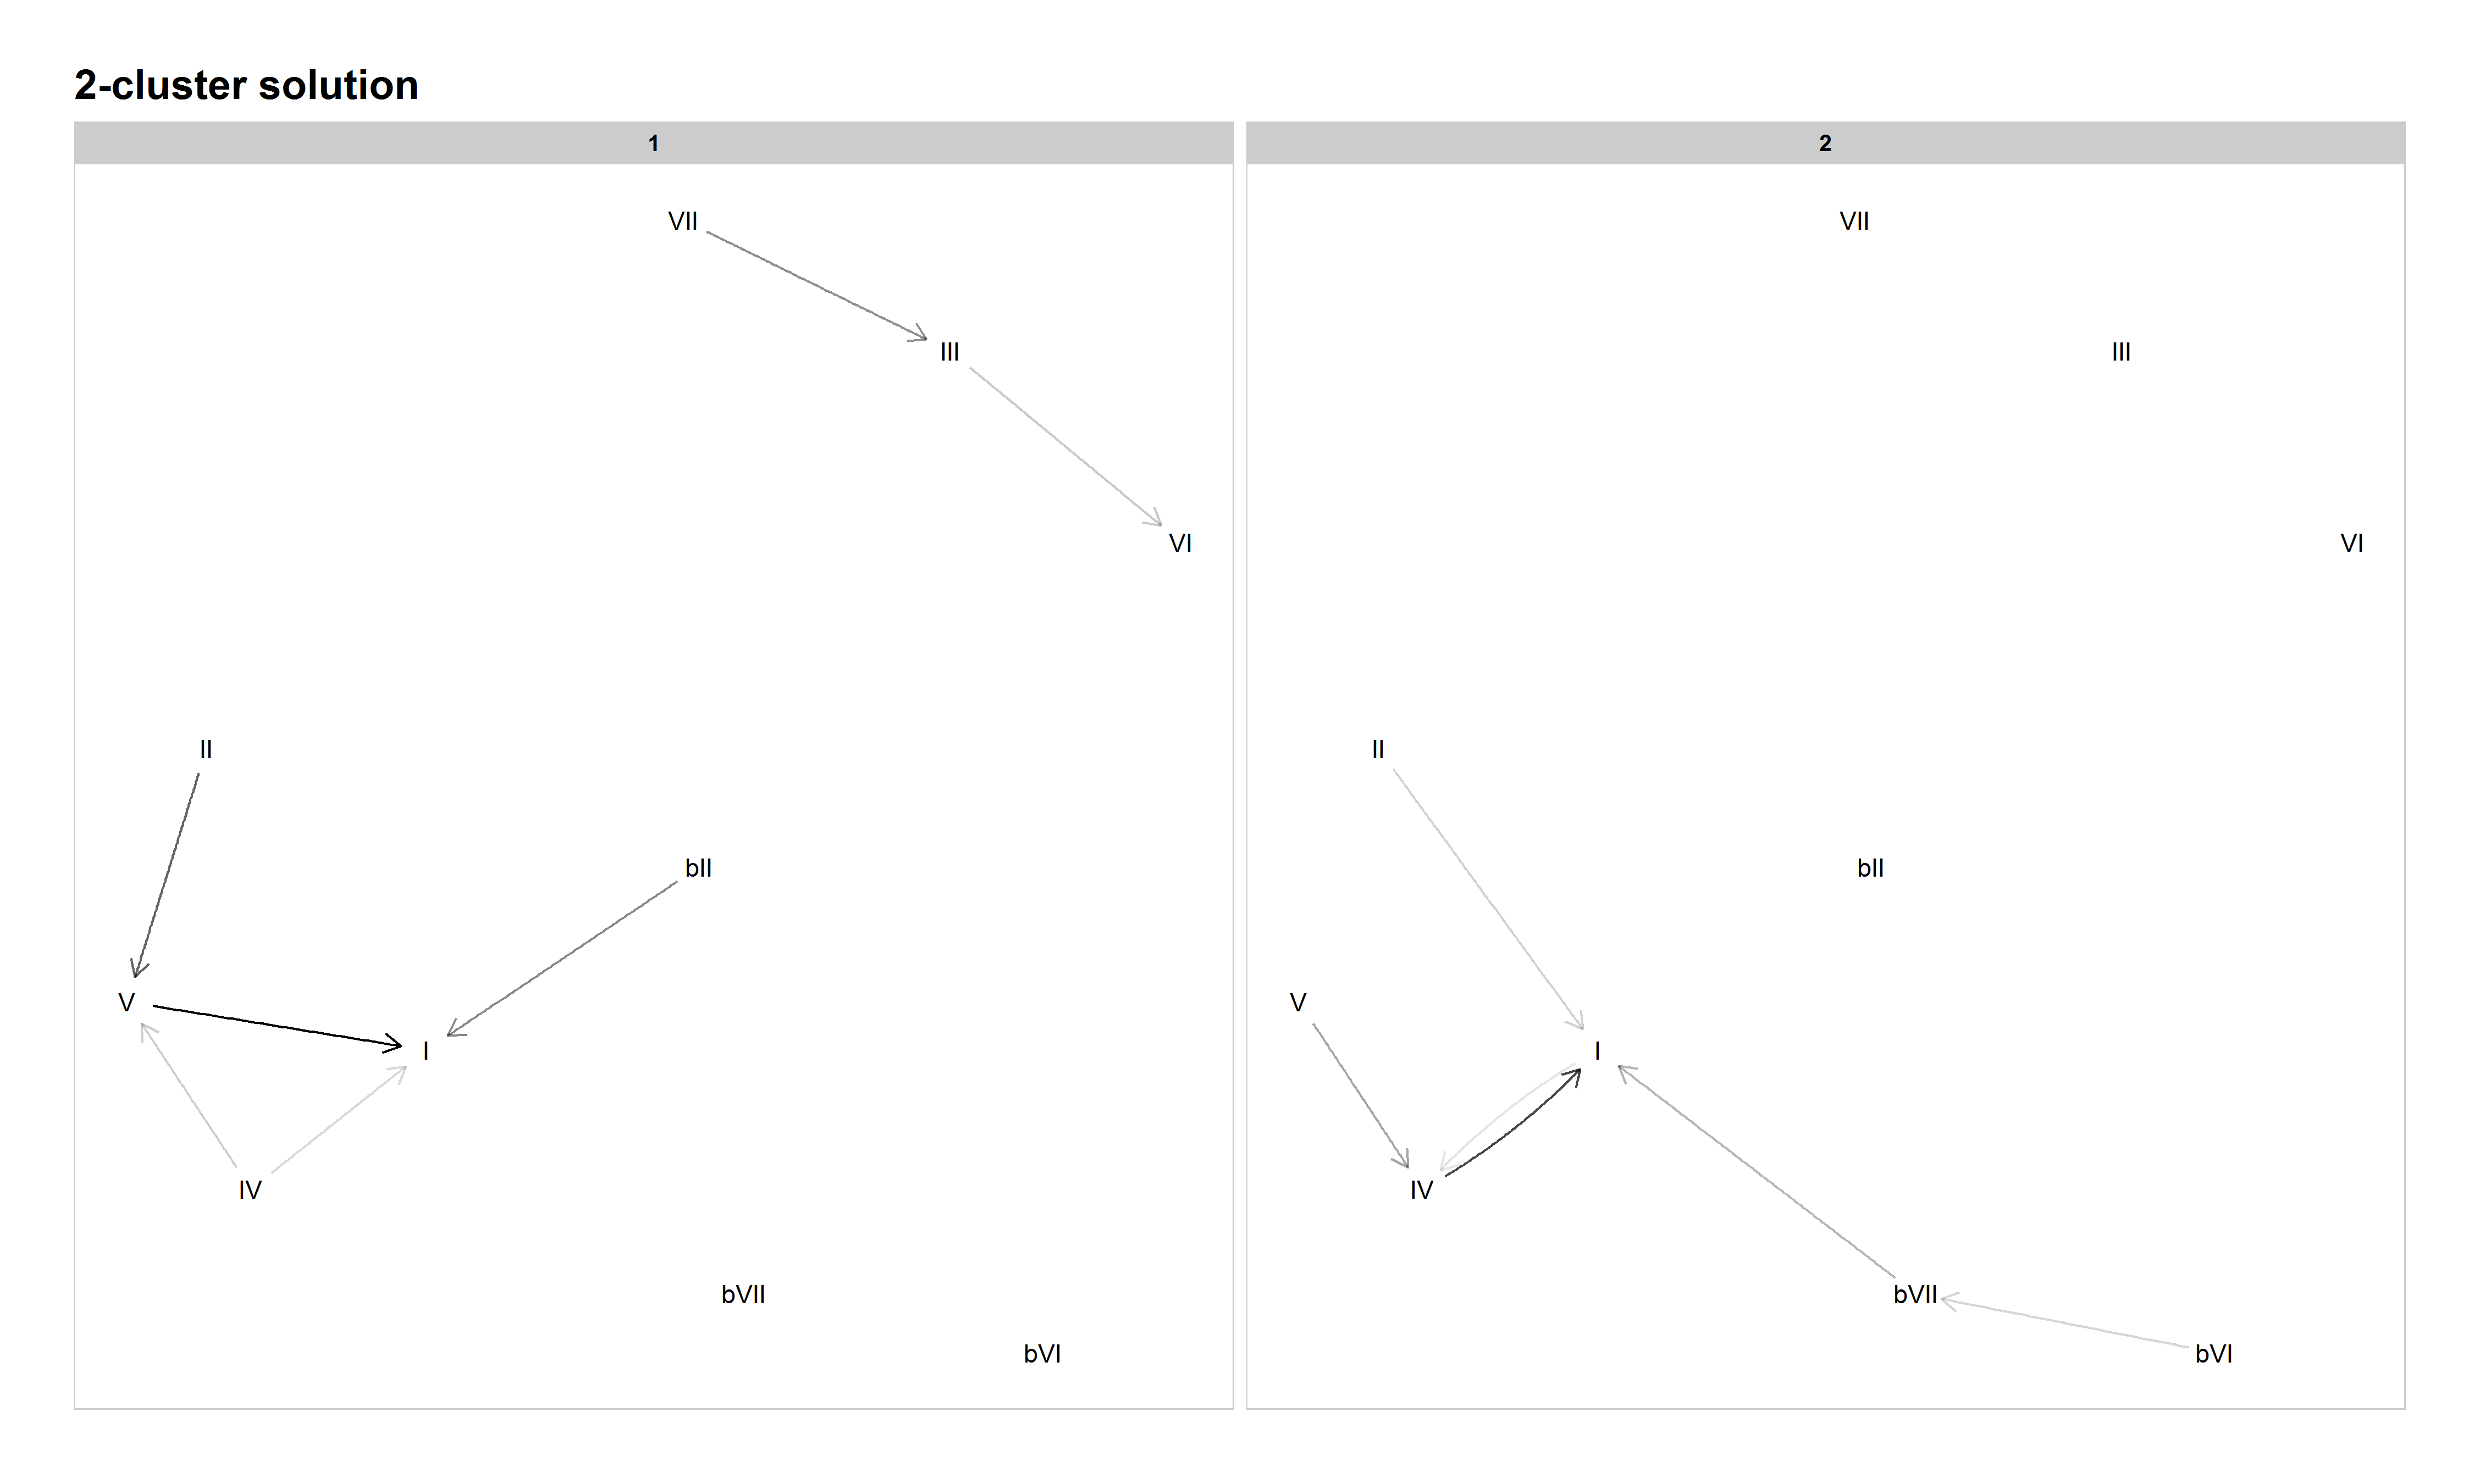
Figure 4: Network graph of harmonic progressions in the McGill Billboard dataset, 2-cluster solution. Darker lines denote higher-probability progressions. Only progressions with a probability of 0.35 or greater, given the starting chord, are included.
However, there also seems to be some potential mixing of practices within these two clusters. For example, the combination of the blues progression (V–IV–I) with a common authentic minor-key progression (♭VI–♭VII–I) in Cluster 2, and the incomplete fragments of a circle-of-fifths progression in Cluster 1, hint at further helpful distinctions to come when increasing the number of clusters.
Increasing the cardinality to three clusters indeed adds one of those distinctions, as Cluster 1 and 2 split the authentic progressions into two categories. Cluster 1 emphasizes a nearly complete descending circle-of-fifths progression, with songs like "Kokomo" by The Beach Boys (1988) and "Tell It Like It Is" by Aaron Neville (1966), while a 50s doo-wop progression (VI–IV–V–I) dominates Cluster 2 ("Will You Love Me"). Cluster 3 preserves the presence of a plagal category in the 3-cluster solution. However, Cluster 3 also hints at further distinctions to arise with higher cardinalities, as both the blues progression and what Everett denotes the double-plagal progression (♭VII–IV–I) are prominent.
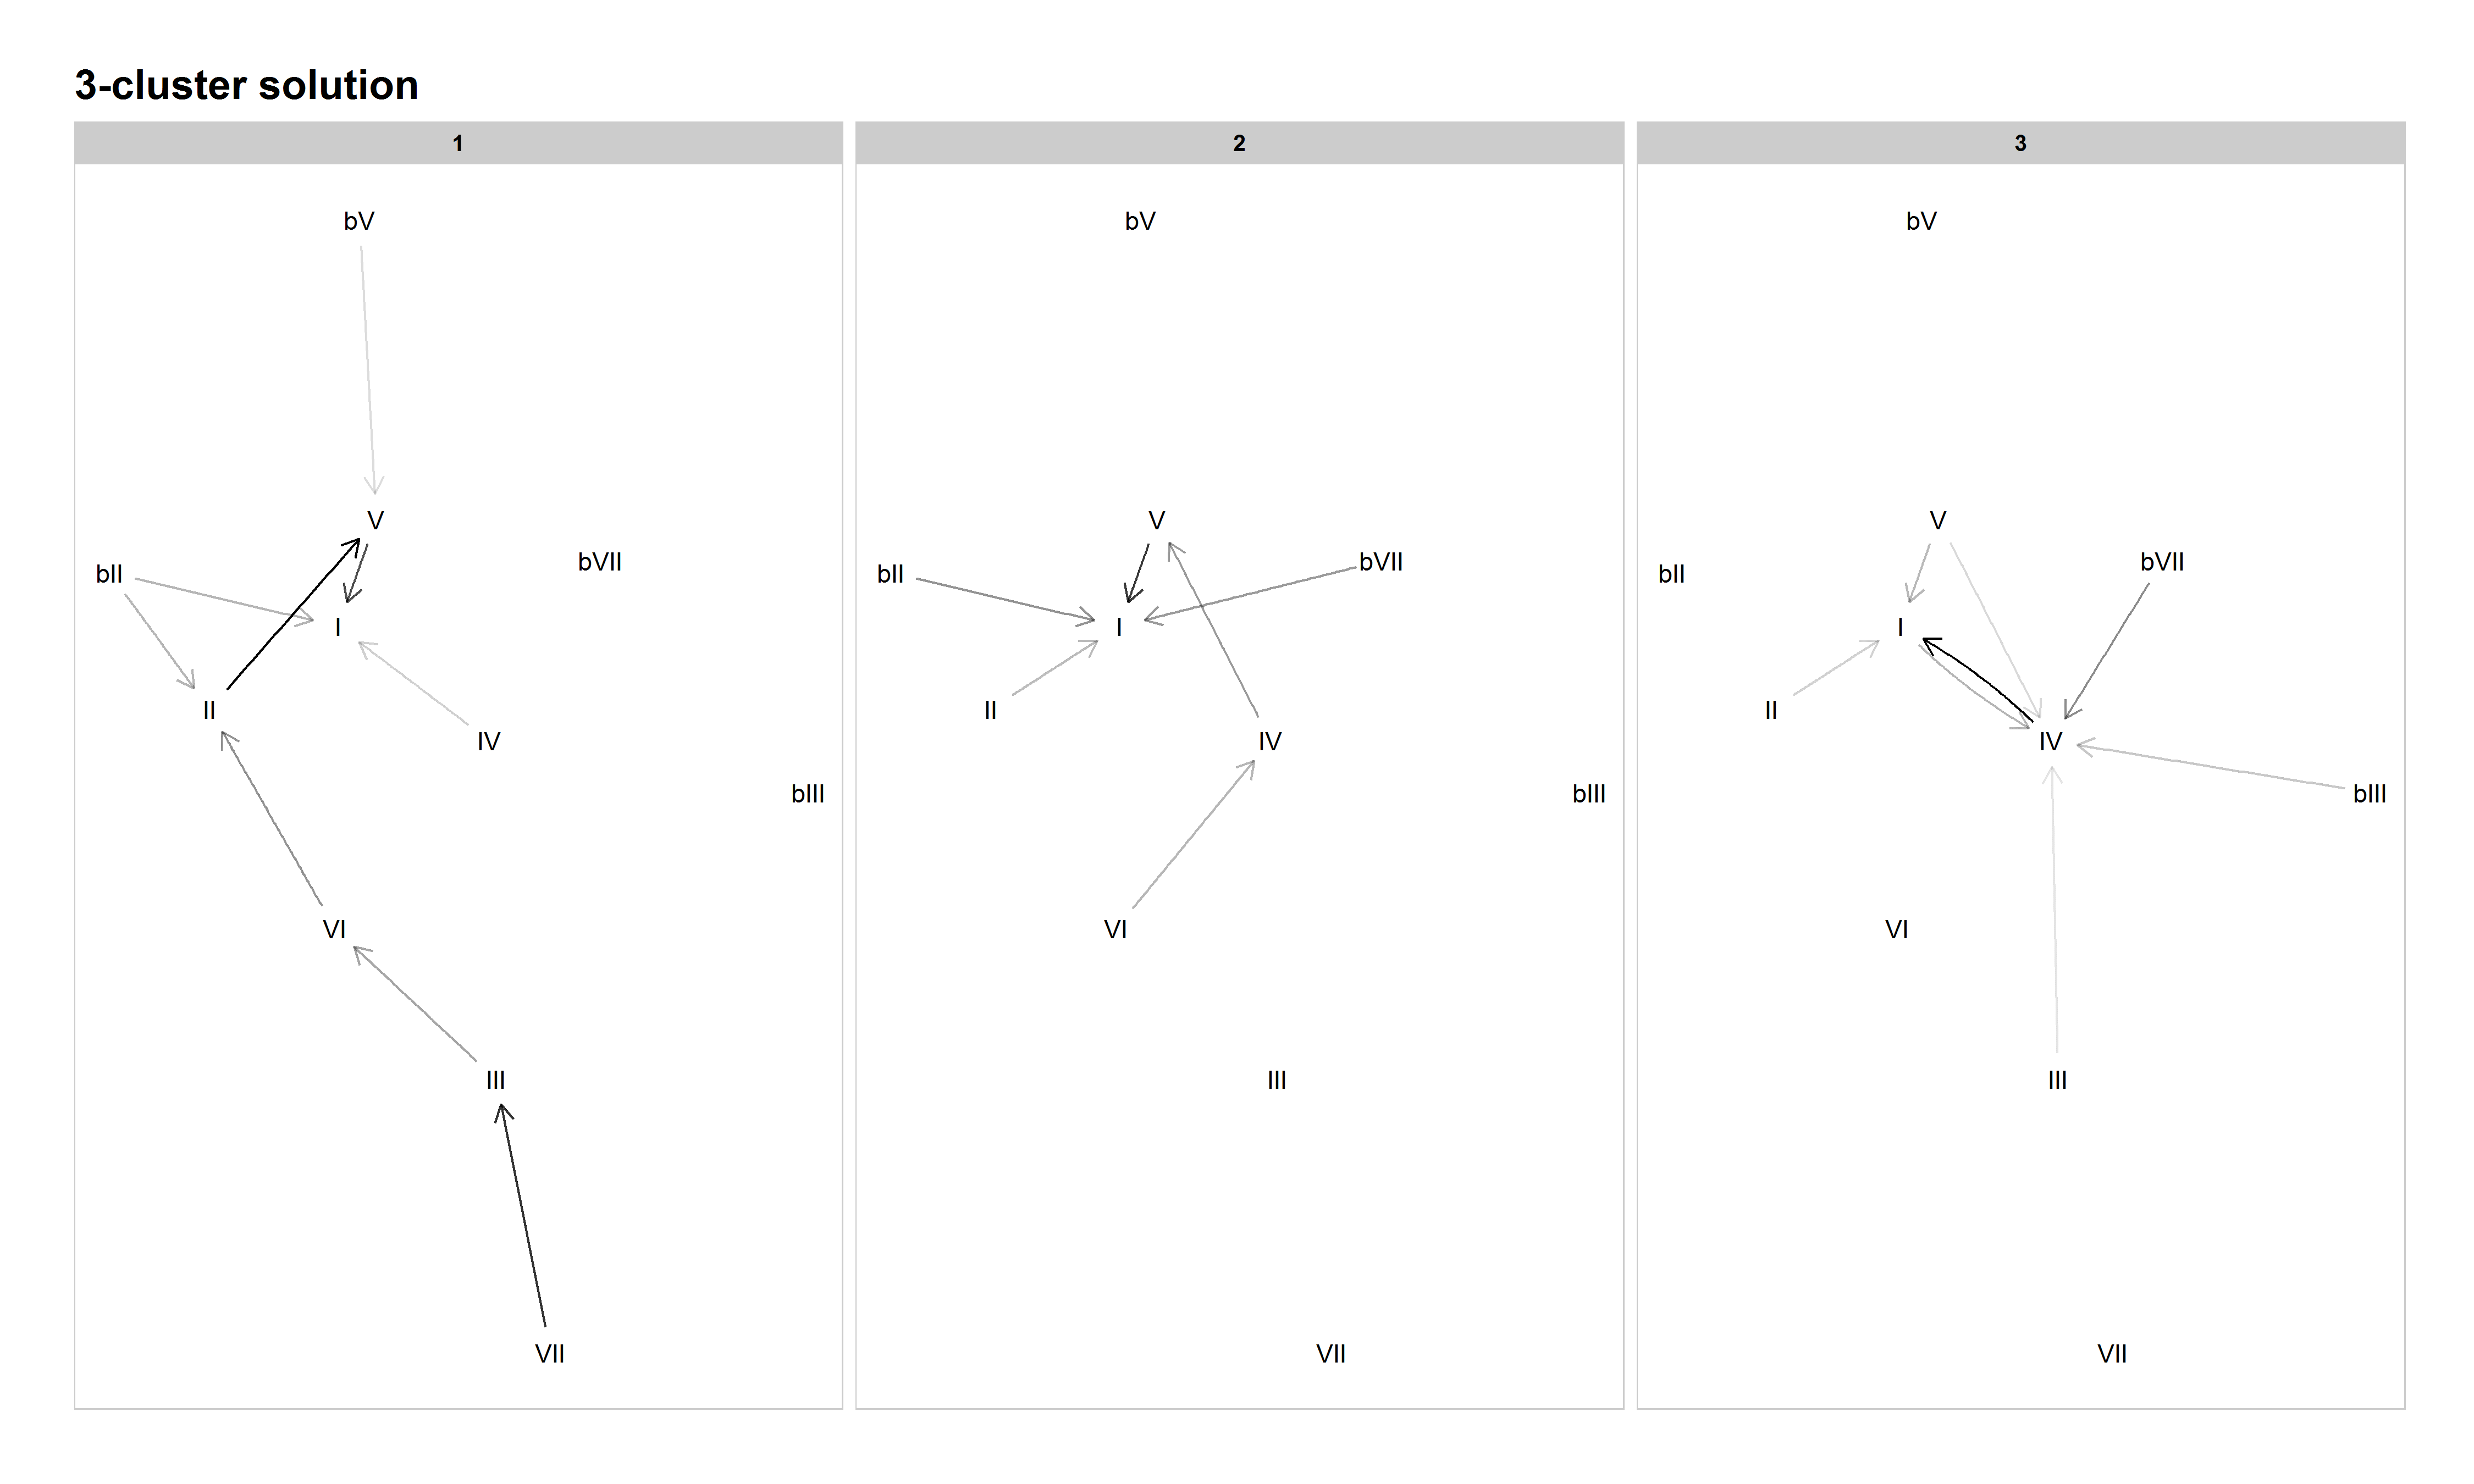
Figure 5: Network graph of harmonic progressions in the McGill Billboard dataset, 3-cluster solution. Darker lines denote higher-probability progressions. Only progressions with a probability of 0.35 or greater, given the starting chord, are included.
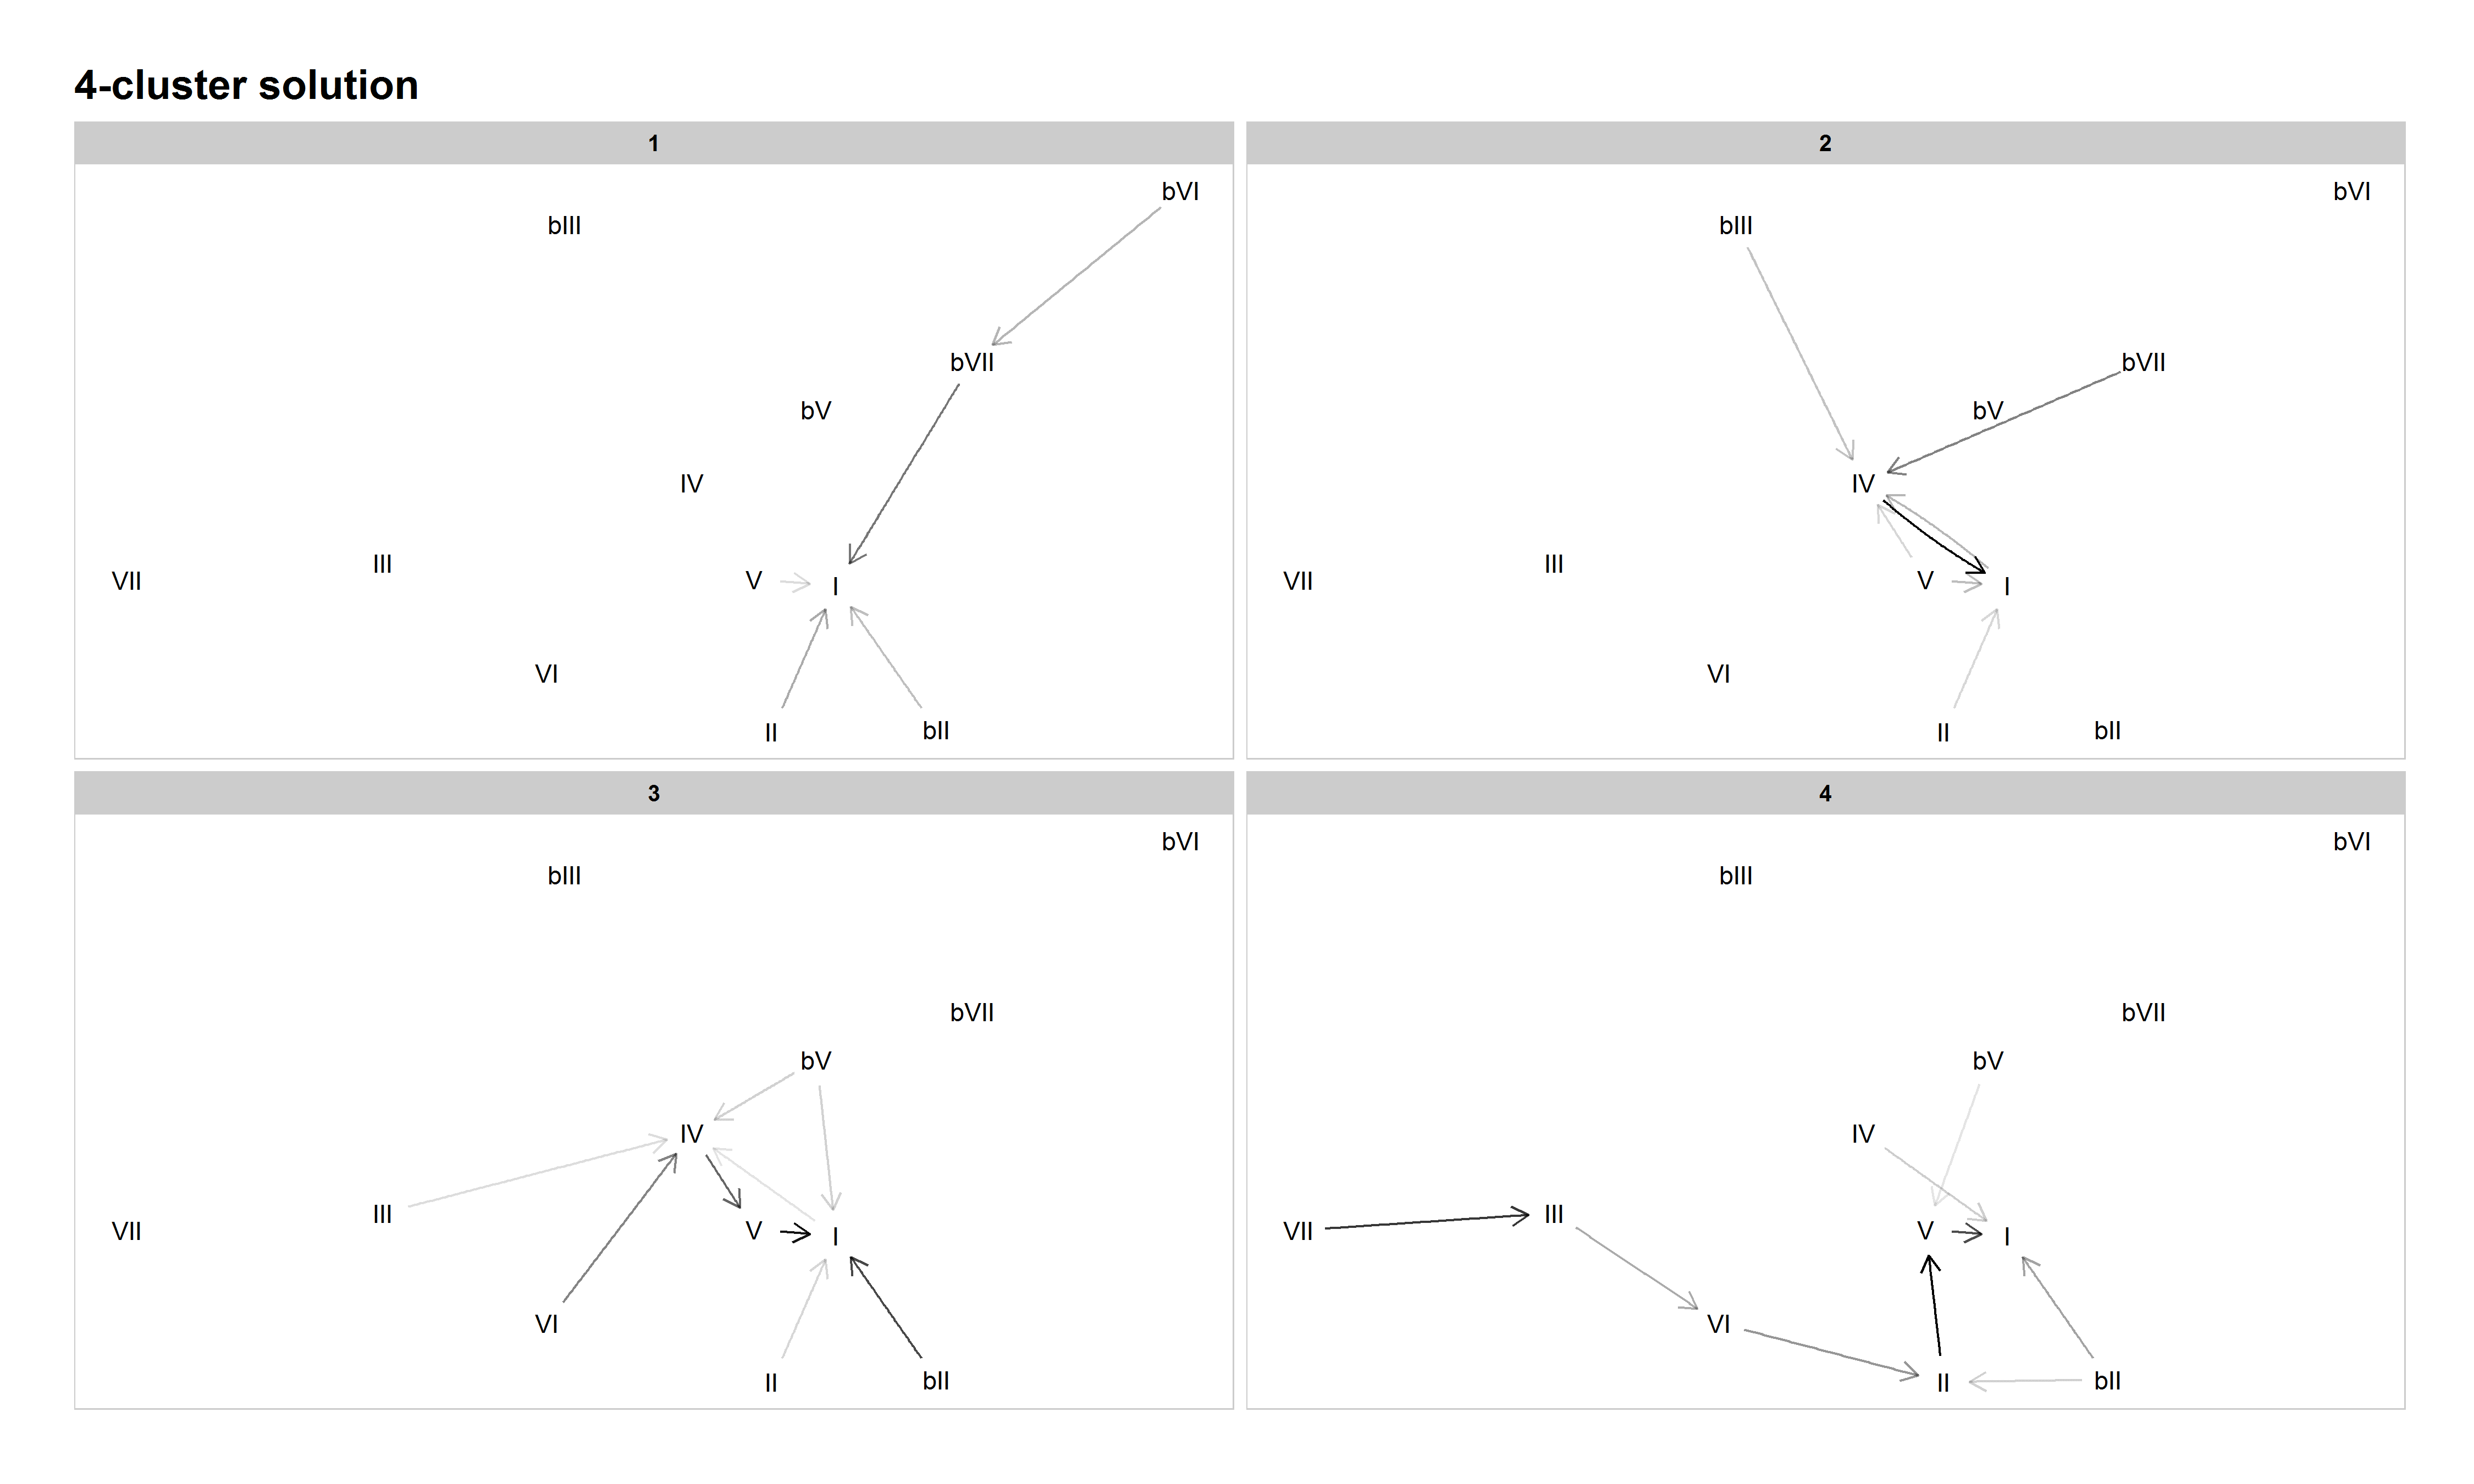
Figure 6: Network graph of harmonic progressions in the McGill Billboard dataset, 4-cluster solution. Darker lines denote higher-probability progressions. Only progressions with a probability of 0.35 or greater, given the starting chord, are included.
The 4-cluster solution seems to be a bit of a regression, musically speaking. Cluster 1 emphasizes the descending circle of fifths, but the minor-key pattern ("Heartbreaker") has broken away from doo-wop and joined the circle of fifths in Cluster 1. Cluster 2 emphasizes plagal progressions, and Cluster 3 authentic/doo-wop harmony. Cluster 4 is another odd mixture, with both descending circle-of-fifths and double-plagal progressions rising to prominence. While those progressions tend to occur in different songs from each other, some songs, such as "Country Road" by James Taylor (1971), mix authentic and double-plagal progressions. "Maybe I'm Amazed" by Paul McCartney (1977) represents the more extended ascending-fifth progression in this cluster. While there are more clusters and a lower inertia value, this clustering solution seems less musically meaningful than the 3-cluster solution, which has a clear division between known practices.
The 5-cluster solution produces a more musically meaningful clustering than the 4-cluster solution. Cluster 1 contains plagal (including both blues-based and double-plagal) patterns ("The Twist" and "Country Road"). Cluster 2 emphasizes modal harmony (another category articulated by Everett), with many chords, especially ♭VI, preferring to go to ♭VII, and with II, V, and ♭VII all tending to progress to I. Cluster 3 is the now-familiar descending-fifths cluster, and Cluster 4 the authentic/doo-wop (VI–IV–V–I) cluster. In Cluster 5 a new practice emerges, which we dubbed "tonic lovers." In this cluster, most of the commonly occurring chords tend to progress to I at very high probabilities. Examples include "Ob-La-Di, Ob-La-Da" by The Beatles (1968―BB metadata incorrectly dates this song as 1976), "You've Got Another Thing Comin'" by Judas Priest (1982), and "Amanda" by Boston (1986). Though not a commonly discussed (sub-)grammar in the analytical literature, our model suggests it is a significant harmonic practice in this corpus, worthy of more attention in the study of pop/rock harmony.
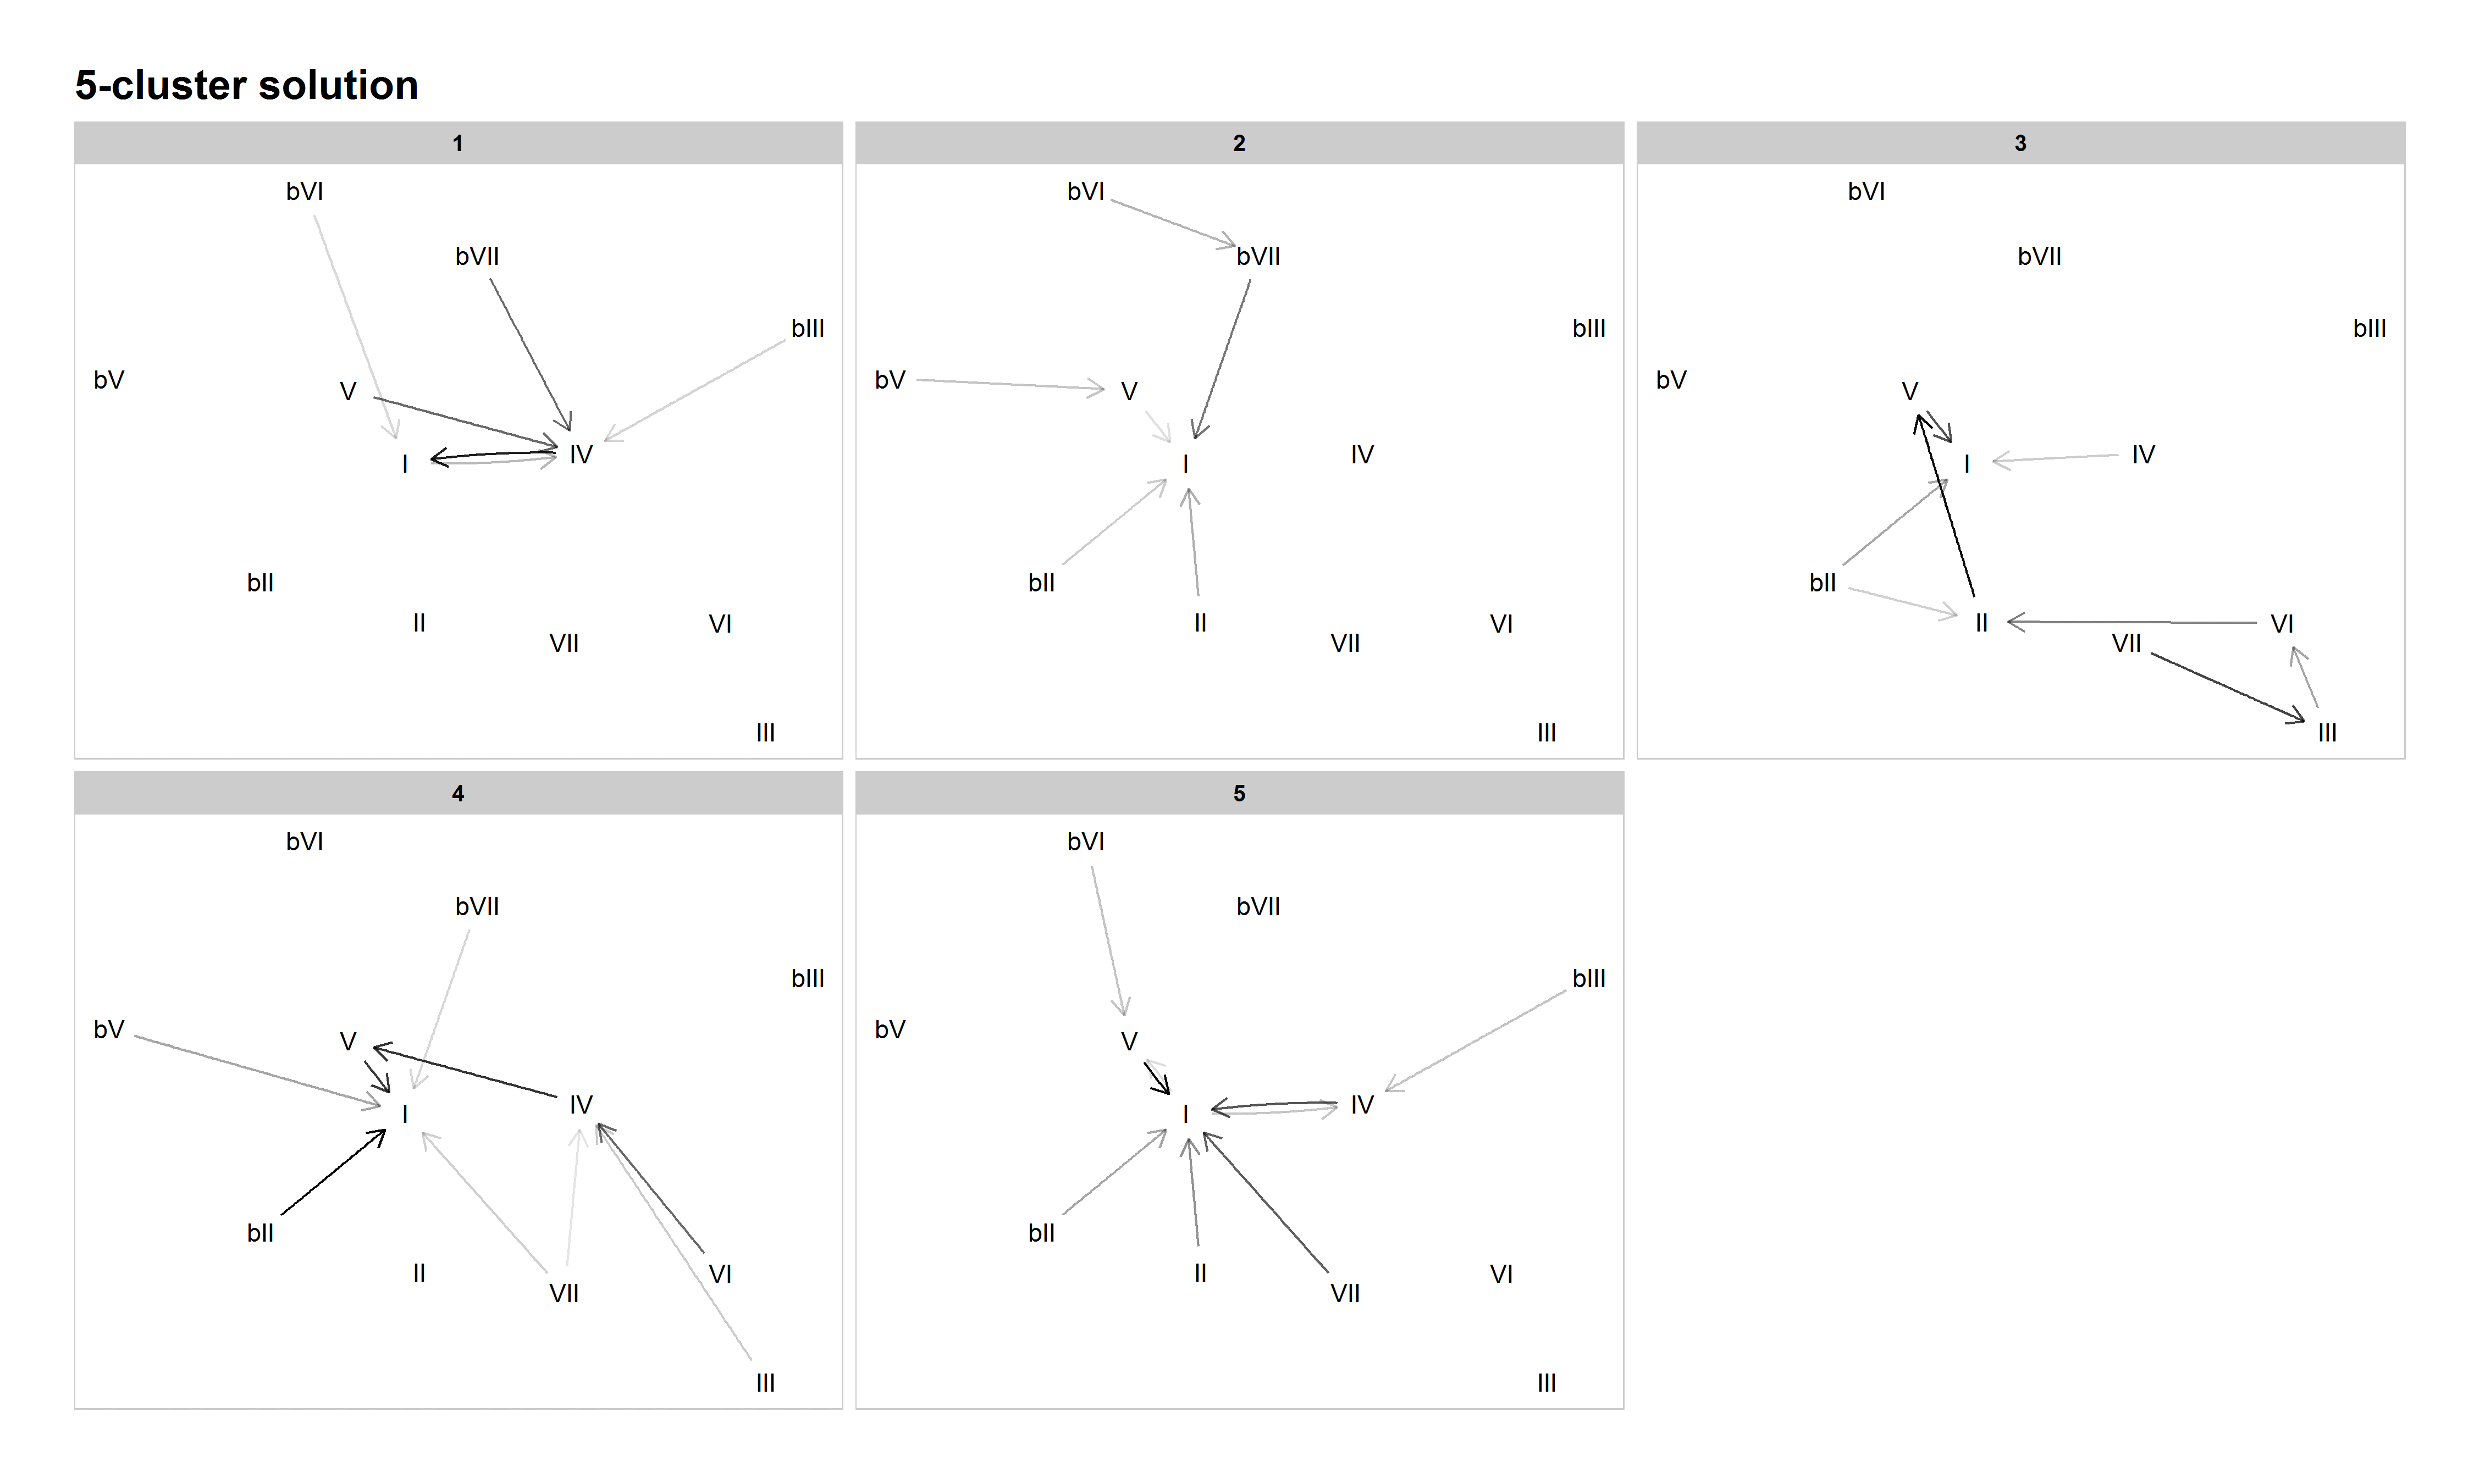
Figure 7: Network graph of harmonic progressions in the McGill Billboard dataset, 5-cluster solution. Darker lines denote higher-probability progressions. Only progressions with a probability of 0.35 or greater, given the starting chord, are included.
The 6-cluster solution contains some now well-established patterns and continues the process of refining the musical significance of the clusters. Cluster 1 is plagal, Cluster 2 authentic/doo-wop, Cluster 4 tonic lovers, Cluster 5 descending fifths, and Cluster 6 combines modal patterns with common minor-key patterns (like ♭VI–♭VII–I). While these are straightforward and musically meaningful clusters, Cluster 3 is not. This is a cluster we could not make good sense of and have dubbed it "miscellaneous."
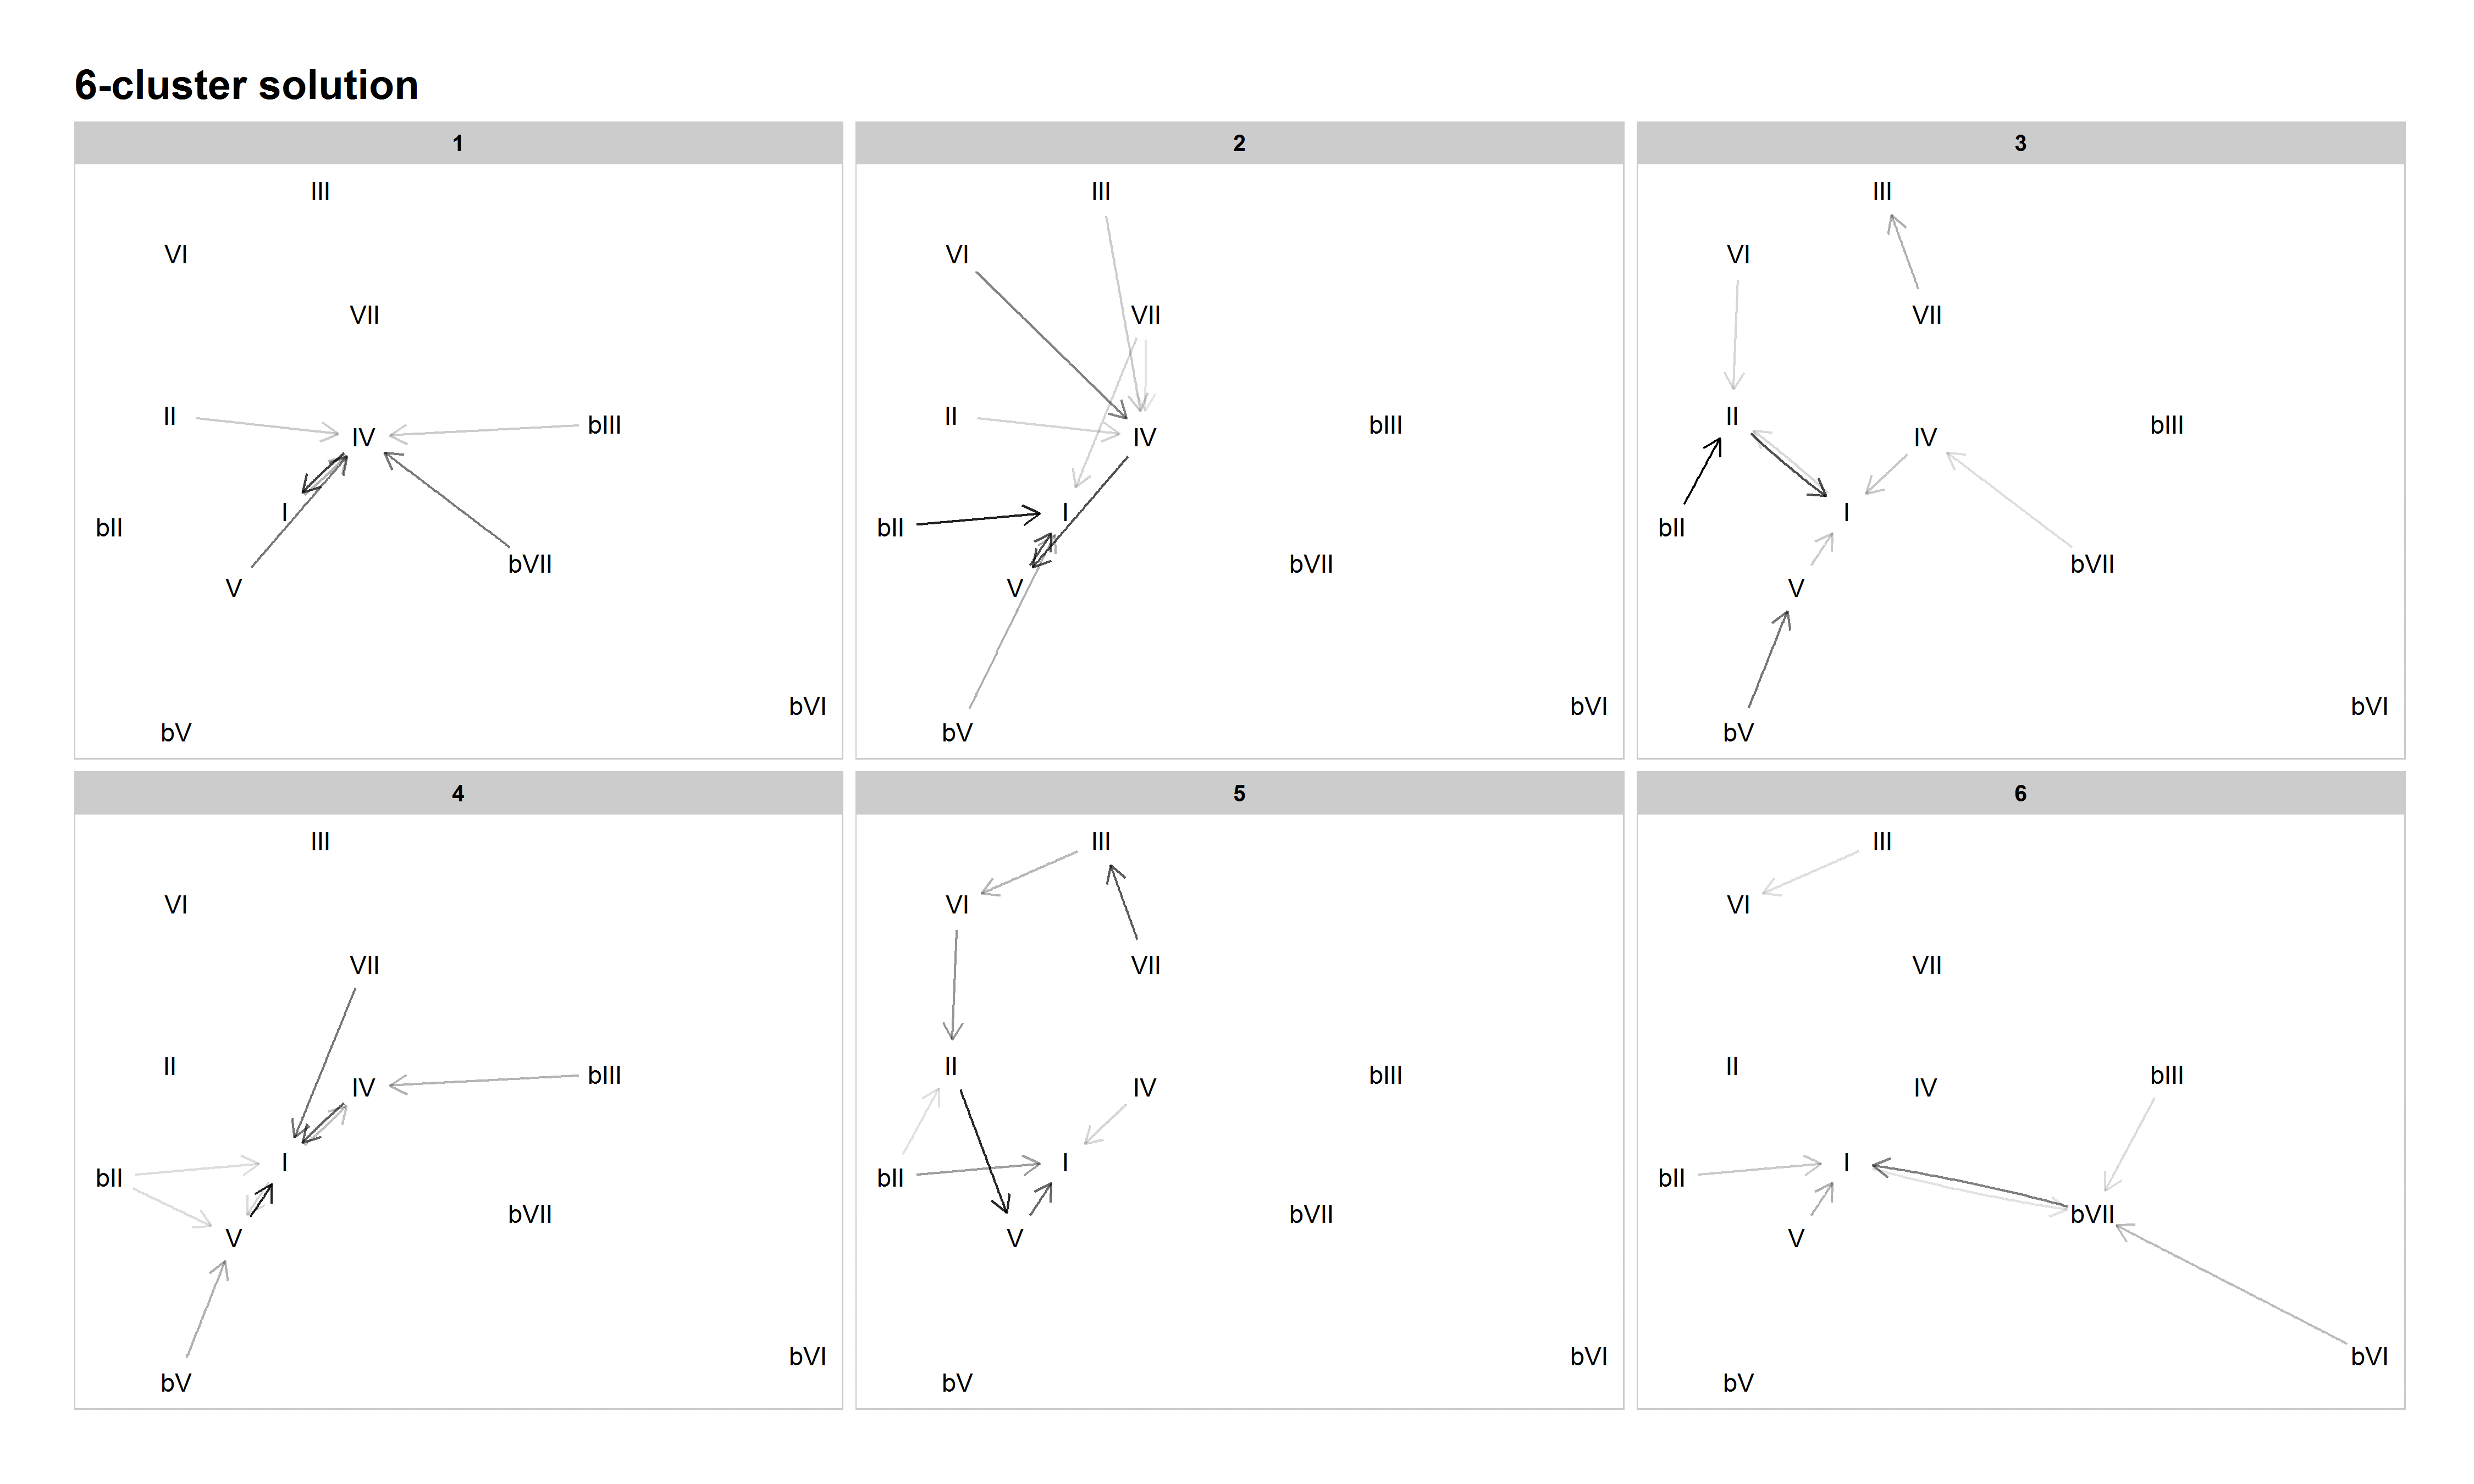
Figure 8: Network graph of harmonic progressions in the McGill Billboard dataset, 6-cluster solution. Darker lines denote higher-probability progressions. Only progressions with a probability of 0.35 or greater, given the starting chord, are included.
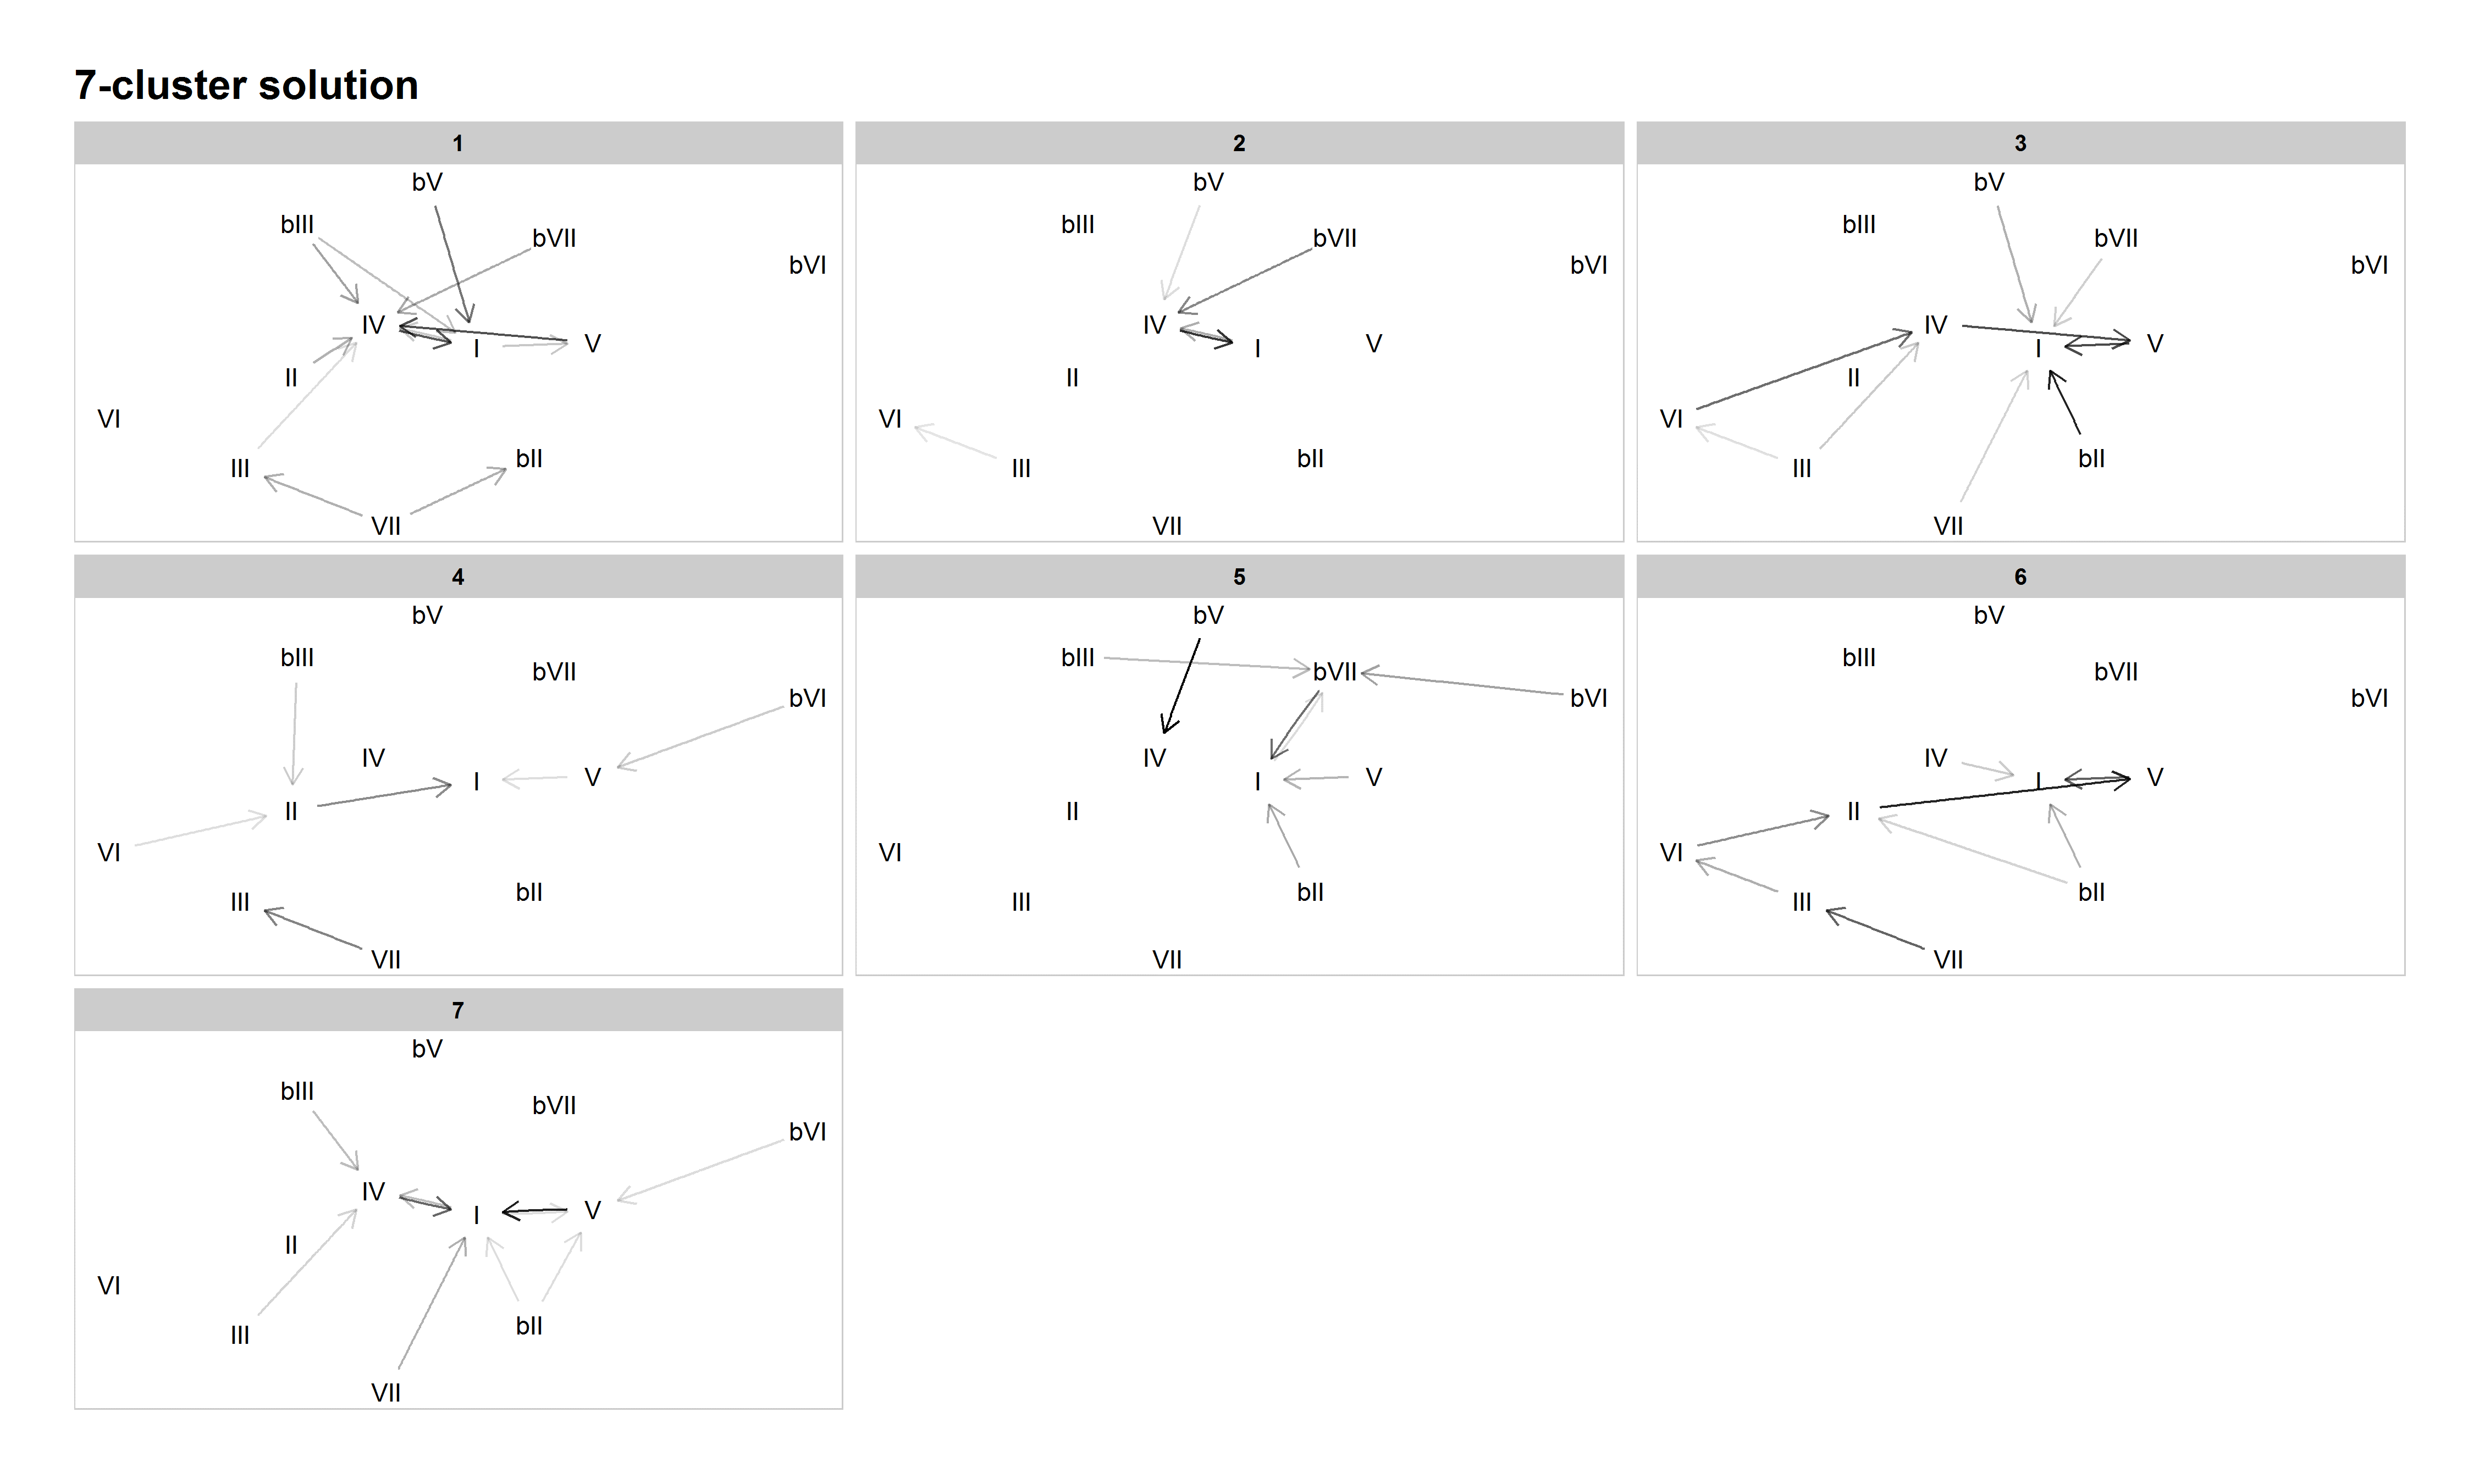
Figure 9: Network graph of harmonic progressions in the McGill Billboard dataset, 7-cluster solution. Darker lines denote higher-probability progressions. Only progressions with a probability of 0.35 or greater, given the starting chord, are included.
The 7-cluster solution generally represents a further refinement from the 6-cluster solution. In addition to preserving established patterns like authentic/doo-wop (Cluster 3) and descending-fifths (Cluster 6), it also preserves new patterns that emerged in the 5- and 6-cluster solutions, such as minor-key patterns (Cluster 5) and tonic lovers (Cluster 7). However, it also reintroduces the distinction between plagal categories (also present in Everett's tonal systems): blues-based, like "The Twist", in Cluster 1, and double-plagal, like "Country Road", in Cluster 2. Cluster 4 is another miscellaneous cluster.
Several familiar (sub-)grammars are present in the 8-cluster solution: tonic lovers in Cluster 1, double-plagal in Cluster 2, doo-wop in Cluster 5, minor in Cluster 6, plagal (or "subdominant lovers," given the tendency of almost every chord to progress to IV) in Cluster 7, and descending fifths in Cluster 8.
However, two new refinements occur in this solution. First, what we've been calling the "authentic/doo-wop" cluster splits into two. This is the first solution in which the doo-wop progression is exemplified not only by a tendency for VI to progress to IV, IV to V, and V to I, but also for I to progress to VI more often than any other chord. Thus, we see the clear emergence of a specific four-chord cycle in this cluster (Cluster 5). Other authentic progressions come in Cluster 4, which we have dubbed "X–V–I" since several common chords (namely, II, IV, and VI) all tend to progress to V, which overwhelmingly tends to progress to I. Examples include "Rocky Mountain High" by John Denver (1972), "Heartbreaker" by Pat Benetar (1980), "Every Little Thing She Does Is Magic" by The Police (1981), and "Motownphilly" by Boys II Men (1991). Like the split of the authentic cluster in the 3-cluster solution into descending-fifths and authentic/doo-wop in the 4-cluster solution, this further split into descending-fifths, X–V–I, and doo-wop in the 8-cluster solution holds into the higher-cardinality solutions.
Another new pattern to emerge is the descending-fifths-no-V pattern in Cluster 3. This pattern is generally characterized by a preference of VII to progress to III, III to VI, VI to II, and II directly to I. (Note that the III–VI does not meet the 0.35 probability threshold we set for the network graph below, but its probability of 0.32 is close, and VI is the most probable destination for progressions beginning with III in this cluster.) V is generally uncommon in this cluster. While few songs contain the complete VII–III–VI–II–I progression, significant fragments of it can be found in songs like "Eight Days a Week" by The Beatles (1965), "In-A-Gadda-Da-Vida" by Iron Butterfly (1968), "Play that Funky Music" by Wild Cherry (1976), and "Silent Lucidity" by Queensrÿche (1991). Though not as resilient as some other harmonic patterns, this descending-fifths-no-V pattern does recur as the defining characteristic of clusters in some of the higher-cardinality solutions. Like the tonic lovers category, its emergence in our model and its persistence across multiple cardinalities suggest that it deserves more analytical attention in the study of pop/rock harmony more generally.
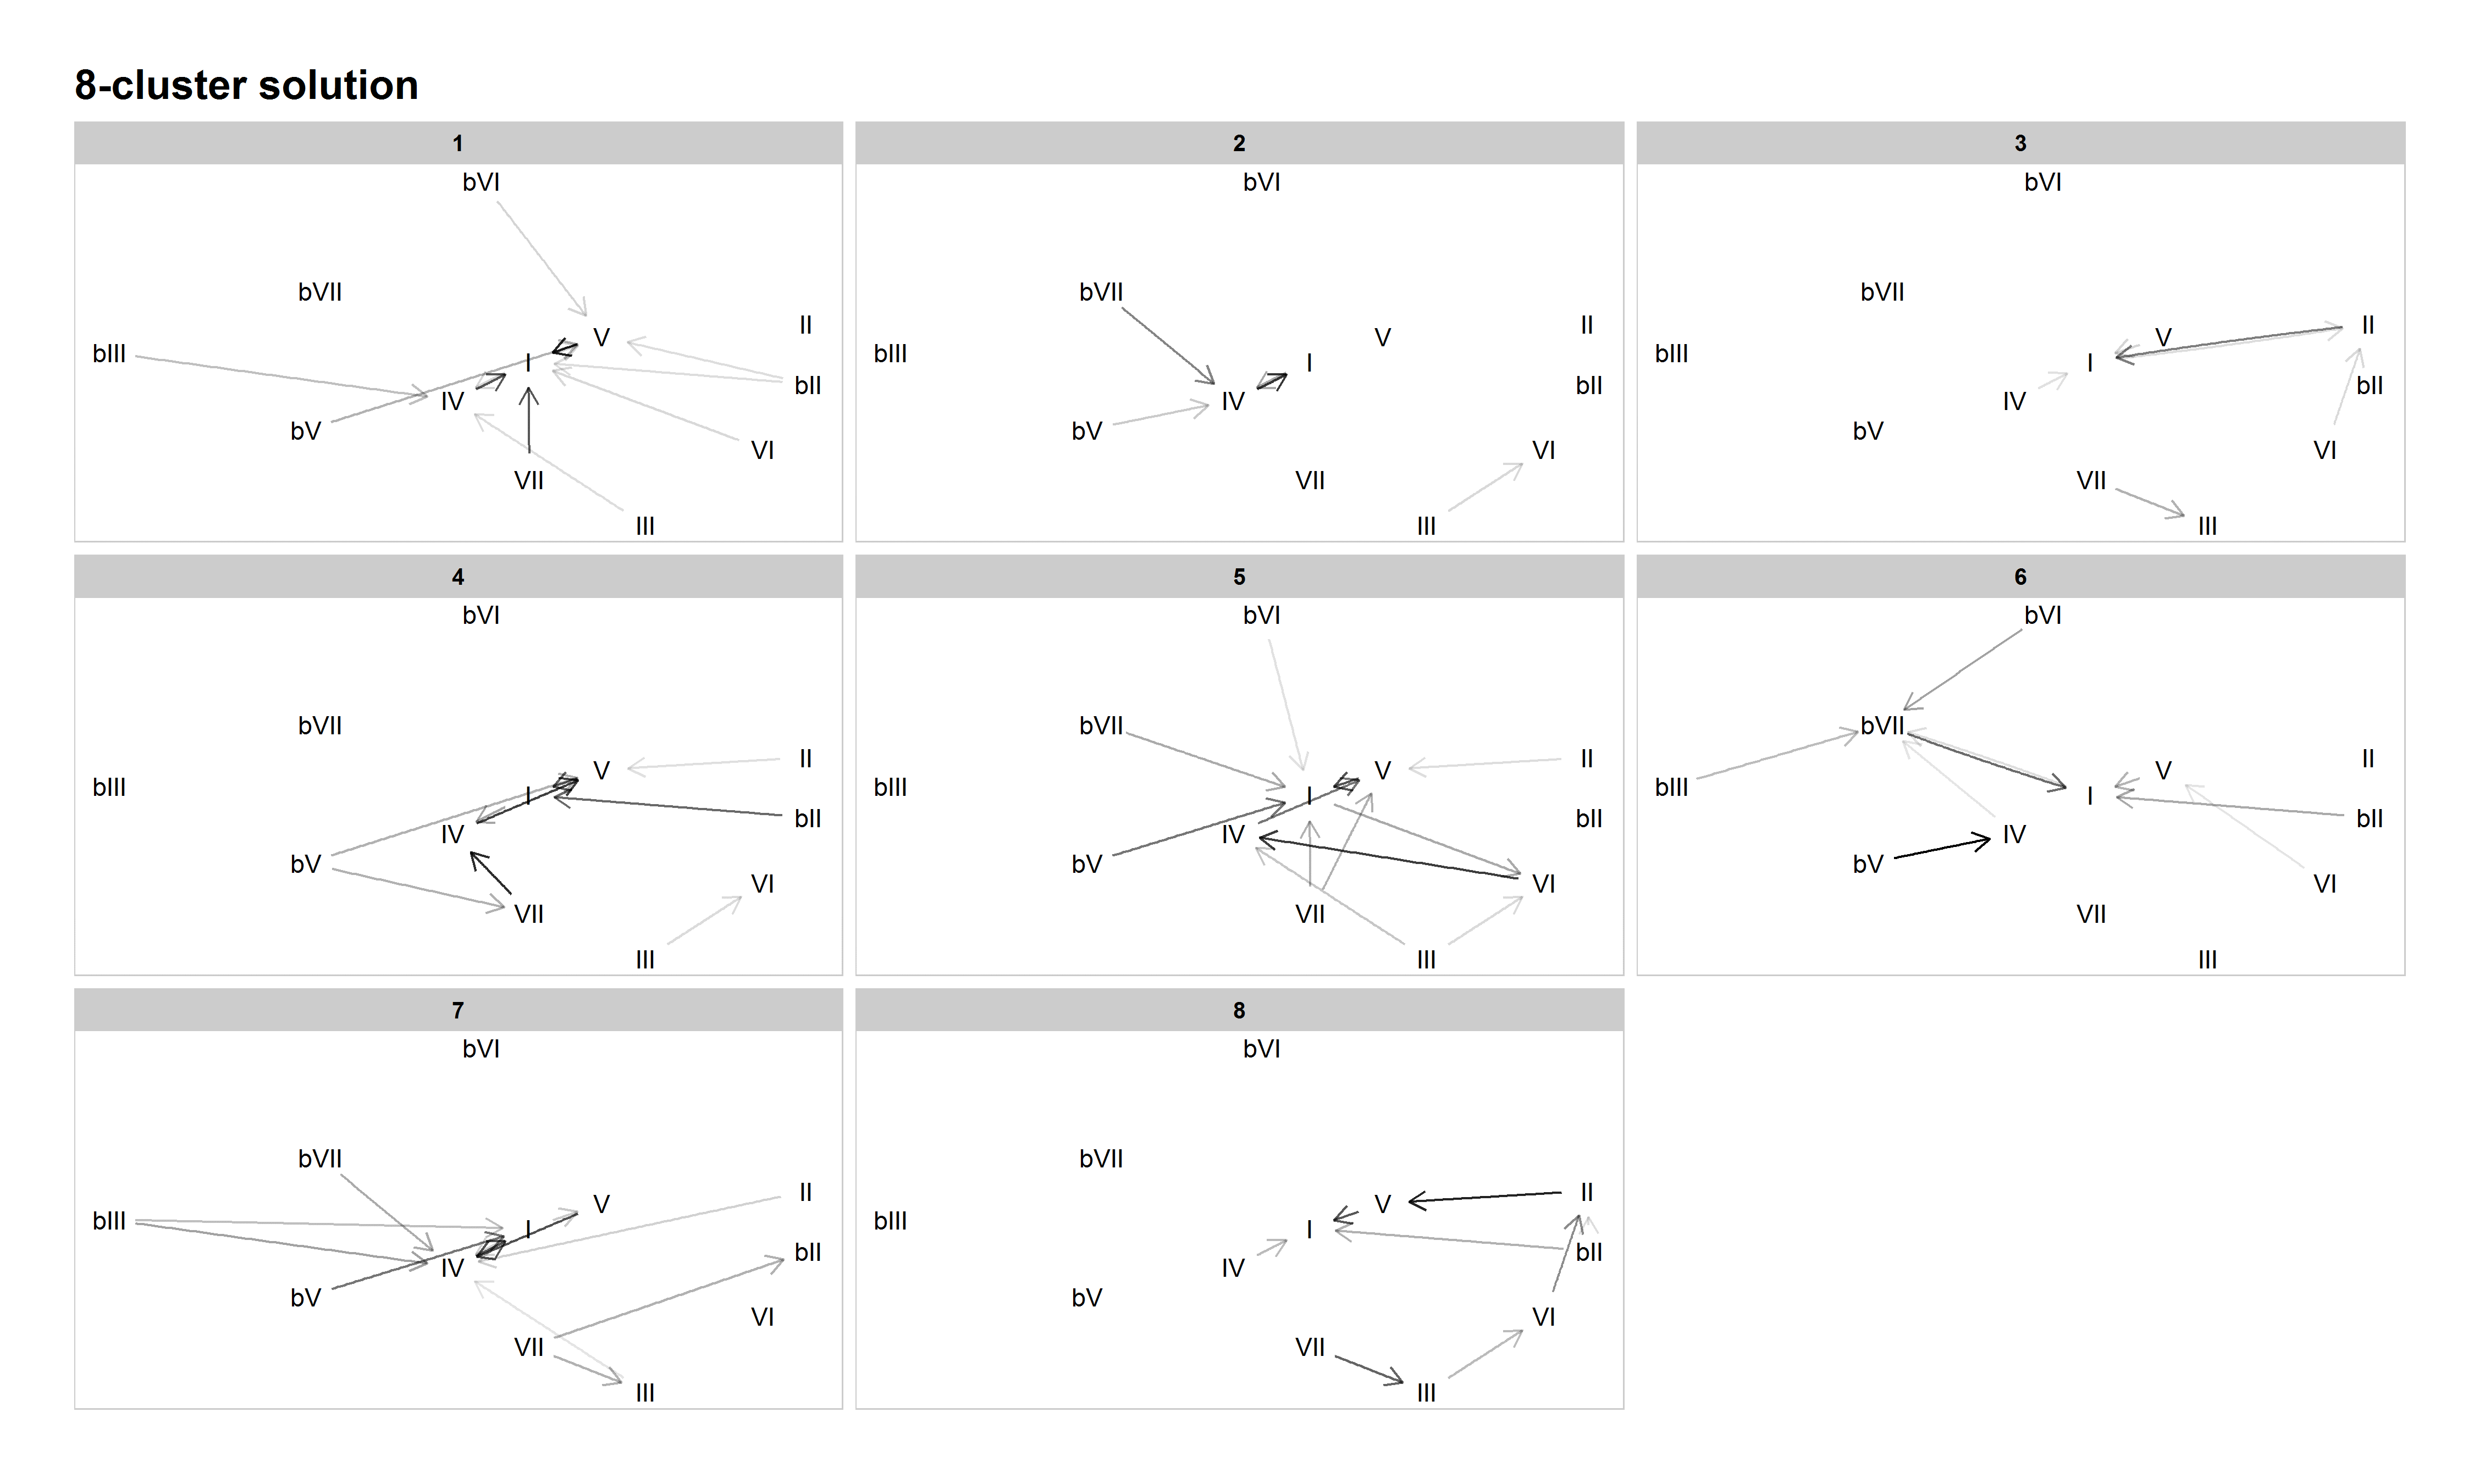
Figure 10: Network graph of harmonic progressions in the McGill Billboard dataset, 8-cluster solution. Darker lines denote higher-probability progressions. Only progressions with a probability of 0.35 or greater, given the starting chord, are included.
At the 9-cluster solution and beyond, parsing becomes overly fine, and sometimes with musically confusing results. For example, the 9-cluster solution mixes some well established categories present in lower-cardinality solutions, without adding any additional musical nuance. The 10-cluster solution divides the doo-wop cluster into two clusters, one dominated by I–VI–IV–V–I and one dominated by I–VI–II–V–I. This seems to us less like a distinction of stylistic grammar and more like a distinction of the expression of that grammar through a specific chord choice. Likewise, from the 11-cluster solution on, several clusters are defined by specific chord choices for tonic expansion (I–V–I, I–IV–I, I–II–I, etc.). This also seems more like expression and less like stylistic grammar.
For these reasons (and because of the sheer amount of data and figures), we will omit further discussion of these cardinalities from the article, but instead direct readers to our GitHub repository, where probability tables and other details can be found.
DISCUSSION AND INTERPRETATION
As stated above, our goal was to find a clustering solution that balances generalizability―the ability for a single model to represent many songs―with nuance―avoiding the "averaging out" of distinct practices into a single representation that is of limited musical and explanatory usefulness. Or put another way, the aim was to find a solution that provides a manageable model for listeners and songwriters that expresses useful distinctions without overfitting the data or overwhelming the listener or musician.
As hinted at above, the optimal number of clusters seems to be between five and eight. Notably, this is almost exactly where Everett's tonal systems lie in terms of numbers (six systems, with three divided into two subsystems each for a total of nine). Each of these solutions has musical merit.
It is not easy to choose a single optimal solution among these options (5–8 clusters). In one sense, the more general 5-cluster solution is ideal, as each stylistic grouping is markedly distinct. However, the divisions introduced in the 7-cluster and 8-cluster models provide additional helpful musical distinctions, without parsing too finely. If forced to decide, we would choose the 8-cluster solution, but with the very strong caveat that other desired emphases would lead to different decisions.
Overall, though, we find that the map that emerges from the exploration of clusters at a variety of different cardinalities (Figure 2) is the most instructive. Watching the categories emerge, conflate, disappear, and reappear as the number of clusters grows helps us understand pop/rock harmonic practices more than any single clustering solution. It also provides a loosely hierarchical model of pop/rock harmonic grammar that allows us to move through varying layers of precision in our analysis.
That map suggests that authentic/plagal is a helpful first distinction within pop/rock harmonic practice. It also shows how readily the descending-fifths schema emerges as an independent, resilient harmonic practice. It also shows the fraught relationship that minor-key harmony has with various major-key constructs, as predominately minor-key patterns move in and out of clusters dominated by authentic major progressions, plagal progressions, modal harmony, and its own cluster. Such a map is not a typical product of a cluster analysis, but in the case of pop/rock harmony and other somewhat subjective objects of study, such a map can provide both a helpful summary of various clustering options and a map of the hierarchy of categorical structures in the corpus that is similar to and easier to read and interpret than a hierarchical cluster of all the songs in the corpus. (Though, note that the hierarchical clustering solution pictured in Figure 11 also suggests five large clusters, with the largest readily dividing into two–four smaller clusters, giving a total of five–eight clusters.)
It also seems apparent that dividing the corpus by user-tagged genres does not lead to more nuanced stylistic groupings. Not only does the 15-cluster solution (hypothesized based on Schreiber's 15-genre list of genres based on user-provided labels) produce less useful results than the 5-, 6-, 7-, and 8-cluster solutions, but only some of the distinctions introduced as the cluster cardinality increases could be considered genre-related. For example, distinguishing blues-based plagal harmony from other harmonic practices tends to align well with a genre (or the influence of a genre on a songwriter), but the parsing of two types of doo-wop progressions (with II or with IV) does not. And despite its name, even the separating out of a doo-wop-based cluster is not necessarily genre-associated, as the I–VI–IV–V–I cycle is common in many other (sub-)genres.
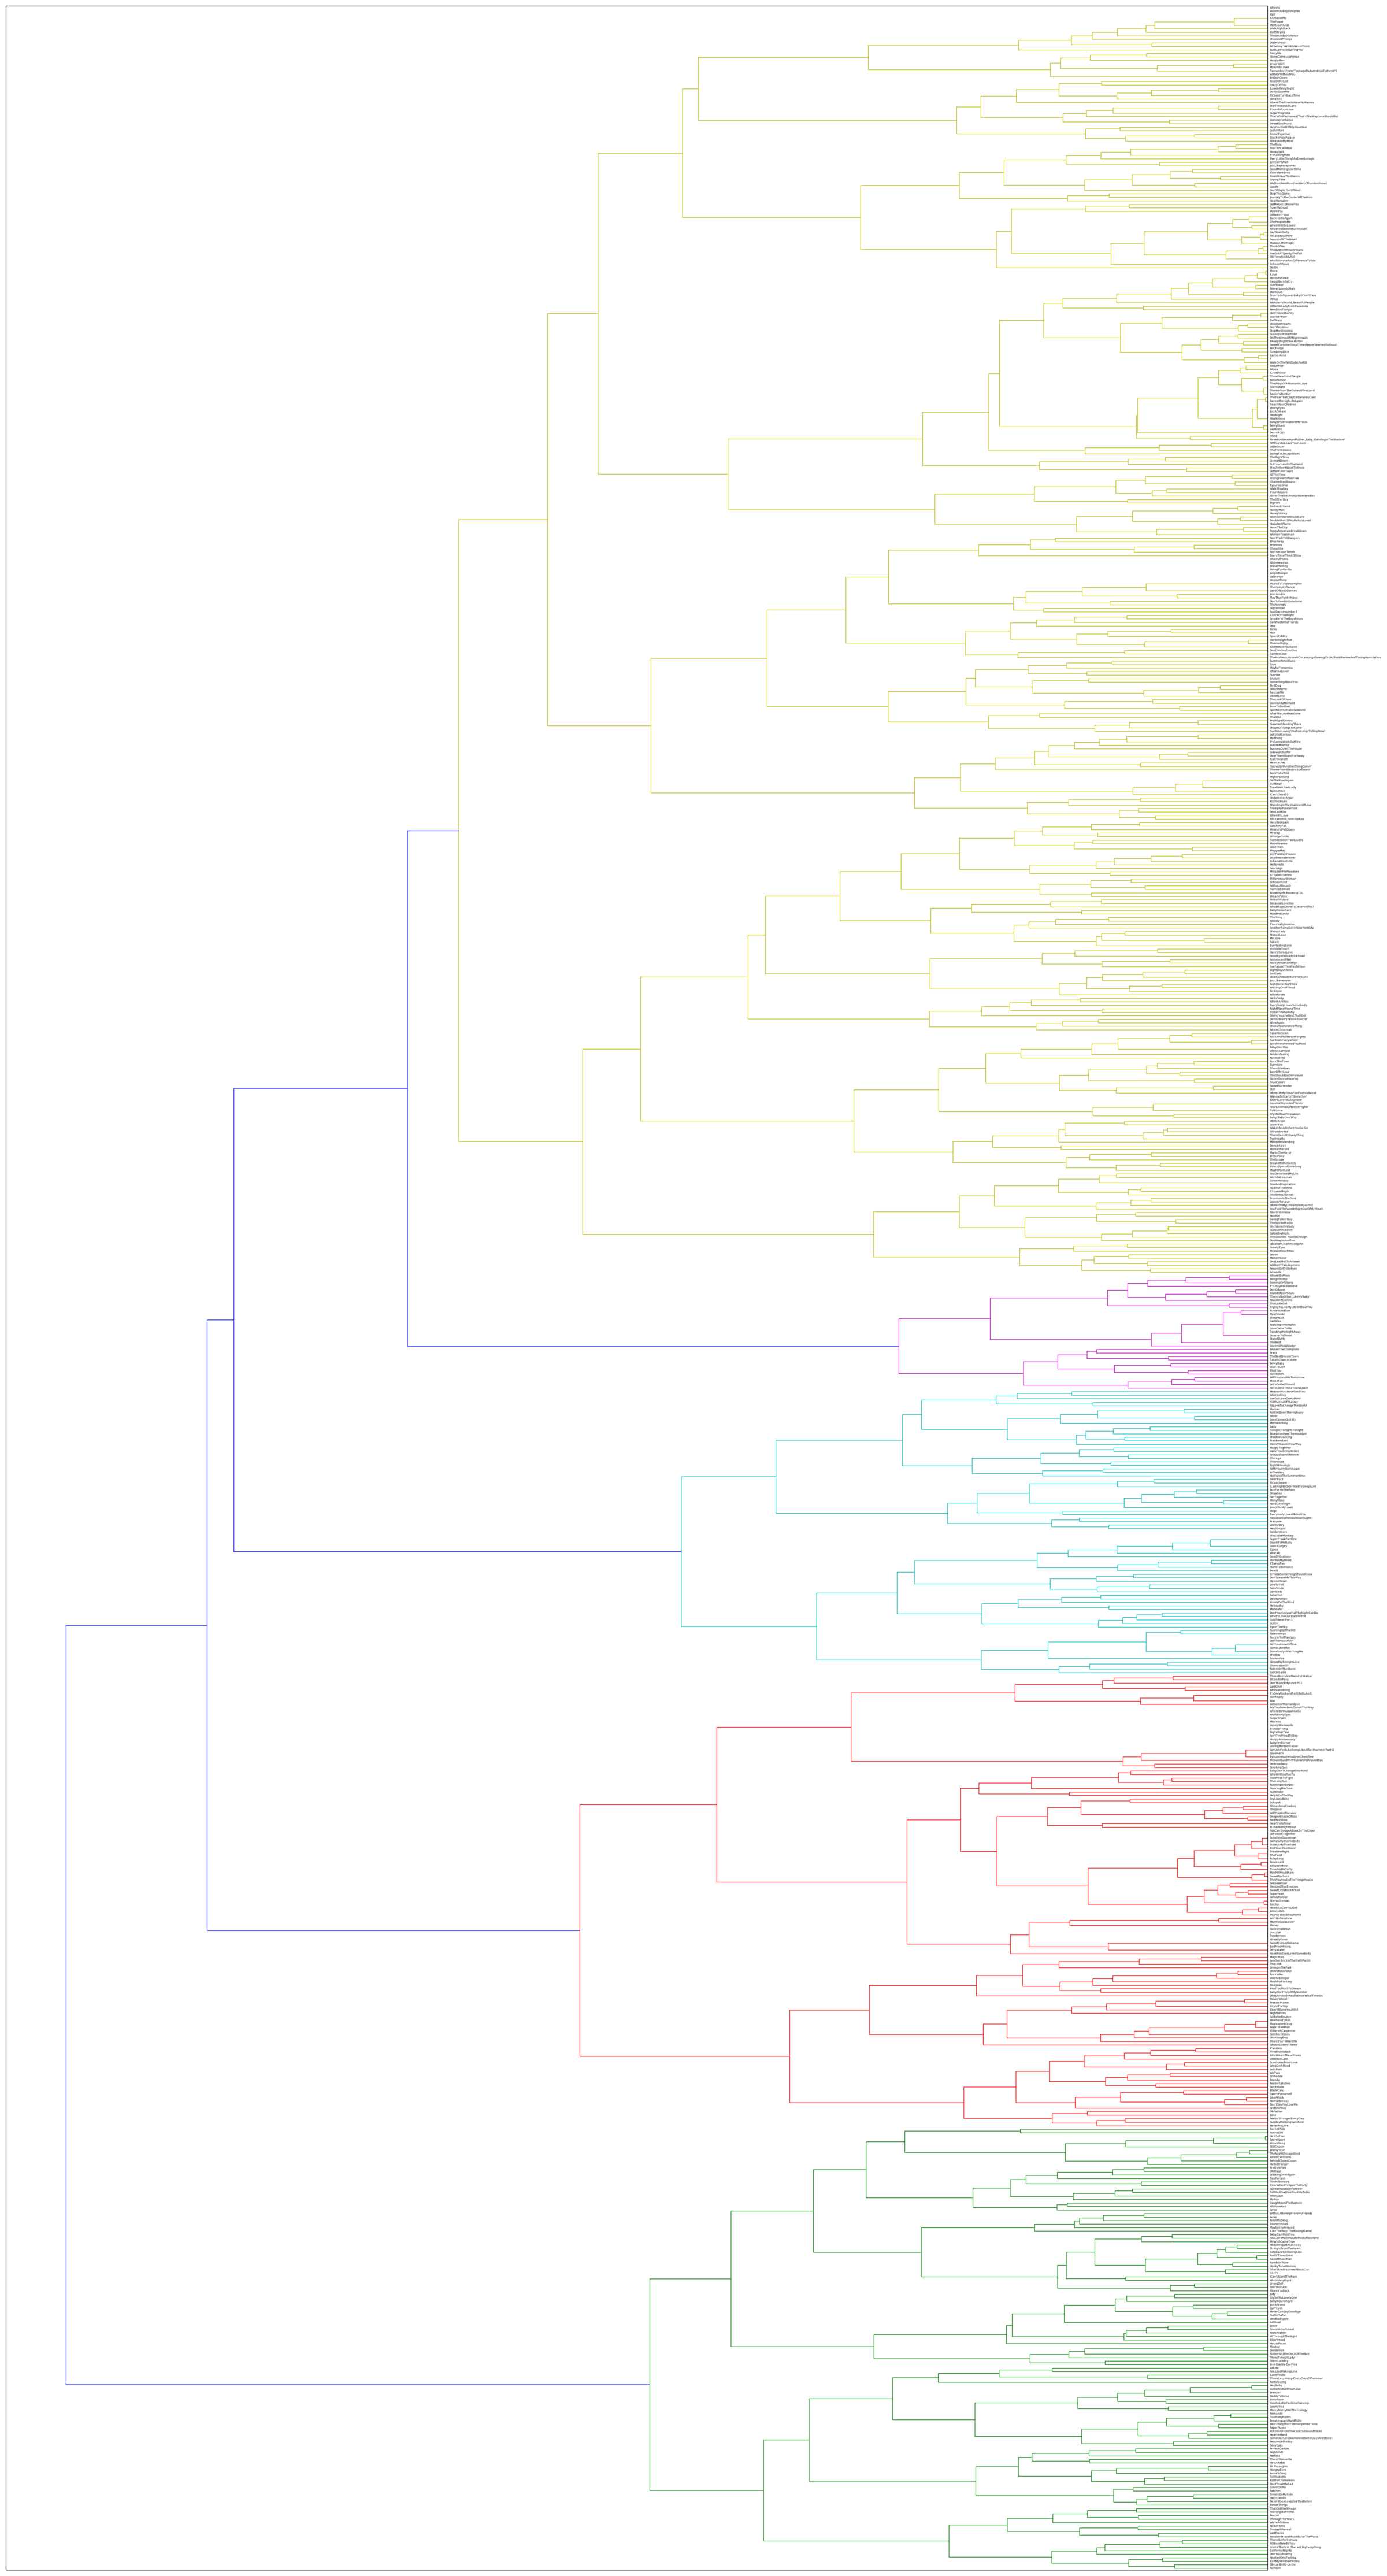
Figure 11. Ward hierarchical cluster analysis of the McGill Billboard corpus, showing five primary clusters, the largest of which (yellow) can easily be further divided into two or four clusters. See the GitHub repository for a high-resolution version of this figure, to zoom in on song titles and low-level clusters.
Empirically discerning the degree of the connection between style and genre in popular music is currently difficult because the datasets with the most robust genre tagging (such as Schreiber's Tagtraum dataset) do not have an accompanying robust harmonic analysis, and the datasets with the most robust harmonic analysis do not include robust genre tagging. There is also a very small intersection between BB and Tagtraum, rendering a merged dataset too small to draw statistical conclusions. We are hopeful that future work in computational musicology will lead to larger datasets with robust harmonic transcriptions which can be cross-referenced with the already large Tagtraum dataset. We are also hopeful that work in music information retrieval will soon reach a high enough harmonic accuracy rate to produce harmonic transcriptions reliable enough to categorize songs by (sub-)grammar, even if some of the harmonic nuances are missing. Such a milestone would increase the size of datasets available for cross-referencing stylistic (i.e., structural) traits with the more socially generated traits of genres.
CONCLUSION
In this study, we set out to perform a cluster analysis of harmonic structures in the McGill Billboard dataset. We subjected the harmonic content (specifically chord-to-chord transitions, or bigrams) of the 730 songs in the McGill Billboard dataset to a K-means cluster analysis and determined that as we progress from a whole-corpus analysis through an increasing number of clusters, terminating with eight clusters, we generally gain nuance in our understanding of the various harmonic practices, styles, and sub-styles that make up the McGill Billboard dataset.
We conclude, then, that there are likely multiple harmonic styles present in the McGill Billboard dataset, and that K-means cluster analysis is a helpful (and not particularly difficult) machine-learning tool for empirical studies of musical harmony. And though further work in corpus creation and/or music information retrieval will be required to explore it more fully, we also remain skeptical of empirical musicological work and music-recommendation engines that collapse the more socially determined concept of genre and the primarily structurally defined concept of style into a single mode of musical distinctions.
ACKNOWLEDGEMENTS
We would like to acknowledge the contributions of Erik Kierstead, Andrew Mahan, Christopher Rooney, and J.R. Souders, as well as several other students who wished their contributions to remain anonymous. Their work on this project was indispensable. Kris Shaffer would also like to thank John Davis at the CU–Boulder College of Music for his support in the creation of the course that produced this research, as well as Jesse Stommel and Jeff McClurken at the University of Mary Washington for providing time and resources needed to finish the project. This article was copyedited by Scott Bannister and layout edited by Diana Kayser.
NOTES
-
Correspondence can be addressed to: Kris Shaffer, kris.shaffer@protonmail.ch.
Return to Text
REFERENCES
- Bertin-Mahieux, T., Ellis, D., Whitman, B., & Lamere, P. (2011). The Million Song Dataset. Proceedings of the 12th International Society for Music Information Retrieval Conference.
- Burgoyne, J. A. (2011). Stochastic Processes & Database-Driven Musicology. Unpublished doctoral dissertation, McGill University, Canada.
- De Clercq, T., & Temperley, D. (2011). A corpus analysis of rock harmony. Popular Music, 30 (1), 47–70. https://doi.org/10.1017/S026114301000067X
- Everett, W. (2004). Making Sense of Rock's Tonal Systems. Music Theory Online, 10 (4). Retrieved from http://www.mtosmt.org/issues/mto.04.10.4/mto.04.10.4.w_everett.html.
- Flexer, A., Gouyon, F., Dixon, S., & Widmer, G. (2006). Probabilistic Combination of Features for Music Classification. Proceedings of the 7th International Society for Music Information Retrieval Conference.
- Manning, C. D., Raghavan, P., Schütze, H. (2008). Introduction to Information Retrieval. Cambridge University Press. https://doi.org/10.1017/CBO9780511809071
- Moore, A. (2001). Categorical Conventions in Music Discourse: Style and Genre. Music and Letters 82 (3), 432–42. https://doi.org/10.1093/ml/82.3.432
- Prockup, M., Ehmann, A., Gouyon, F., Schmidt, E., Celma, O., Kim, Y. E. (2015). Modeling genre with the music genome project: Comparing human-labeled attributes and audio features. Proceedings of the 16th International Society for Music Information Retrieval Conference, 31–37.
- Schreiber, H. (2015). Improving Genre Annotations for the Million Song Dataset. Proceedings of the 16th International Society for Music Information Retrieval Conference, 241–47.
- Shaffer, K., Hughes, B., & Moseley, B. (2016). "The 'Puff' Progression." In Open Music Theory. Retrieved from http://openmusictheory.com/popRockHarmony-puff.html.
