
THE storytelling metaphor is ubiquitous in jazz parlance (Berliner, 1994; Bjersted, 2014; Iyer, 2004). However, in a non-denotative language such as music, storytelling is hardly possible in a literal sense. As Bjersted puts it: "'Metaphorically speaking', music can be narrative; 'strictly speaking', it cannot." (2014, p. 93). Berliner (1994, p. 262–267) reports a vast array of statements on the topic of storytelling taken from interviews with eminent jazz musicians from different generations and stylistic backgrounds. At its very core, it seems, "telling a good story" is mostly an aesthetic judgment about an improvisation (or about an improviser as a "good storyteller"). A necessary precondition for a "storyteller" in jazz is, of course, mastery of the idiom of jazz improvisation itself. This comprises, amongst others, the capability to manage the changes and to follow the form, to keep the tempo and to "swing", to listen to and to react to bandmates, and to command an adequate level of instrumental technique. If a musician has not mastered these basics, he or she will rarely be viewed as being able to tell any story at all. According to the musicians consulted by Berliner, the aesthetical implications of storytelling comprise (at least) three different components: (a) personal involvement, (b) the variety and balance of the improvisational tools employed in a solo, and (c) an overall dramaturgy. All three aspects serve furthermore the common purpose of keeping up the listener's interest in an improvisation. A balanced and varied use of tools can contribute to this in different ways. Firstly, improvising with personal involvement—for example, by showing emotions or commitment while performing—can make a solo interesting and enjoyable for an audience. Display of emotional attachment is often interpreted as having "something to tell" in an emphatic sense, i.e., drawing from a rich personal emotional experience and a mature personality, which in turn deserves respect and attention. Moreover, having a unique, recognizable instrumental sound 2 or using personal peculiarities such as signature licks can also strengthen the overall aesthetic impression of a solo. Secondly, using a large variety of improvisational elements will trigger surprise and can subvert expectations, thus creating and sustaining interest as well as conveying and inducing emotions (Huron, 2006; Meyer, 1956). At the same time, there must be a certain logic, or, more precisely, coherence to the stream of musical events, since a sequence of permanently varying and contrasting elements will rather just frustrate listeners' attention. Playing with listeners' expectations, but not completely eliminating these by too much variability, as well as finding the right balance between coherence and contrast will be more satisfying for listeners. Finally, a carefully crafted overall dramaturgy in the form of tension curves can also contribute to the coherence and internal logic of a solo, while at the same time involving listeners by means of empathy, e.g., inducing arousal or relaxation. Generally, all three aspects are interrelated to some degree, and a solo will more likely be judged as being aesthetically gratifying if it serves all three dimensions in an integrated way.
This is a very sketchy and general description of possible musical foundations of the "storytelling" metaphor in jazz improvisation, reflecting mostly the understanding of the members of the jazz community. There are, however, a lot of follow-up research questions, mostly pertaining to the analytical details of the aforementioned core elements. In particular, it is rather unclear how these strategies can be investigated and defined in a scientifically rigorous way, to what extent these storytelling elements are actually present in recorded jazz solos of the masters, and how they vary with respect to performer, style, tempo, tonality and other parameters.
Since this paper is thought of as a first explorative investigation, we focus only on the third aspect, overall dramaturgy, which seems to be the most accessible, while touching upon the two other aspects as well.
Dramaturgy
Aristotle's dramatic model, as formulated in his Poetics, was one of the first attempts to identify recurrent structures in stories of all sorts. His theory became widespread in various re-formulations and variations, e.g., Freytag's Pyramid for stage dramas (Freytag, 1863/2004) or Syd Fields' (1979) three-act structure for movie scripts, and even more and more normative over time (at least for Western mainstream culture). Aristotle's model divides a story in a beginning, a middle part, and an end. The beginning contains the exposition, i.e., introduces the setting (time and place) and the main protagonists of the story. Typically after an inciting incident, conflicts of various sorts arise and are built up along several turning points to a climax. After the climax is reached, conflicts are either slowly or quickly resolved, so that the story ends with either a positive (comedy), a negative (tragedy) or a mixed outcome (tragicomedy). The tension curve—or dramaturgy, as we will refer to it in the following—is thus shaped like an arch, a convex structure, moving from low to high tension and back to low tension.
Unfortunately, tension is a complex concept and its ontological location is not entirely clear, i.e., whether it can be located in the artistic object itself or in perception or in both. Most probably, tension can be seen as a certain psychological state induced in a perceiver/listener by certain elements in the dramatic action. Tension is related to expectations in a very general sense ("What happens next?") with the special case of unpleasant states, which generate desire (expectations) for relief. In the case of music, several options to generate expectations and tensions are available to a composer or an improviser, e.g., harmonic tension in Western tonal music by employing a dominant-seventh chord. One could even conceive of music as a permanent flow of expectations/tensions and releases, often at several hierarchical levels at once. However, identifying these tension-generating elements in jazz solos is not an easy task. Therefore, we will restrict ourselves mostly to proxy measures in form of related, more readily measurable concepts, such as intensity. This can be justified by the assumption that tension is partly (but not fully) generated via modal analogies and empathic coupling. Empathic coupling can, for example, occur if the perceived intensity curves are interpreted as the result of emotional states in the performer and transferred to the performance. This does not demand that these emotional states are de facto present in the performer. The sheer possibility of this interpretation is sufficient for the coupling to take place (just like an actor can project emotions without actually experiencing them). However, a high degree of displayed intensity in a performance can also be interpreted as heightened activity in conflict situations, thereby indirectly referring to and inducing tension. Right now, it cannot be decided which of these hypothetical mechanisms are actually taking place in jazz improvisation. However, all options result in the same hypothesis: Jazz solos possess distinct curves of musical parameters that are commonly associated with arousal, tension and intensity and might follow certain trends of dramatic development as, for example, arched or concave curves.
Aim and Limitations
In order to explore this hypothesis, we decided for a quantitative statistical approach, which has only recently become feasible due to the availability of a large jazz solo database (the Weimar Jazz Database; Frieler, Abeßer, Zaddach, & Pfleiderer, 2013). We designed and conducted three studies: (1) An investigation of global trends of pitch and loudness, using note-wise values, (2) an investigation of global trends of selected features related to tension, variability and intensity based on phrase-wise values, and (3) an investigation of the distribution of improvisational ideas with respect to their relative position in a solo.
The Weimar Jazz Database contains only scarce information of the backing group performance (except for beat tracks and annotated chords). This means that interactions between the soloist and the band, which might have an impact on the dramaturgy, fall out of the scope of this paper. Likewise, the overall dramaturgy of the recordings, i.e., the sequence of theme parts, interludes and solos, is not in reach of this study.
Study 1: Pitch and Loudness Curves
Pitch and loudness are, besides rhythm and timbre, basic properties of musical tones. Both of them are very suitable candidates to display intensity. Probably, an increase in loudness is the simplest and most evident modal analogy for emotional arousal or heightened activity. An absolute high level of loudness can have direct physiological impact (Epstein, 2011), but for the purpose of the present study, only relative changes in loudness are of interest. Pitch on the other hand is not that simply related to arousal. Although low and high pitches can elicit very different associations, the absolute pitch height is not necessarily connected to intensity. But, as for loudness, the relative change of pitch height might be an indicator for arousal. This hypothesis stems from the observation that the upper limit of the pitch register of one's voice is commonly associated with states of high arousal such as anger or fear. In very high regions, timbre quality can also become unstable, likewise associated with high expressivity (e.g., screaming, crying, yelling, or the crackling voices of persons in an agitated emotional state) 3.
Data
We used 299 monophonic solos by 70 musicians. The solos are taken from the Weimar Jazz Database and cover a wide range of styles and performers (see Table A.1 in the Appendix for list of performers). The Weimar Jazz Database contains high-quality jazz solo transcriptions with manual annotations of chords, beat and meter, phrases, form sections, and articulation. The solos were transcribed and annotated by jazz and musicology students and were carefully cross-checked to ensure their high quality. The solos are equipped with rich metadata, such as instrument, style (TRADITIONAL, SWING, BEBOP, HARDBOP, COOL, POSTBOP, AND FREE), rhythm feel (TWO-BEAT, SWING, LATIN, FUNK, MIXED), tonality type (FUNCTIONAL, BLUES, MODAL, FREE, and COLOR, i.e. a mixture of modal and functional harmony) and tempo class (SLOW, MEDIUM SLOW, MEDIUM, MEDIUM UP, and UP).
The median number of choruses is three; the maximum number was a staggering 31 choruses (John Coltrane's 1961 solo over Impressions). One hundred eleven solos have one chorus, 83 two choruses, 36 three choruses, 21 four choruses, and 48 five or more choruses. The total number of tones is 128,078, with a median number of tones per solo of 349 (range: 49–4955 tones, SD = 380.6).
Method
Onset, pitch, and loudness information for the tone events in the solos were collected. The pitch values of the transcriptions were coded with MIDI pitch numbers, whereas the loudness values were extracted from the audio using score-informed source separation (Abeßer, Cano, Frieler & Pfleiderer, 2014). The algorithm produces a transformed version of raw tone intensities using a rather simple psycho-acoustical model. We will use the term "loudness" (measured in dB), even though the measured loudness cannot be identified with actually perceived loudness. The median of all loudness values for a given tone was used as a reliable estimator. However, due to very short tones annotated in the Weimar Jazz Database and to inevitable errors generated by the source separation algorithm, there are occasional clear outliers in the loudness values which were filtered out by using the outlier criterion of >1.5 times the interquartile distance, as is customary for boxplots. For one solo (John Coltrane's 14 minute solo on "Impressions" from 1961) no loudness values could be obtained due to its extraordinary length. The onsets of tones (in seconds) are directly related to the transcribed and annotated solo cut of the audio recording. To facilitate comparison, we normalized onsets in regard to overall solo lengths by scaling them to the interval [0, 1]; this has no bearing on the following fitting procedure, which is scale-free.
We fitted quadratic polynomials and collected p-values and adjusted R2-values for each solo 4. Quadratic polynomials were chosen because they are easy to interpret while being able to capture linear trends as well as arch-like shapes. We initially experimented with other options, i.e., higher and dynamic degrees of polynomials, but no clear-cut criterion for choosing the polynomial order emerged. Higher order polynomials very often provide better fits, however, there is a danger of overfitting. Since we are mainly interested in global trends, we settled on quadratic polynomials as the most simple, but still informative option.
Furthermore, we measured the relative position of the minimum/maximum of the quadratic polynomial (if present) and the overall linear trend as the difference between the first and last predicted pitch/loudness value. Finally, we classified the fits into five categories: non-significant, horizontal, ascending, descending, concave and convex. Fits that did not reach a fixed significance level of α = .01 were considered non-significant. Fits reaching significance but with R2-values less than a fixed threshold of .1 were classified as horizontal. Actually, "non-significant" and "horizontal" can be grouped into one class ("flat"), since in a non-significant regression the mean of values is already the optimal fit. For both categories, values are basically oscillating around the mean. All other significant fits with R2 > .1 were classified according to the presence of a minimum or a maximum as "non-flat". If no extremum was present, the fits were labelled "ascending" or "descending" dependent on their linear trend. If a maximum (minimum) was present, the fit was classified as convex (concave).
Results
Loudness
Most of the solos did not produce a significant fit (53%), while 36.9% showed only a weak trend and were thus classified as "horizontal" (cf. Table 1). All in all, 89.9% of solos did not show a global quadratic trend. The remaining 31 solos (10.1%) exhibited a more or less clear tendency, most of them (15) with a convex shape (cf. Figure 1). Eight solos were overall ascending, two were descending, and five had a concave contour. As to multiple testing: For a significance level of α = .01, one would expect about three significant fits by chance alone, but we found 140, showing that these results are not random. For the solos with significant fits, about 67.8% had an overall ascending linear trend, similarly for the non-flat fits (67.7%).
We tested for differences between flat (non-significant or horizontal) and non-flat (all other shapes) trends for performer, style, rhythmic feel, tonality type, tempo class, and instrument using Χ2 tests, but no significant difference could be found. Likewise, no significant differences between solos with different numbers of choruses could be observed.
Pitch
Pitch curves produced more significant trends (cf. Table 1). 42.1% of quadratic fits did not reach significance, whereas 39.1% of all solos fell into the "horizontal" category, which makes a combined 81.2% of "flat" solos without a trend. However, 56 or 18.8% of all solos exhibited a clear contour. The largest class was again convex (38 solos, 12.7% of all solos), followed by concave (9), ascending (6), and descending (3). For the solos with significant fits, 62.5 % had an overall ascending and 37.5% an overall descending linear trend (cf. Figure 2).
As for the loudness curves, we tested for differences between flat and non-flat pitch trends in regard to performer, style, rhythmic feel, tonality type, tempo class, and instrument using Χ2 tests. Most tests became not significant except for performer (Χ2(69) = 100.92, p = 0.007, Cramer's V = .581) and rhythmic feel (Χ2(5) = 16.099, p = 0.007, Cramer's V = .232), where Latin, Funk, and Mixed rhythm feels had more non-flat trends. Tempo class was weakly significant (Χ2(4) = 9.3, p = 0.054, Cramer's V = .174) with Medium Slow and Medium Up showing more non-flat trends. However, these results have to be taken with care, since most performers contributed more than one solo, and cell sizes are sometimes very small and overall unevenly occupied. Although, a quick cross-check using bootstrap samples over performers (drawing one solo per performer at a time and conducting the Χ2 test on this sample) indicated that the tests for rhythmic feel and tempo class actually might hold up.
| Trend | Loudness | Pitch | ||
|---|---|---|---|---|
| Count | % | Count | % | |
| Non-significant | 158 | 53.0 | 126 | 42.1 |
| Horizontal | 110 | 36.9 | 117 | 39.1 |
| Ascending | 8 | 2.7 | 6 | 2.0 |
| Descending | 2 | 0.7 | 3 | 1.0 |
| Convex | 15 | 5.0 | 38 | 12.7 |
| Concave | 5 | 1.7 | 9 | 3.0 |
| Total | 298 | 100 | 299 | 100 |
Discussion
Summing up both results, 13 solos have a non-flat significant trend for both loudness and pitch curves. Of these 13 solos, eight have the same pitch and loudness contours, seven with convex and one with ascending shapes. Among these, six solos came from three performers with two solos each (Louis Armstrong, Art Pepper, and Sonny Rollins 5). Furthermore, as already observed in Abeßer et al. (2014), in regard to a subset of the present data, loudness and pitch are generally correlated (Pearson's r(123,121) = .21, p < .001), even though there are large differences amongst instruments (the highest correlation is for cornet with r(2,259) = .48, p < .001, and the lowest for soprano sax with r(7,019) = .05, p < .001). Probably, this is due to certain constraints of instruments' techniques. In the latter case, joint pitch and loudness trends might stem from one source alone.
Study 2: Time Course of Selected Features
In the second study, we used a complementary approach by selecting a set of (aggregating) features for solo phrases. We chose features which could be interpreted in terms of overall intensity, tension, and variability.
Data
We used the same 299 monophonic solos as in Study 1, along with phrase information annotated by our transcribers. The total number of phrases is 7,827; the median number of phrases within a solo is 21 (range: 4–465 phrases, SD = 30.8).
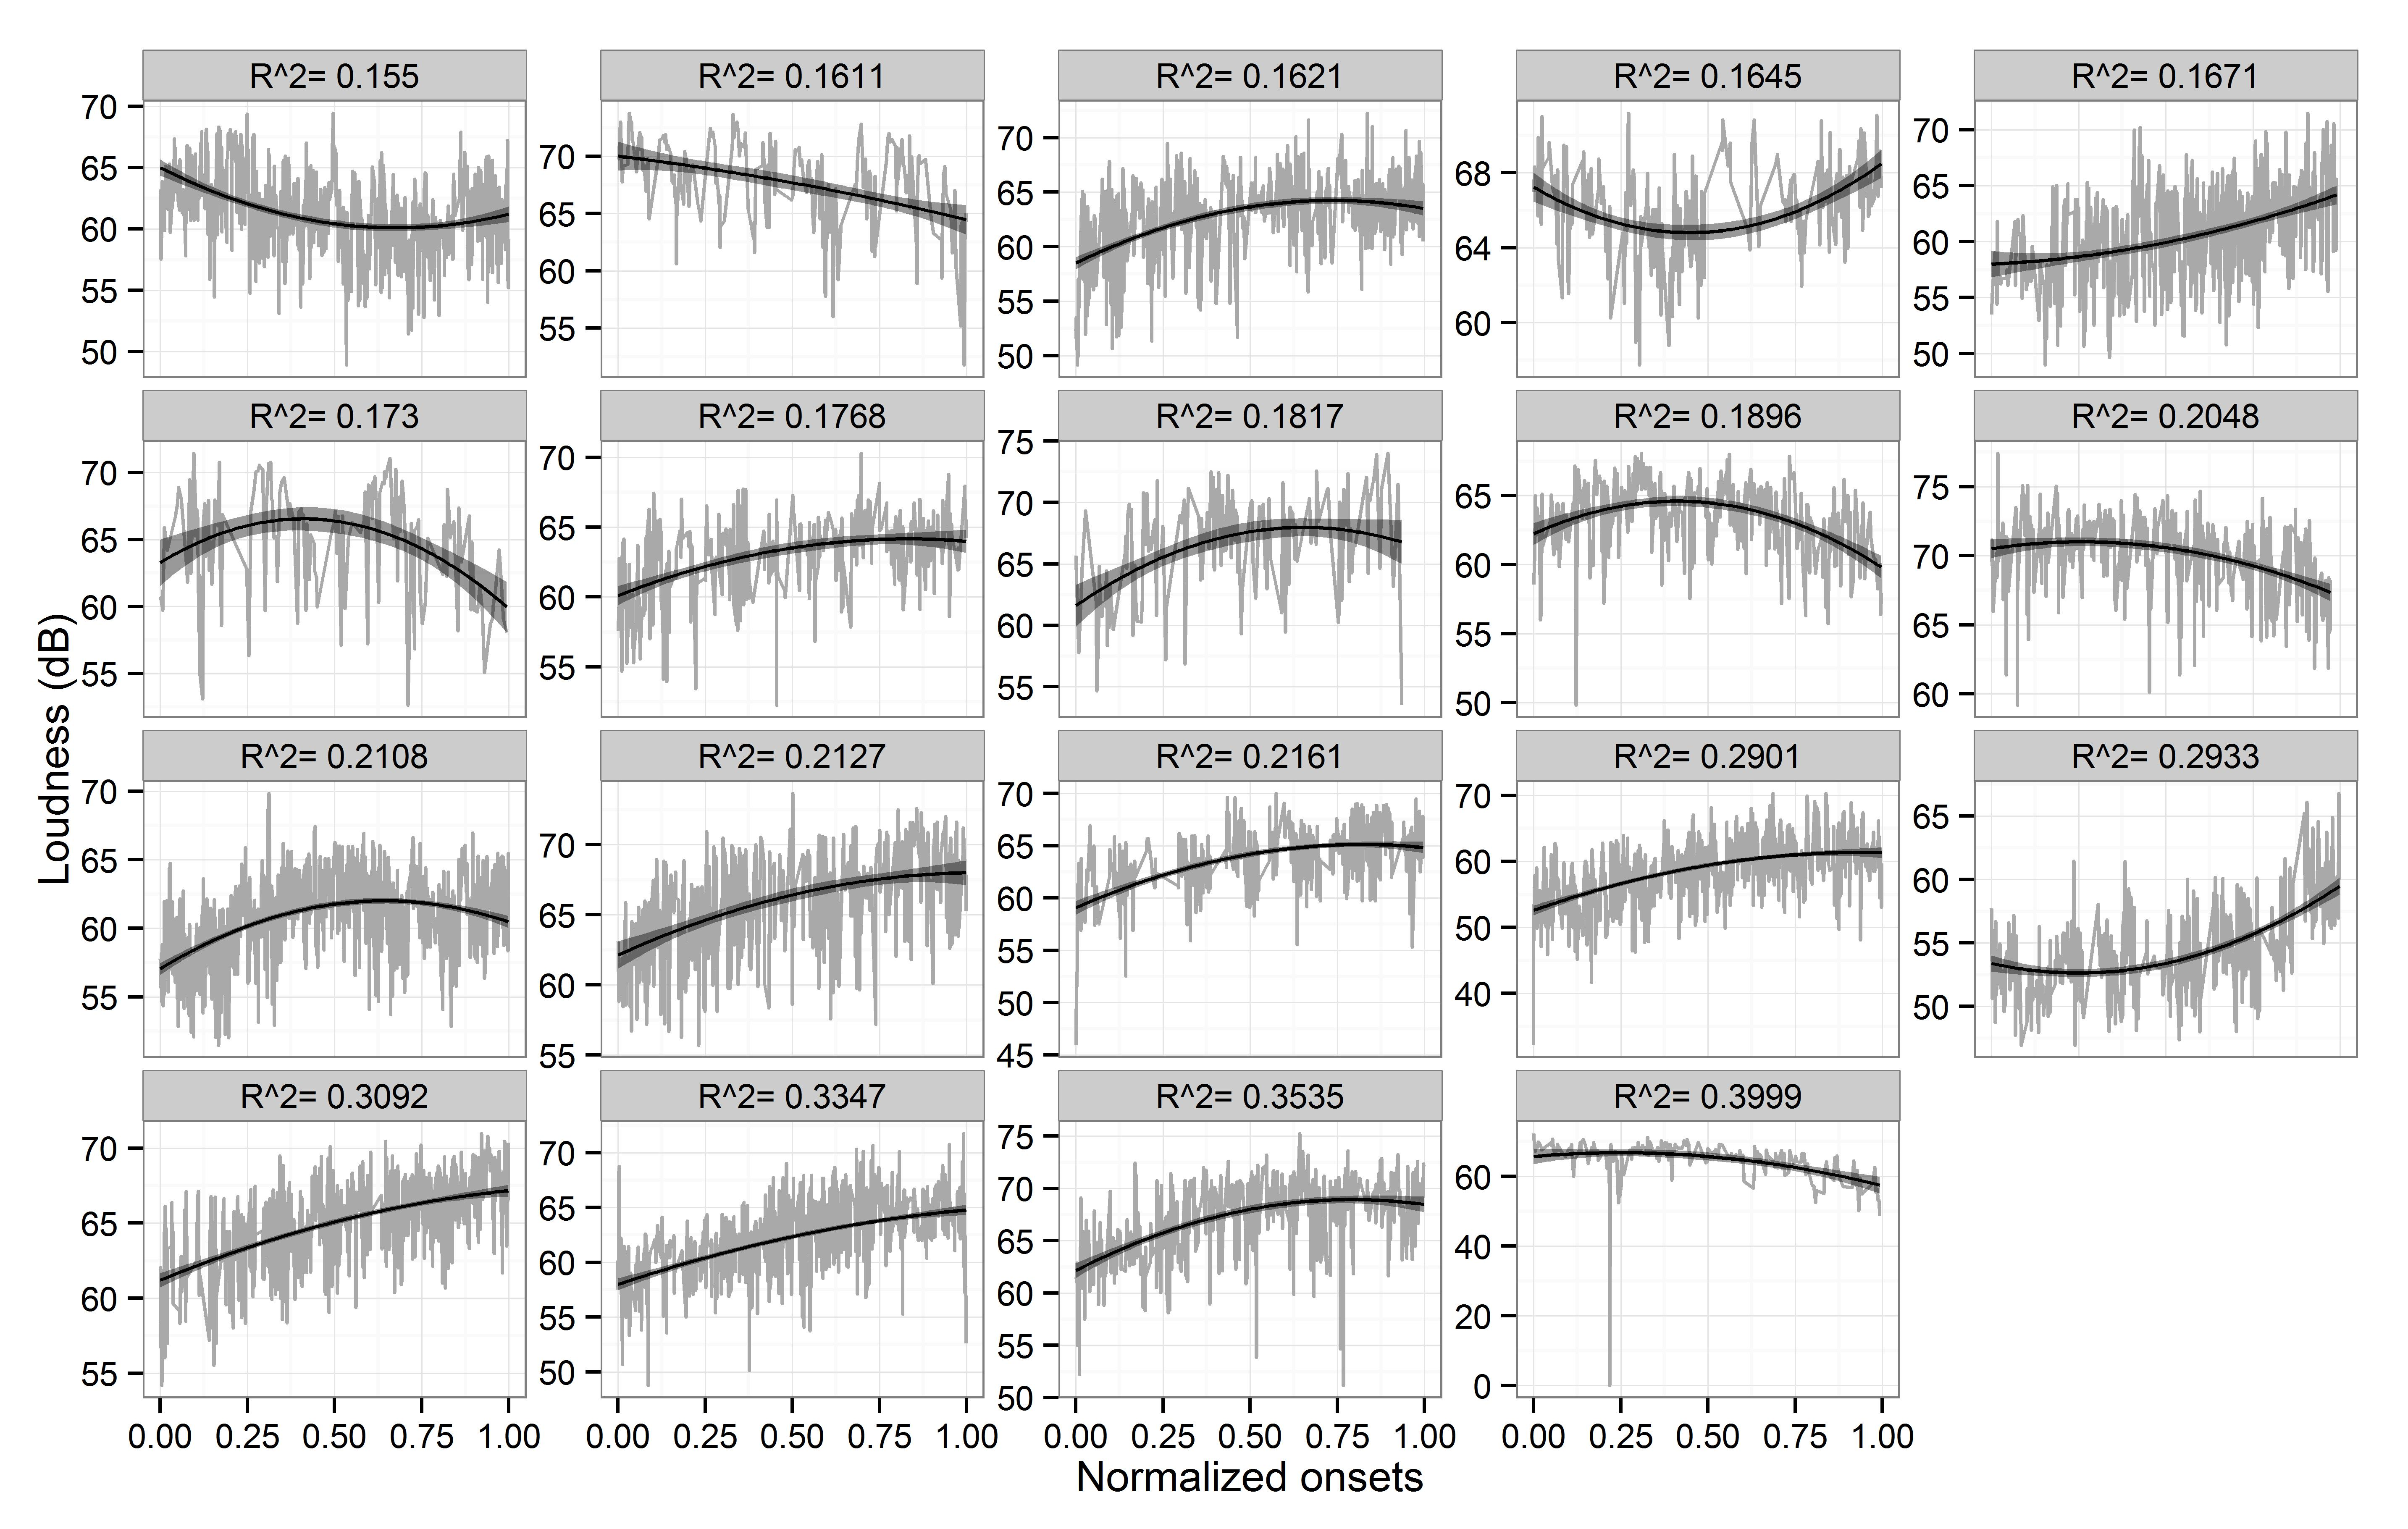
Figure 1. Polynomial fits (2nd order) to loudness curves in 19 solos; only solos resulting in curves with R2 > .15 are shown.
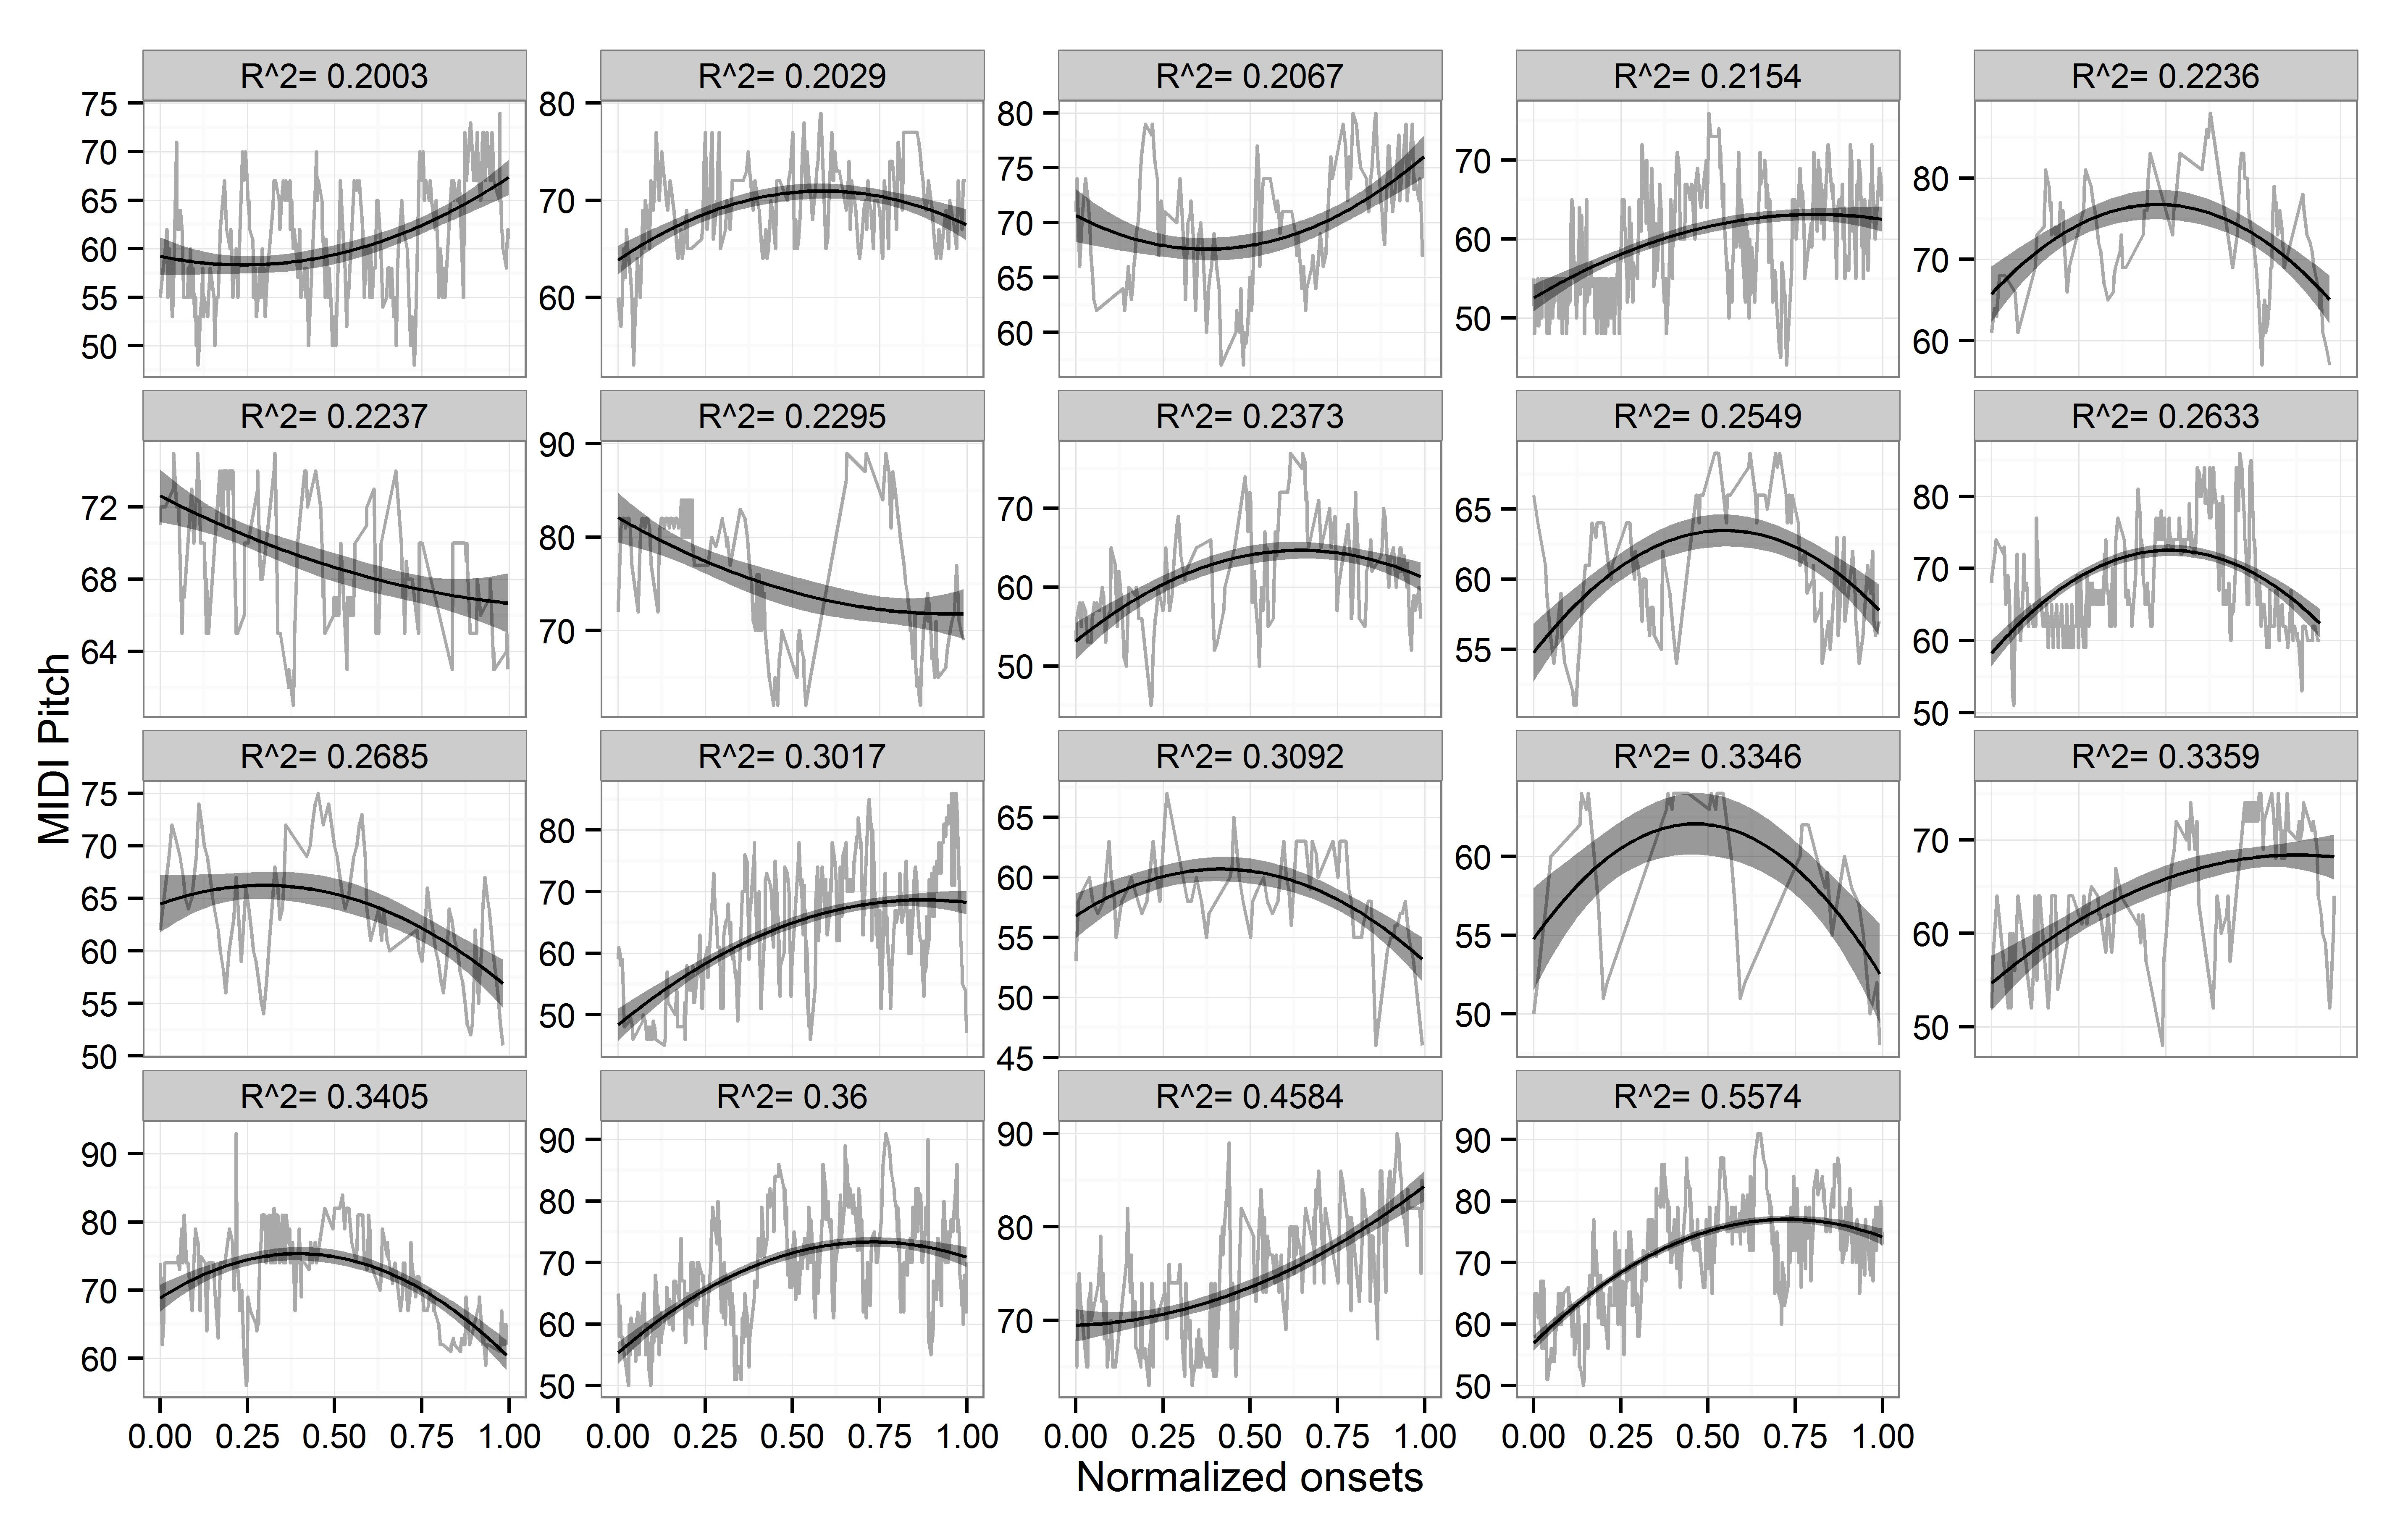
Figure 2. Polynomial fits (2nd order) to pitch curves in 19 solos; only solos resulting in curves with R2 > .2 are shown.
Method
For the second study, we chose a set of 12 single-valued numerical features which in our view are relatable to tension, intensity, or variability (see Table 2). The features come from four different musical dimensions (events, pitch, interval, and rhythm/meter). Changes of intensity as displayed in the course of an improvised solo might be a signifier for heightened or lowered emotional states, i.e., playing more and faster notes in the higher register for high arousal, and playing less and longer notes in the low register for relaxation. Tension is likewise a very important concept in music to convey and induce emotions; direct measures of intrinsic tension are not easy to define (but cf. Egermann, Pearce, Wiggins, & McAdams (2013) for possible ideas into this direction). Consequently, in our selection only one such feature is included. It is defined as the percentage of dissonant notes according to the underlying chords, e.g., tritones, flat ninths, major thirds over minor chords, including passing and neighboring tones. This number is an indicator for the common technique of "outside" playing (i.e., playing tones not fitting to the underlying harmony) as well as for chromaticism, which can create tension that demands relief. The third category, variability, is related to the variance of various musical parameters during an improvisation, e.g., variance of the size of intervals or durations. On the one hand, variability will keep listeners' attention alive while uniformity, e.g., always playing chains of eighths with rather small interval steps, is likely to bore listeners. On the other hand, too much variability on too many dimensions at the same time might lead to a cognitive "overload" of the listener, which in turn can result in perceived intensity or tension. One would expect complex interactions between variability, intensity, and tension and their possible effects on a listener, but each of them can contribute to the overall dramaturgy of a solo.
Initially, we extracted a slightly larger set of features for each phrase, but due to the inherent correlations (by mathematical construction), we pruned the set of features using causal inference (Pearl, 2009) as an informal way to identify the most fundamental features. Principal component analysis or a similar method could have been used to remove all correlations, but this would have hampered the interpretability of the results.
Since these features are scalar and aggregating, they need to be extracted over a certain range of tone events, which we chose to be musical phrases, because phrases represent meaningful musical units and are readily available within the Weimar Jazz Database. As a proxy for time position, we used phrase numbers 6. After obtaining the feature values for each phrase in each solo, we applied the same fit of quadratic polynomials as in Study 1, while fixing the significance level to α = .01. Similar to Study 1, we classified the contours according to the shapes horizontal, ascending, descending, concave, and convex.
Results
Fitting 12 features to each of the 299 solos is likely to produce a lot of spurious results. For each feature we expected about three significant tests at the given significance level by chance alone. However, we were not so much interested in true significance levels than in general trends across the whole dataset. Therefore, instead of using Bonferroni correction for multiple testing, we rely on Bayes Factors of achieved vs. expected significant tests in our discussion. Following standard recommendations for Bayes Factors (though these are not true Bayes Factors), only features with a Bayes Factor larger than three, i.e., having more than three times significant tests than expected, are considered significant. The results for all features can be found in Table 3.
| Category | Type | Feature | Description |
|---|---|---|---|
| Events | Intensity | number_notes | Number of notes. |
| Intensity | event_density | Tone events per second. | |
| Pitch | Intensity | pitch_range | Pitch range (ambitus). |
| Intensity | pitch_mean | Mean value of the pitches of all tones. | |
| Variability | pitch_entropy | Entropy of pitches; measures pitch variability. Smaller values mean lower variability. | |
| Variability | cpc_zipf | Zipf coefficient of distribution of chordal pitch classes; measures dominance of certain pitch classes with respect to underlying harmonies. Smaller values indicate higher variability. | |
| Tension | outside | Summed density of dissonant pitches with respect to underlying harmony (e.g., a major seventh or major third over minor-7 chord or a minor seven over a major-7 chord). Higher values indicate more dissonances. | |
| Interval | Variability | fuzzy_int_entropy | Entropy of refined contour classes; measures variability of interval classes (repeats and steps, leaps and jumps up and down). Smaller values indicate lower variability. |
| Variability | abs_int_range | Range of absolute interval sizes. | |
| Rhythm/Meter | Variability | CV_dur | Coefficient of duration variation; measures variability of durations. Smaller values indicate lower variability. |
| Variability | durclass_abs_entropy | Entropy of duration classes; measures variability of duration classes. Classes are defined with respect to absolute time reference 500 ms (very short, short, medium, long, very long). Smaller values indicate lower variability. | |
| Variability | mcm_entropy | Entropy of metrical positions. Measures variability of occupied metrical positions (one bar is divided into 48 bins). Smaller values indicate lower variability. |
In contrast to Study 1, much fewer significant fits could be observed, which is most likely due to a much smaller number of phrases as compared to the number of notes. This is in line with the observation that 4% of solo and feature combinations did not become significant, but had an adjusted R2 > .1. The largest number of significant fits (28) could be found for pitch_mean, mostly of convex shape. This corroborates the findings of Study 1 on pitch contour. The next best feature is event_density, also with mostly convex contours, meaning that the number of notes per second, i.e., intensity, is often first rising and then falling again. The mean relative peak position for convex event densities is 0.52, hence, the maximum is often reached in the middle of a solo (this is also true for non-significant convex event densities). Next in line is fuzzyint_entropy, again mostly with convex shapes and with relative peak positions of the maxima in the middle of the solo. For CV_dur, concave shapes are prevailing. This corresponds to the convex shapes of event density and might be traced back to fast lines occurring in the middle of a solo, which result in high densities with low duration variability. This is also corroborated by the concave shapes of duration_abs_entropy, which is lower for fast, homogeneous lines, as well as the convex shapes of mcm_entropy, which is higher if subdivision positions are regularly occupied (e.g., by sixteenth notes).
Notably, most of the solos showed only significant fits for one of the features, but not on various features at the same time. Similarly, a correspondence analysis of significant fuzzy_int_entropy and CV_dur revealed that these are mostly orthogonal. This meets our expectations, since fast lines are typically moving in small intervals (steps, thirds), and thus should have low fuzzy_int_entropy. The last two features with a Bayes Factor larger than three are pitch_range with mostly convex shapes and abs_int_range with mostly ascending and concave contours. cpc_zipf and outside did not reach the BF>3 threshold, which might be due to the facts that both variables are not very good operationalizations of harmonic tension, or that harmonic tension is not an important tool in regard to dramatic strategies of jazz musicians.
Finally, we examined the number of simultaneous significant fits per solo. The results can be found in Table 4. There are some solos which show many significant fits on several features simultaneously, which cannot arise just by chance. One of these solos might deserve a closer examination in the form of a short case study.
| Feature | #sig. | BF | horizontal | ascending | descending | concave | convex |
|---|---|---|---|---|---|---|---|
| pitch_mean | 28 | 9.4 | 1 | 3 | 0 | 4 | 20 |
| event_density | 21 | 7.0 | 0 | 3 | 0 | 1 | 17 |
| fuzzyint_entropy | 18 | 6.0 | 1 | 2 | 1 | 2 | 12 |
| CV_dur | 17 | 5.7 | 1 | 2 | 1 | 12 | 1 |
| mcm_entropy | 14 | 4.7 | 1 | 1 | 0 | 0 | 12 |
| pitch_entropy | 13 | 4.3 | 1 | 1 | 0 | 0 | 11 |
| durclass_abs_entropy | 12 | 4.0 | 1 | 1 | 1 | 6 | 3 |
| number_notes | 10 | 3.3 | 1 | 3 | 0 | 1 | 5 |
| pitch_range | 10 | 3.3 | 1 | 2 | 0 | 2 | 5 |
| abs_int_range | 9 | 3.0 | 2 | 3 | 0 | 3 | 1 |
| cpc_zipf | 7 | 2.3 | 1 | 0 | 2 | 0 | 4 |
| outside | 6 | 2.0 | 1 | 1 | 0 | 2 | 2 |
| # significant fits | Frequency | Expected | Bayes Factor |
|---|---|---|---|
| 1 | 47 | 32.1 | 1.46 |
| 2 | 15 | 1.78 | 8.4 |
| 3 | 5 | 0.06 | 83.2 |
| 4 | 2 | <0.001 | 1,464 |
| 5 | 1 | <0.001 | 4.5⋅104 |
| 7 | 5 | <0.001 | 2.2⋅109 |
| 9 | 1 | <0.001 | 1.6⋅1013 |
Bob Berg's Solo on "I Didn't Know What Time it Was"
The most prominent example with many simultaneous significant fits is Bob Berg's solo on "I Didn't Know What Time It Was" (from "Cedar Walton Quartet: Second Set", SteepleChase SCS-1113, 1979; see Figure 3) 7. The solo contains 39 phrases in a total of three choruses and 108 bars with phrase lengths ranging from 3–57 notes and a median of 24 notes. The tempo is medium (127 bpm); the rhythmic feel is a relaxed swing throughout. The solo starts off with a relatively calm exploration of a single short melodic cell, which is played several times using different transpositions and variations. This sequence of variations is slowly and gradually increasing in pitch range and phrase length. Then, a first quick line occurs in phrase 9. In the middle of the solo, Bob Berg plays some longer and faster lines from phrase 14 on, which results in the arch-like shapes of the features number_notes, event_density, durclass_abs_entropy, pitch_entropy, cpc_zipf, and mcm_entropy. Possibly reacting on this, the drummer (Billy Higgins) switches from brushes to sticks in phrase 16 (start of second chorus), thus adding more drive. Furthermore, the solo gets increasingly diverse with respect to interval use towards the end, which is reflected in the ascending trends of fuzzy_int_entropy, pitch_range, and abs_int_range. Hence, the surprisingly high number of simultaneous trends can partly be explained by the fact that the same musical surface, e.g., the long fast lines in Bob Berg's solo, is reflected in several correlated features, e.g., Berg always combines fast moving sixteenth notes with a large variety of pitches.
Inspecting the time course of the features more closely reveals that the polynomials capture an overall trend with the phrases oscillating along this trend. For example, there is an alternating pattern of phrase lengths (number_notes) that occurs three times in a row in the middle of Berg's solo with slowly expanding tendency. The pattern consists of one very long line, followed by a very short lick, followed by lines of medium length.
The climax of the solo is reached in phrase 30 and 31, starting in phrase 30 with a fast double-time line consisting mainly of sixteenth notes in stepwise motion followed by a long fall down over a range of nearly two octaves using the interval pattern -4 -1 -1 -1 (one major third followed by three minor seconds downwards) sequenced in whole tones. This pattern is continued shortly at the beginning of phrase 31, but is then followed by a quick upward sweep over nearly three octaves using fourth, fifths, and thirds, and then falling down again about one octave with a downward scale. In phrase 30 we thus have simultaneously a narrowing of interval range (due to the repeated chromatic pattern) with a widening of overall pitch range as well as a peak of chromaticity (low cpc_zipf value) and a peak in intensity (only sixteenth durations, high event_density). Moreover, the lowest and highest pitches in the solo are both reached within only eleven tones of phrase 31.
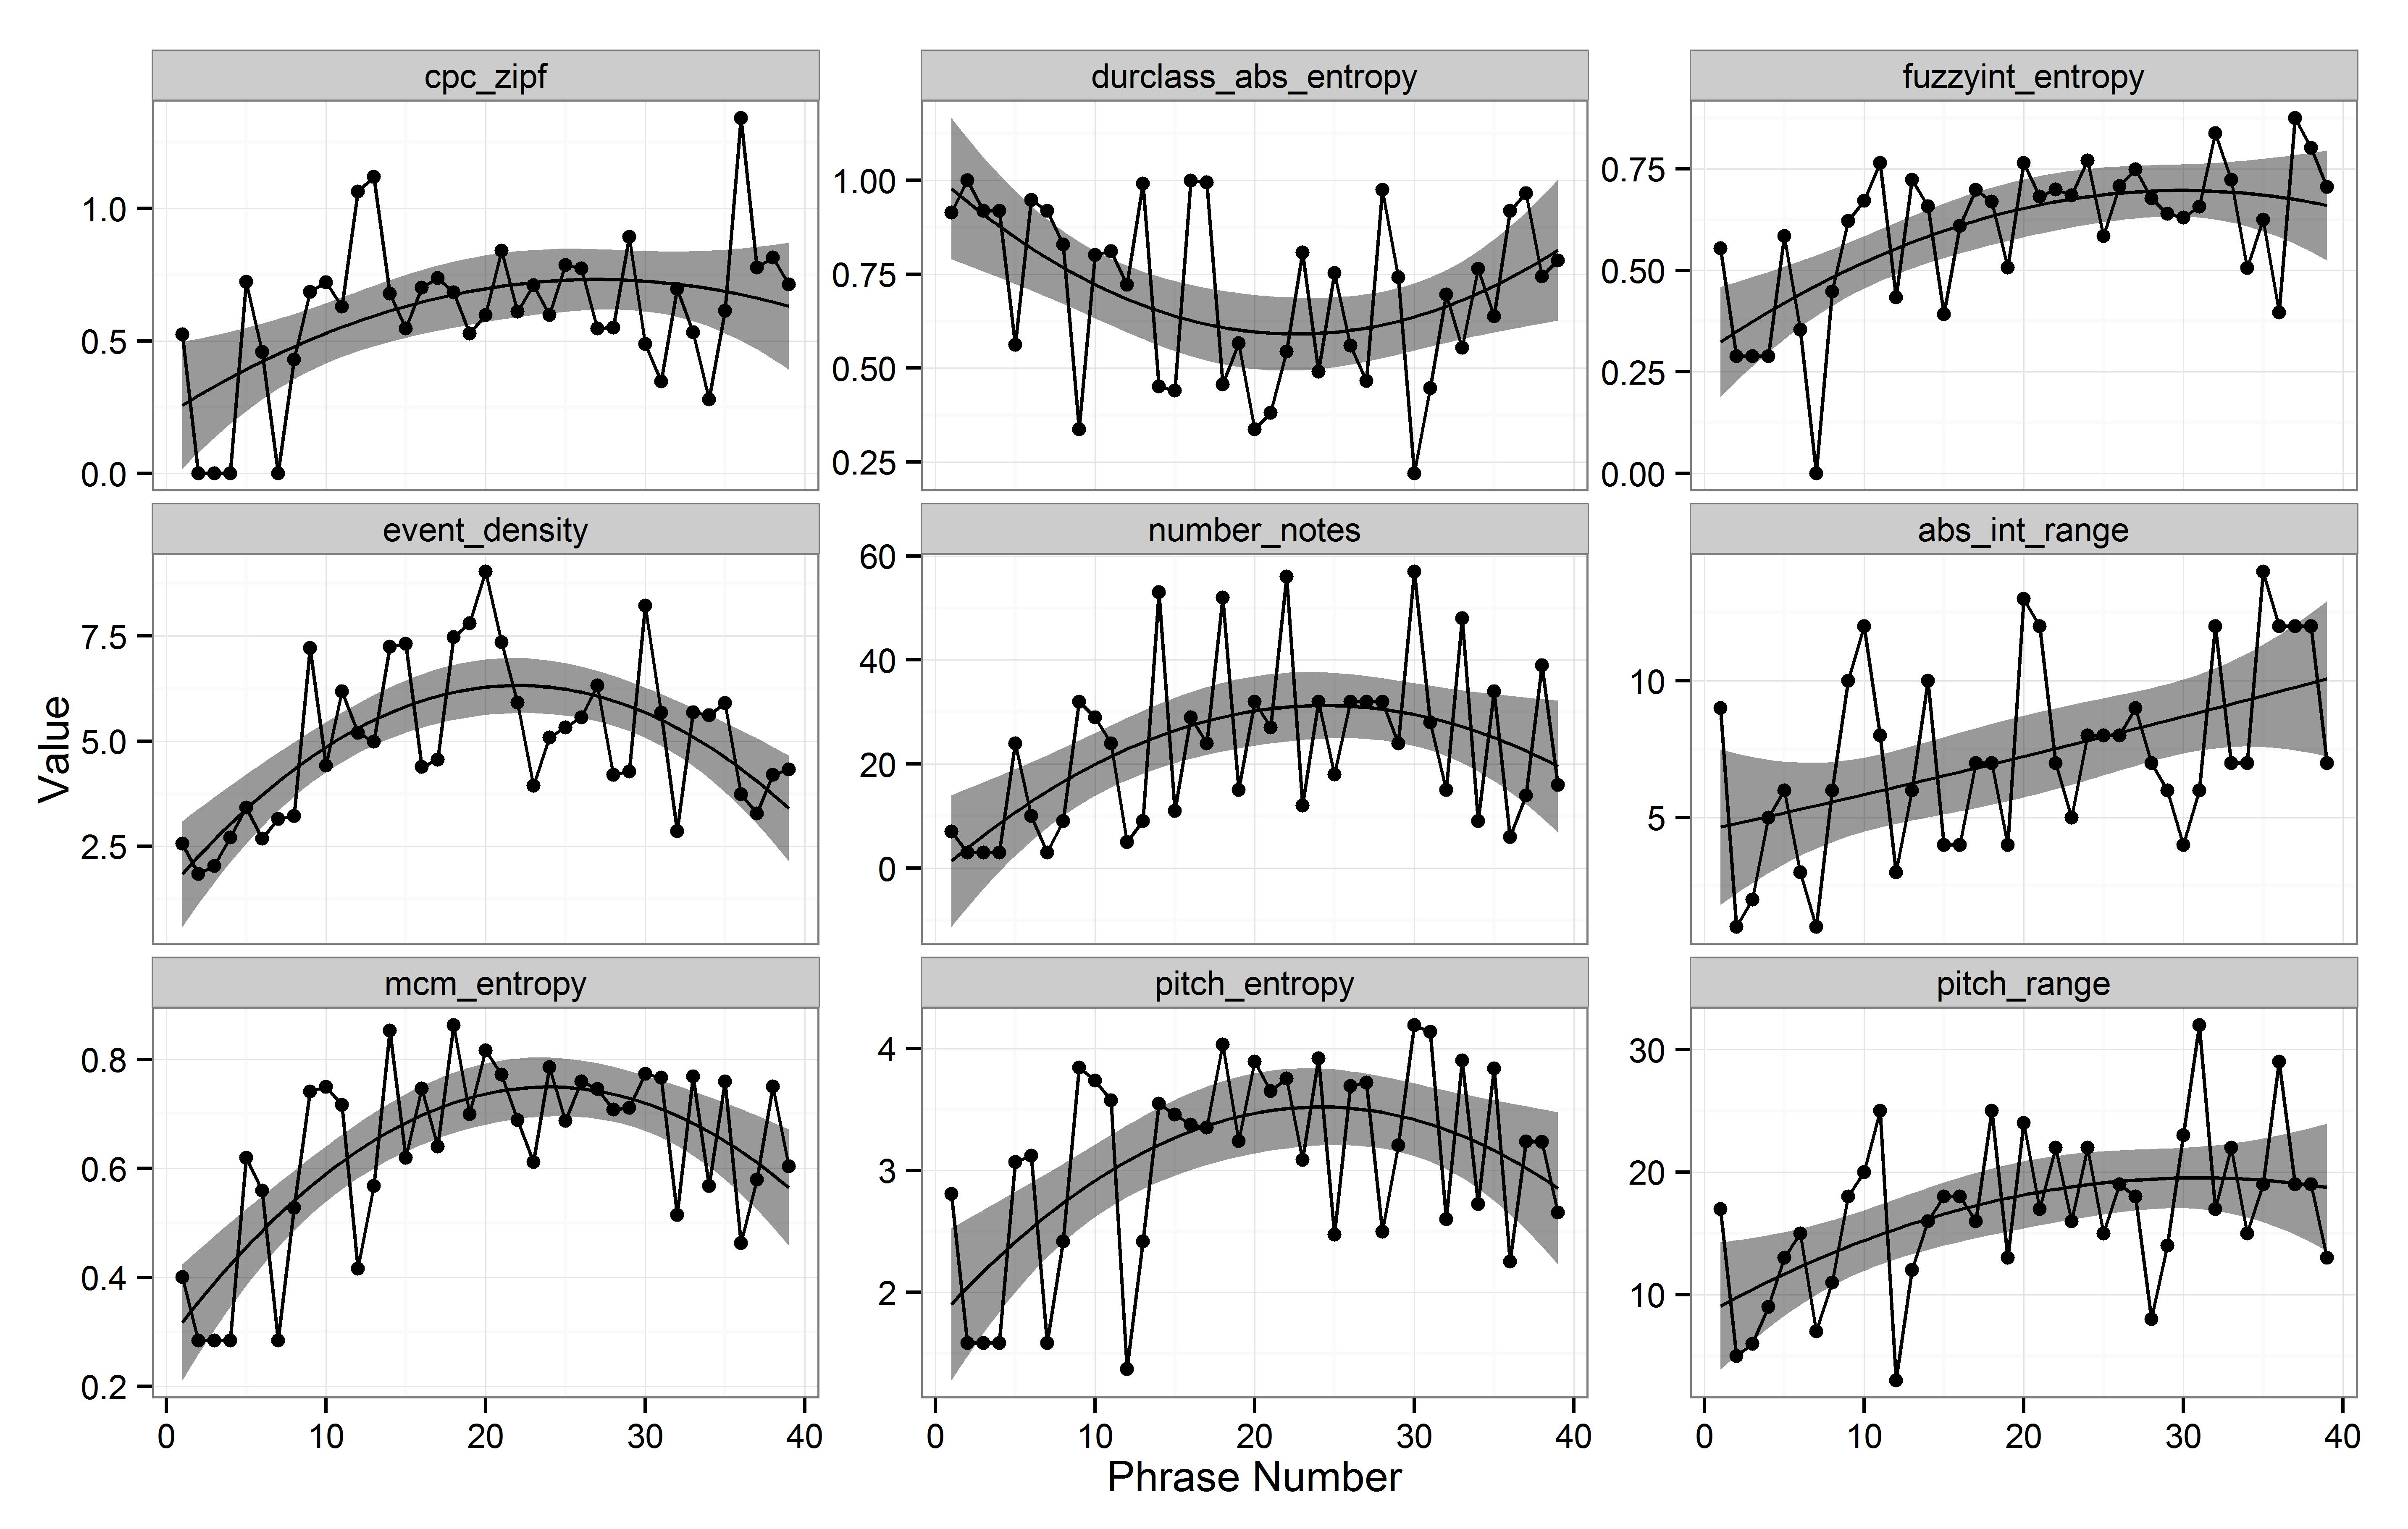
Figure 3. The seven simultaneously significant fits for Bob Berg's solo on "I Didn't Know What Time It Was" (1979). See Table 2 for an explanation of the corresponding features.
Study 3: Midlevel Analysis
Data
In the third study, a subset of 116 solos by 55 soloists from the Weimar Jazz Database was used, which had the necessary midlevel annotations.
Method
Midlevel analysis is a recently developed qualitative method (Frieler & Lothwesen, 2012; Schütz, 2015) that segments solos into non-overlapping and exhaustive sequences of midlevel units (MLU). These midlevel units are classified into nine main categories (cf. Table 5) with 18 sub- and 38 sub-subcategories (Frieler, Pfleiderer, Abeßer & Zaddach, 2016). The categories were originally developed and condensed from the data until the system was saturated and a code book could be written. The annotation of MLUs was done by four expert annotators. Special care was taken to achieve high inter-rater reliability, which is about 80% for segment borders and around 60% for categories; the most often confused categories are lines and licks (Frieler et al., 2016). For this study, we used the midlevel annotations to examine the differences in relative position of the various midlevel unit categories within a solo. To this end, we devised the relative starting position of a MLU as the normalized tone position of the starting tone of that MLU within a certain solo.
With respect to dramatic intensity, we are particularly interested in the two main categories, expressive and rhythm, since these two seem to have the highest intensity. Expressive units are defined as units where expressivity rather than melodic or rhythmic principles is in the foreground, often comprising aspects of timbre, too, which are not captured in the representation of tone events in the Weimar Jazz Database. Similarly, rhythm units can convey a feeling of urge and intensity due to the mostly insistent repetition of a small set of pitches. On the other hand, the categories void (intentionally playing nothing), fragment (short particles or errors) and lick (rather short melodic cells) can be related to more relaxed states, since these leave more space in the musical texture.
| Main type | Subtypes | Description |
|---|---|---|
| line | ascending, descending, wavy, interwoven, "tick lines" | Melodic sequence with strong directionality, rhythmically rather uniform. |
| lick | blues lick, bebop lick | Rather short melodic motif, rhythmically and tonally diverse, succinct ("prägnant") gestalt. |
| melody | Clear, melodic character, "cantabile", theme-like. | |
| rhythm | single/multi-note, regular/irregular | Rhythm prevails over pitch aspects. |
| expressive | Expressive aspects are in the foreground, e.g., long tones, "screams", "honks" | |
| void | Deliberate non-playing, overlong breaks. | |
| theme | Reference to the theme of the song. | |
| quote | Quotation from other music. | |
| fragment | Short particles, errors. |
Results
There were 4,412 MLUs in total, with a median of 34.5 MLUs per solo (range: 7–163, SD = 22.3). The most common category is lick, comprising 44.3% of all MLUs, followed by line (33.5%), melody (7.0%), expressive (4.9%) and rhythm (4.9%). All other categories occur less than 2% each. Mean duration of all MLUs is 2.26 sec with a mean length of 12.1 tones.
The relative positions of the main categories differ significantly (F(8, 4403) = 8.618, p < 0.001). On the one hand, theme (median relative position = .22), quote (.33), and void (.38) occur earlier (see Figure 4), indicating a tendency toward relaxed beginnings of jazz solos. On the other hand, the expressive types expressive (.63) and rhythm (.62) tend to occur later in a solo. This hints at the fact that climaxes can be found more often in the second half of a solo and concurs with the findings from Study 1 and 2. Interestingly, lick and melody show a tendency to bi- or even tri-modality, with peaks both at the beginning or the end, and occasionally in the middle of a solo. This hints at additional dramaturgical devices besides tension and intensity curves connected with the semantics of the different types of MLUs. For example, a short blues lick conveys a different meaning or emotionality than a long and virtuosic bebop line.
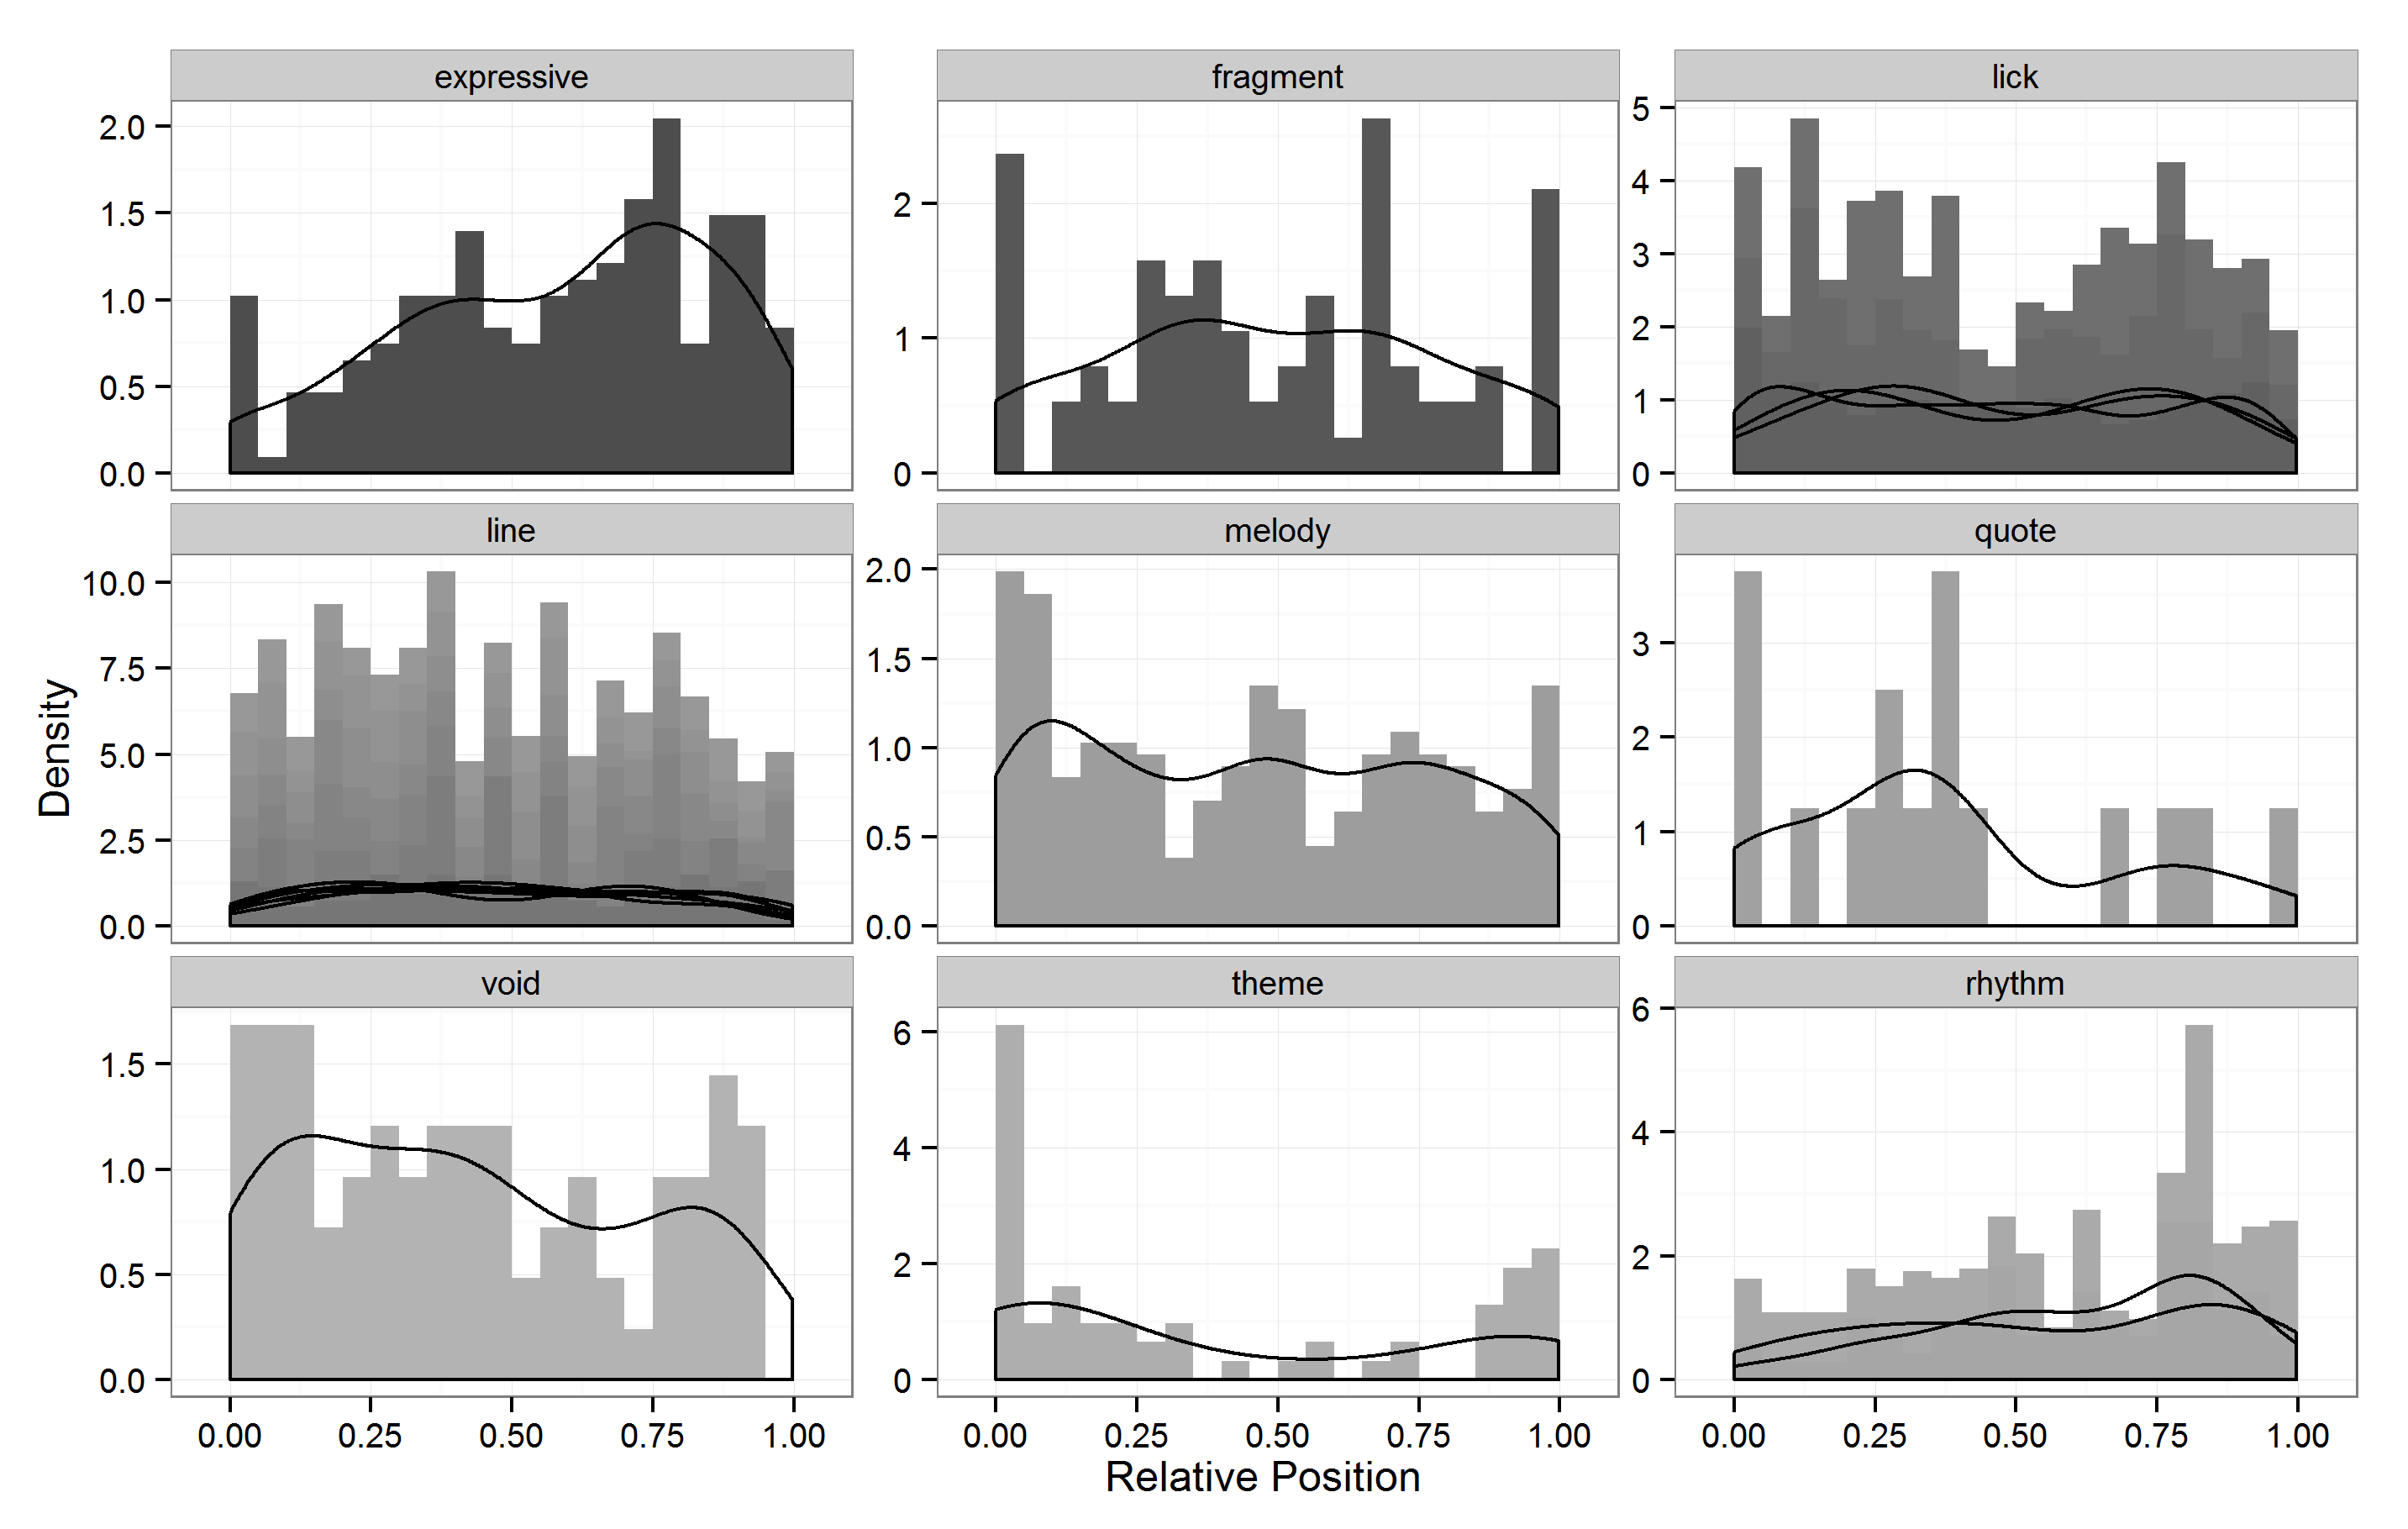
Figure 4. Histograms and density estimations of relative (start) positions of the nine main and 18 subcategories of midlevel units.
Discussion
The three studies presented in this paper are so far the first explorative and statistical analysis of macro-level structures of jazz solos. In the first and second study overall (quadratic) trends for some solos on some variables could be observed. In general, however, solos tend to be relatively constant (flat) with respect to the investigated features. For those solos which exhibit clear linear or quadratic trends, convex, arch-like shapes were the most common. Particularly, for measures related to (psychological) intensity, such as acoustical intensity (loudness), pitch, or event density, the peaks fall in the second half of most of the solos. This is in accordance with dramatic theory as outlined initially. The climax is often reached relatively late in a solo and the resolution happens quite quickly. The case study of Bob Berg's solo is a very neat example, but also an exceptional case. The majority of solos do not fit a simple dramatic structure. On the contrary, some solos show even descending or anti-climax (concave) curves. However, for intensity and pitch, the overall linear trend was mostly ascending. Therefore, overall dramaturgy in jazz tends more often toward development and intensification than toward decline and relaxation.
There are of course several limitations of our approach. First, the operationalization is following a rather simple heuristic, which, however, we consider to be adequate for a first explorative study. Second, the choice of quadratic and linear trends can be well justified by parsimony and the facilitation of comparison. However, higher order polynomials might be still worth being examined in the future, since it is not fully clear whether dramatic structure is indeed absent, or whether it is more complex and intricate. This might be particularly true for longer solos, because it might not be easy (and maybe also not desirable) for a performer to maintain a simple linear or quadratic tension curve over the whole time course.
Dramatic structures cannot be equated with narrative structures in general. At most, they are a proper subset of the narrative space that can be conveyed within music in general and within the jazz idiom in particular. This narrative space awaits further detailed analytical examination in the future.
ACKNOWLEDGEMENTS
The work was supported by the DFG grant "Melodisch-rhythmische Gestaltung von Jazzimprovisationen. Rechnerbasierte Musikanalyse einstimmiger Jazzsoli" (DFG-PF 669/7-1).
NOTES
-
Correspondence can be addressed to: Dr. Klaus Frieler, University of Music "Franz Liszt" Weimar, klaus.frieler@hfm-weimar.de.
Return to Text -
Having a personal "sound" is likewise a very commonly used metaphor and an often mentioned aesthetical goal for a good jazz player (Sidran, 1995).
Return to Text -
We do not want to prove this association hypothesis. It is used here merely as an argument for examining pitch height in the first place.
Return to Text -
We used the lm() function from R (R Core Development Team, 2008) with the poly()-option, which uses orthogonal polynomials to reduce correlation between higher order terms.
Return to Text -
This is in very good agreement to a statement by Roy Eldrige (Berliner, 1994:262) that Louis Armstrong "built his solo like a book—first, an introduction, then chapters, each one coming out of the one before and building to a climax".
Return to Text -
Phrase numbers correlate highly with the first onsets of phrases (r > .9, p < .001). Because phrases can be of highly varying length and duration, a "true" time position of a phrase is not unequivocally definable. Therefore, we decided to use phrase IDs as a reasonable alternative, reflecting the relative course of phrases in a solo.
Return to Text -
A score of the solo transcription can be found here: http://jazzomat.hfm-weimar.de/scores//BobBerg_IDidn'tKnowWhatTimeItWas_PREFINAL.pdf
Return to Text
REFERENCES
- Aristotle (1996). Poetics. Translated with an introduction and notes by M. Heath. London: Penguin.
- Abeßer, J., Cano, E., Frieler, K., & Pfleiderer, M. (2014). Dynamics in jazz improvisation. Score-informed estimation and contextual analysis of tone intensities in trumpet and saxophone solos. In T. Klouchè & E. Miranda (Eds.), Proceedings of the 8th Conference on Interdisciplinary Musicology (CIM14), Berlin, 4–6 December 2014.
- Berliner, P. F. (1994). Thinking in Jazz. The Infinite Art of Improvisation. Chicago: University of Chicago Press. http://dx.doi.org/10.7208/chicago/9780226044521.001.0001
- Bjerstedt, S. (2014). Storytelling in Jazz Improvisation. Implications of a Rich Intermedial Metaphor. Lund: Lund University Publications.
- Egermann, H., Pearce, M.T., Wiggins, G.A., & McAdams, S. (2013). Probabilistic models of expectation violation predict psychophysiological emotional responses to live concert music. Cognitive, Affective, & Behavioral Neuroscience, 13(3), 533–53. http://dx.doi.org/10.3758/s13415-013-0161-y
- Epstein, M. J. (2011). Correlates of loudness. In M. Florentine, R. Fay, & A. Popper (Eds.), Loudness (pp. 89–108). New York: Springer Science & Business Media. http://dx.doi.org/10.1007/978-1-4419-6712-1_4
- Field, S. (1979). Screenplay. Dell Publishing Company.
- Frieler, K., Abeßer, J., Zaddach, W.-G., & Pfleiderer, M. (2013). Introducing the Jazzomat Project and the Melo(S)py Library. In P. van Kranenburg, C. Anagnostopoulou, & A. Volk (Eds.) Proceedings of the Third International Workshop on Folk Music Analysis (pp. 76–78). Meertens Institute and Utrecht University Department of Information and Computing Sciences,.
- Frieler, K., Pfleiderer, M., Abeßer, J., & Zaddach, W.-G. (2016). Midlevel analysis of monophonic jazz solos. A new approach to the study of improvisation. Musicae Scientiae, 20(2), 143–162. http://dx.doi.org/10.1177/1029864916636440
- Freytag, G. (1863/2003). Die Technik des Dramas (in German). Leipzig: Hirzel (Berlin: Autorenhaus Verlag).
- Huron, D. (2006). Sweet Anticipation: Music and the Psychology of Expectation. Cambridge, MA: The MIT Press.
- Iyer, V. (2004). Exploding the narrative in jazz improvisation. In R. G. O'Meally, B. H. Edwards, & F. J. Griffin (Eds.), Uptown Conversation: The New Jazz Studies (pp. 393–403). New York: Columbia University Press.
- Lothwesen, K. & Frieler, K. (2012). Gestaltungsmuster und Ideenfluss in Jazzpiano-Improvisationen. Eine Pilotstudie zum Einfluss von Tempo, Tonalität und Expertise. In A.C. Lehmann, A. Jeßulat, & C. Wünsch, (Eds.), Kreativität: Struktur und Emotion (pp. 256–265). Würzburg: Königshausen & Neumann.
- Meyer, L. B. (1956). Emotion and Meaning in Music. Chicago, IL: The University of Chicago Press.
- Pearl, J. (2009). Causal inference in statistics: An overview. Statistics Survey, 3, 96–146. http://dx.doi.org/10.1214/09-SS057
- R Development Core Team (2008). R: A language and environment for statistical computing. R Foundation for Statistical Computing, Vienna, Austria. URL: http://www.r-project.org.
- Schütz, M. (2015). Improvisation im Jazz. Eine empirische Untersuchung bei Jazzpianisten auf der Basis der Ideenflussanalyse (in German). Studien zur Musikwissenschaft, Vol. 34. Hamburg: Verlag Dr. Kovač.
- Sidran, B. (1995). Talking Jazz. An Oral History. Boston: Da Capo Press (expanded edition).
Appendix
| Performer | Solos | Styles |
|---|---|---|
| Art Pepper | 6 | COOL |
| Ben Webster | 5 | SWING |
| Benny Carter | 5 | SWING |
| Benny Goodman | 7 | SWING |
| Bix Beiderbecke | 4 | TRADITIONAL |
| Bob Berg | 6 | POSTBOP |
| Buck Clayton | 3 | SWING |
| Cannonball Adderley | 5 | HARDBOP |
| Charlie Parker | 6 | BEBOP |
| Charlie Shavers | 1 | TRADITIONAL |
| Chet Baker | 6 | COOL |
| Chu Berry | 1 | SWING |
| Clifford Brown | 7 | HARDBOP |
| Coleman Hawkins | 6 | SWING |
| Curtis Fuller | 2 | HARDBOP |
| David Liebman | 5 | POSTBOP |
| David Murray | 6 | POSTBOP |
| Dexter Gordon | 5 | SWING, BEBOP |
| Dickie Wells | 3 | SWING |
| Dizzy Gillespie | 5 | BEBOP |
| Don Byas | 7 | BEBOP, SWING |
| Don Ellis | 2 | POSTBOP |
| Eric Dolphy | 3 | POSTBOP |
| Fats Navarro | 4 | BEBOP |
| Freddie Hubbard | 6 | POSTBOP, HARDBOP |
| Gerry Mulligan | 3 | COOL |
| Hank Mobley | 3 | HARDBOP |
| Harry Edison | 1 | SWING |
| Henry Allen | 1 | TRADITIONAL |
| J.C. Higginbotham | 1 | TRADITIONAL |
| J.J. Johnson | 5 | BEBOP |
| Joe Henderson | 6 | POSTBOP |
| Joe Lovano | 6 | POSTBOP |
| John Abercrombie | 1 | POSTBOP |
| John Coltrane | 13 | HARDBOP, POSTBOP |
| Johnny Dodds | 1 | TRADITIONAL |
| Joshua Redman | 5 | POSTBOP |
| Kai Winding | 1 | BEBOP |
| Kenny Dorham | 6 | BEBOP, HARDBOP, POSTBOP |
| Kenny Garrett | 2 | POSTBOP |
| Kenny Wheeler | 1 | POSTBOP |
| Kid Ory | 3 | TRADITIONAL |
| Lee Konitz | 5 | COOL |
| Lee Morgan | 1 | HARDBOP |
| Lester Young | 6 | SWING |
| Lionel Hampton | 2 | SWING |
| Louis Armstrong | 6 | TRADITIONAL |
| Michael Brecker | 6 | POSTBOP |
| Miles Davis | 8 | HARDBOP, POSTBOP |
| Milt Jackson | 3 | BEBOP, COOL |
| Nat Adderley | 2 | HARDBOP |
| Ornette Coleman | 5 | FREE |
| Pat Martino | 1 | POSTBOP |
| Pat Metheny | 1 | POSTBOP |
| Paul Desmond | 8 | COOL |
| Rex Stewart | 1 | SWING |
| Roy Eldridge | 6 | SWING |
| Sidney Bechet | 3 | TRADITIONAL |
| Sonny Rollins | 12 | HARDBOP, POSTBOP |
| Sonny Stitt | 4 | BEBOP |
| Stan Getz | 6 | COOL |
| Steve Coleman | 7 | POSTBOP |
| Steve Lacy | 5 | HARDBOP |
| Steve Turre | 3 | POSTBOP |
| Von Freeman | 1 | POSTBOP |
| Warne Marsh | 2 | COOL |
| Wayne Shorter | 10 | POSTBOP, HARDBOP |
| Woody Shaw | 6 | POSTBOP |
| Wynton Marsalis | 2 | POSTBOP |
| Zoot Sims | 2 | COOL |
