
Introduction
THE pulse in music is considered to be a fundamental reference level for the perception of rhythm (Parncutt, 1994; London, 2012). Although it may coincide with sonic events in the music, the pulse is constructed, first and foremost, by the perceiver and may not be represented by sonic events (for example, during pauses or syncopated sequences). Thus the pulse level cannot always be directly measured in the sound signal (Sethares, 2007; Nozaradan et al., 2011; Honing, 2013). Research has shown that we tend to interpret rhythm in a metrical context (Honing, 2012)—that is, in relation to an organization of the pulse level. Even when we are presented with isochronous sequences of equivalent sounding events, we do not process them as equal, due to the subjective accenting (Brochard et al., 2003). We perceive meter when certain beats in a pulse are perceived as accented in a regularly repeating pattern. The perception of this kind of regularity in music is considered to be a result of "strong" (accented) and "weak" (unaccented) beats, which generate a metrical hierarchy (Lerdahl & Jackendoff, 1983). In such a hierarchy, the first beat in the repeating cycle (or measure), often referred to as the "downbeat," is considered the "strongest." The meter can therefore, in principle, be interpreted in a number of ways (Lee, 1991; Honing, 2012). In polymetric 2 music, multiple meters can coexist—for example, music in 6/8 can be perceived as having either three or two underlying beats. London refers to David Locke's "Gestalt flip" describing the way in which one can switch between alternative metrical interpretations of music with multiple possible downbeat locations (see London, 2012). In addition, in some music styles the downbeat is not indicated by the strongest sonic beat but by an accent pattern that is typical of the genre, such as, for example, a backbeat groove in which the second and fourth beat are accentuated (London, 2012; Danielsen et al., 2015). Hence, the perception of meter depends on the perceived pulse and downbeat but also familiarity or facility with the genre in question. Researchers have also pointed out that, in some music, the pulse may not consist of points in time but of "extended" beats ("beat bins"), either because there are multiple pulse-related onsets of sonic events that merge into a given perceived beat (Danielsen, 2010), or because the beginning of the beat-related sonic event is ambiguous, as in fiddle music (Johansson, 2010).
Music perception, researchers have claimed, comprises a fusion of auditory and motor sensations (Godøy, 2006, 2011), and rhythm, in particular, belongs to the field of tacit and embodied knowledge based on motor experiences (Shove & Repp, 1995; Blom, 2006). The intimate relationship between musical meter and body motion has been documented in a number of studies. Entrainment studies, for example, point out that humans seem to be able to coordinate their actions with an external auditory stimulus. Clayton describes the intra-individual entrainment that takes place within a person, which appears to be responsible for the perception of musical meter, whereas inter-individual musical entrainment labels the underlying dynamics of movement coordination among people (Clayton, 2012, 2013). Our ability to synchronize our rhythmic motion to an external rhythm has also been investigated in a number of studies using finger tapping, dancing, and other body motions performed in time with an audible rhythm (see, e.g., Repp & Su, 2013; Danielsen et al., 2015). Body motions entrained to the pulse level of the music include synchronized foot tapping, head nodding, and body swaying (Leman & Godøy, 2010; Merchant et al., 2015). In addition, research on patterns in spontaneous motions that are aligned to music has shown that several levels of the metrical hierarchy can be embodied simultaneously (Toiviainen et al., 2010). According to existing research on pulse and body motion, body motion is not only a reaction to hearing rhythmic input, but can also facilitate the processing of temporal structures (Su & Pöppel, 2012) and improve the perception of timing—that is, time keeping (Manning & Schutz, 2013).
Researchers have also criticized the preconception that an underlying reference structure must consist of isochronous beats (Bengtsson, 1987; Kvifte, 2004; Johansson, 2009; Polak, 2010). Instead of the idea of a Common Fast Pulse (CFP), indicating a shared reference level of isochronous subdivisions, Kvifte (2007) proposes a Common Slow Pulse (CSP), indicating a shared reference level above beat level. He observes that this allows us to understand metrical beats as unequal divisions of the reference level of the measure, as performed by moving bodies. Given the acknowledged close relationship between body-motion patterns and metrical patterns in music, Kvifte argues that such body motions are better candidates for a fundamental reference structure than a fixed clock pulse.
Similar points have been made in other studies discussing the conception of rhythm in music styles with an intimate relationship to dance. Dance has been categorized as sound-accompanying motions (Jensenius, 2007) or described as responses to musical sound (van Dyck et al., 2013). 3 However, for music styles in which music and dance have evolved together through mutual interaction (Blom, 1981; Naveda & Leman, 2009), it has been pointed out that the musical rhythm must be understood in relation to the corresponding dance (Grau, 1983; Baily, 1985; Kubik, 1990; Mariani, 1998; Carvalho, 1999; Gerischer, 2006; Blom, 2006). It has also been suggested that rhythm patterns may be conditioned by the particular way of dancing (Bengtsson, 1974; Blom, 1981, 1993, 2006). Blom explains that traditional dance music is performed with the "correct swing" because the musicians have an internalized knowledge of the rhythmic character of the corresponding dance (Blom, 2006). In other words, dance is not only a response to musical sound but also an intrinsic part of the music. In order to gain a better understanding of rhythm structures in music with an intimate relationship to dance, the present study investigates a specific style of traditional Norwegian folk dance called telespringar.
Norwegian Telespringar
Springar tunes are among the older types of Norwegian folk dances known as regional dances (Bygdedanser;Bakka et al., 1995), and telespringar is a springar from the region of Telemark in Norway. Telespringar can be played on several traditional instruments but is usually played on the Hardanger fiddle, an ornately decorated fiddle instrument that is slightly smaller than a regular violin. It has a relatively short neck and flat bridge, and four or five sympathetic strings that run under the bowed strings. The sympathetic strings resonate when the bowed strings are played, contributing to the rich sound of this fiddle and also giving the music its characteristic drone. The fiddle playing is also extensively ornamented.
Telespringar tunes are usually notated in triple meter, but it is a common understanding that telespringar is in asymmetrical meter—that is, the three underlying beats in a measure are of uneven duration (Groven, 1971; Blom, 1981; Kvifte, 1999). The asymmetrical beat pattern varies among different types of springar tunes, but telespringar is characterized by a long–medium–short duration pattern at the beat level (Groven, 1971; Kvifte, 1999). Researchers have noted that this asymmetrical beat pattern should not be understood as a deviation from an underlying isochronous pulse; instead, the underlying pulse in telespringar should be understood as asymmetrical in and of itself (Groven, 1971; Blom, 1981; Kvifte, 2007; Johansson, 2009; Haugen, 2015). Fiddlers generally stamp their feet while playing telespringar, and while performance style differs among performers, foot stamping is considered an integral part of Hardanger fiddle playing as well as an expression of the meter (see, e.g., Kvifte, 1983; Blom, 2006; Ahlbäck, 2003). In telespringar playing, fiddlers usually stamp their feet on the first and second beats but only sometimes on the third beat. The foot stamp on the first beat is considered the strongest, and the foot stamp on the third beat, the weakest (Kvifte, 1999; Blom, 2006).
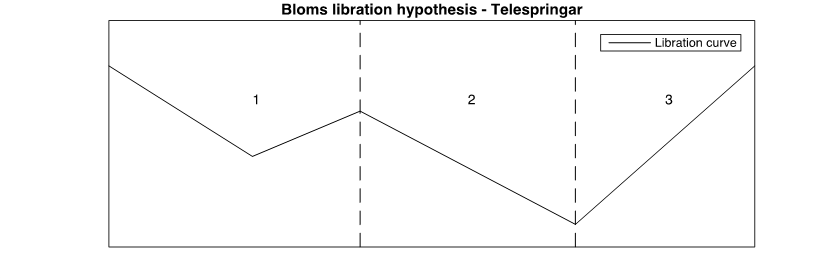
Figure 1. A representation of the dancers' libration pattern for telespringar, as suggested by Blom (1981) and adapted from Blom (1981; Figure 7, p. 309). The vertical motion of the dancers' center of gravity can be represented as a straight line between the turning points in the libration curve. In telespringar, the first down/up motion corresponds to the longest beat (beat 1); the second down motion corresponds to the medium-length beat (beat 2); and the second up motion corresponds to the shortest beat (beat 3).
The intimate relationship between music and dance in traditional Norwegian folk music is often emphasized in rhythm studies of telespringar (see, e.g., Bakka, 1978; Blom, 1981; Omholt, 2009). Telespringar dance is performed by couples, usually positioned in a ring formation that moves counter-clockwise (Blom, 1981). There are three main variants upon the motion pattern in springar dances: a winding part, in which the dancers turn under each others' arms while moving along the line of dance; an unfastened part, in which the dancers dance independently along the line; and a couple turning part, in which the dancers turn around together (Bakka et al., 1995). The springar dance is improvised, and the way in which dancers hold one another and execute the main motion patterns will vary considerably (Blom, 1981; Mårds, 1999). The footsteps in telespringar dancing also vary, partly in relation to the way in which the dancers turn. Previous studies have proposed that, despite all of this variation and improvisation, the vertical motion of the dancers' center of gravity seems to follow a regular pattern (Blom, 1981; Kvifte, 2004). Blom calls this the patterned libration of the body's center of gravity and shows how this libration pattern can be represented as straight lines between the turning points (peaks and troughs) in the dancers' libration curve. The dancers' libration pattern is thought to be style specific and directly linked to the musical meter (Blom, 1981). In telespringar dancing, Blom suggests that the libration curve consists of two down/up motions in every measure. According to Blom (1981, 1993, 2006) the first down/up motion corresponds to the duration of the first beat, while the second down motion corresponds to the duration of the second beat and the second up motion corresponds to the duration of the third beat. A representation of Blom's libration hypothesis for telespringar is displayed in Figure 1. From this perspective, the rhythm patterns in telespringar seem to imply an understanding of the corresponding dance—that is, the production and perception of these rhythms require some bodily knowledge of the style itself (Blom, 2006).
Method
In this paper, I seek a better understanding of the underlying reference structure in telespringar through an investigation of periodic patterns in the sound and the body motion of both the fiddler and the dancers, and in the correspondence between them. Based on the previous observations and theories referred to above, I hypothesize that:
- The underlying reference structure in telespringar is asymmetrical, that is, it consists of beats of uneven durations (e.g., Groven, 1971; Blom, 1981; Kvifte, 2007; Johansson, 2009).
- The underlying beat duration pattern as expressed in the fiddler's integrated foot stamping (Kvifte, 1999; Ahlbäck, 2003; Johansson, 2009) is present in the vertical motion of the dancers' center of gravity (Blom, 1981, 1993, 2006; Kvifte, 2004).
- Beat related sonic events correspond to this shared underlying reference structure.
Toward this end, I recorded skilled performers as they played and danced telespringar using an infrared motion capture system and sound and video recording. The focus of the study is on the underlying beat level. Accordingly, the sound analysis concentrates on beat-related sonic events, and the motion analysis concentrates on the fiddler's periodic foot stamping and the dancers' periodic vertical body motions.
Participants and Equipment
Three skilled telespringar performers, one fiddler and two dancers, participated in the study. The fiddler played telespringar on a traditional Hardanger fiddle, and the dancers performed the telespringar dance. The performers' body motions were recorded using an optical infrared motion capture system from Qualisys 4 that consisted of nine Oqus 300 and four Oqus 400 cameras, tracking at a frame rate of 200 Hz. The sound was recorded using Logic Pro X 5 and played back using Reaper. 6 The sound and the motion caption recordings were synchronized using a custom-built Max/MSP patch, all running on a Macintosh. In addition, the performances were video recorded for reference purposes.
Placement of the Markers
Twenty markers were attached to the fiddler's body, including one control marker. In addition, four markers were attached to the fiddle and two to the bow. Thirty reflective markers were attached to each of the dancers' bodies, including six control markers on each dancer. The control markers were positioned slightly differently on the two dancers' bodies, in order to distinguish between them. Marker placement on the fiddler, the fiddle, and the dancers is presented in Figure 2 (see also Appendix A).
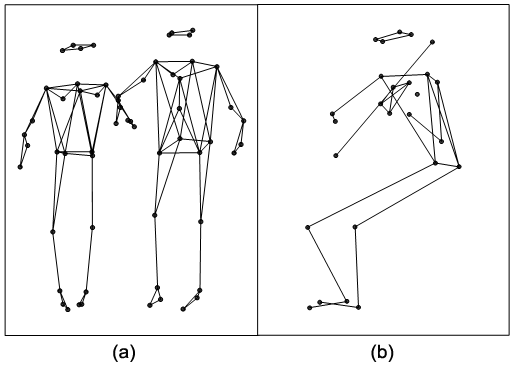
Figure 2. The placement of the markers attached on (a) the dancers and (b) the fiddler.
Recordings
All recordings were carried out in the fourMs motion lab at the Department of Musicology at the University of Oslo. 7 In order to investigate different aspects of music and motion correspondence, and the interaction between the performers in telespringar, we completed a total of ten recordings with three different setups. In session I, the fiddler was recorded alone while playing telespringar on the Hardanger fiddle. In session II, the dancers were recorded alone, dancing to the previous recording. In session III, the fiddler and the dancers performed and were recorded together. An overview of the recordings is presented in Table 1. The present paper only addresses the recordings from session III.
| Session | Participants | Tunes | Comments |
| I | Fiddler (solo) | Urjen | Concert version |
| Sud-Kåsen | Concert version | ||
| Urjen | Dance version | ||
| Sud-Kåsen | Dance version | ||
| Jøronatten | Concert tune | ||
| II | Dancers (solo) | - | Without music |
| Urjen | Dance version | ||
| Sud-Kåsen | Dance version | ||
| III | Fiddler and dancers | Urjen | Dance version |
| Sud-Kåsen | Dance version |
Analyses and Results
The collected motion data was analyzed using the MoCap Toolbox for Matlab (Burger & Toiviainen, 2013) and custom-made Matlab scripts. The sound data was analyzed using Sonic Visualiser, Amadeus Pro, MIR Toolbox for Matlab (Lartillot & Toiviainen, 2007), and custom-made Matlab scripts.
The Fiddler's Foot Stamping
As previously mentioned, the fiddler's foot stamping is considered integral to Hardanger fiddle playing and may also express the meter in telespringar. I therefore sought to investigate the rhythm pattern of the fiddler's foot stamping through the recordings. The fiddler in the study appears to stamp his feet in the same manner in all of the recordings. A visualization of the vertical position of the fiddler's foot motion reveals that he stamps his left toe and right heel simultaneously two times in every measure, and his right toe once in every measure. Consequently, the rhythm pattern of the fiddler's foot stamping could be estimated based on the vertical motions of his toes. In order to determine the temporal points when the fiddler's toes hit the floor, the acceleration was calculated by applying a second order derivation with a Savitzky-Golay FIR smoothing filter (filter length of 5 frames) to the collected position data. Visualizations of the vertical position and acceleration of the fiddler's left and right toe are presented in Figure 3.
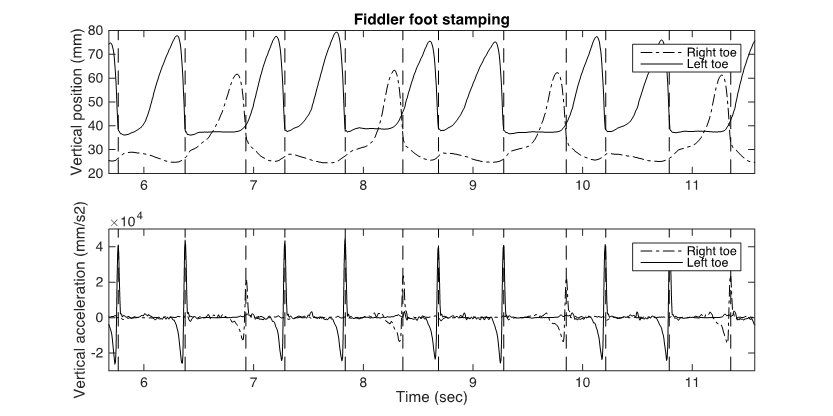
Figure 3. Plots showing an example of the vertical position (top) and the corresponding vertical acceleration (bottom) of the fiddler's right and left toes. The points in time when the toes hit the floor are indicated by the vertical dashed lines.
The plots of the fiddler's toes in Figure 3 indicate that the peaks in acceleration correspond to the fiddler's foot stamping. In order to produce a representation of the beat duration pattern based on the fiddler's foot stamping, I applied a function that picked peaks over a threshold of 10,000 mm/s2 to the acceleration data. The intervals between the acceleration peaks (durations) were calculated and subsequently converted into percentages, according to their percentage of the measure. Finally, the mean duration of the first, second, and third beats, as indicated by the fiddler's foot stamping, were calculated. The mean beat durations with corresponding standard deviations (SD) for both Urjen and Sud-Kåsen are presented in Table 2.
Table 2 indicates that the first, second, and third beats have different mean durations in Urjen and Sud-Kåsen, respectively. I then compared those durations using analysis of variance (ANOVA). A one-way ANOVA showed significant differences between the durations (all p < .001) for both tunes, and Bonferroni corrected post-hoc pairwise comparisons (First-Second, First-Third, Second-Third) showed significant differences between all the beat types (p < .001 for Urjen and p < .01 for Sud-Kåsen). These results suggest that the foot stamping follows a long–medium–short beat duration pattern. 8
| Tunes | Measures | Mean beat duration in % (SD) | Duration Patterns | ||
| First | Second | Third | |||
| Urjen | 146 | 39 (2.2) | 36 (2.9) | 25 (1.6) | long–medium–short |
| Sud-Kåsen | 118 | 39 (1.5) | 38 (1.8) | 23 (1.3) | long–medium–short |
Correspondence between the Fiddler's Foot Stamping and the Beat Level in the Musical Sound
If the fiddler's foot stamping represents an underlying reference structure at beat level, one might assume that the foot stamping corresponds to beat related events in the audio signal. In order to investigate this possibility, I had to locate beats based on the sound signal. The beginnings of musical events can sometimes be discerned in a sudden increase in energy in the sound signal. These energy peaks can be detected by applying a peak picking function to an envelope curve (the outer shape of the audio waveform). However, the Hardanger fiddle is a bowed instrument, the sound of which is produced through continuous bowing motions that do not generate acute amplitude peaks. In addition, the style of Hardanger fiddle playing is very ornamented and relies upon the extensive use of slides and grace notes. Hence, rhythm structures based on the sound signal of Hardanger fiddle playing are not easily detected.
The complexity of Hardanger fiddle sound also becomes clear when investigating the visualizations of the telespringar sound. I plotted the amplitude waveforms and the envelope curves, showing fluctuation in energy (see Figure 4a/b and Figure 5a/b), the spectral flux, indicating contrasts in the spectrogram (see Figure 4c and Figure 5c). In addition, a complex domain onset detection function (Complex DF; Duxbury et al., 2003) implemented in Sonic Visualiser, was applied to the sound signal and plotted as a curve whose peaks indicate important changes in the energy and phase domain combined (see Figure 4d and Figure 5d). In his thesis on asymmetrical grooves in Norwegian folk music, Mats Johansson (2009) developed a technique for manually determining the temporal positions of beat-related musical events using software that displayed the waveform and played back the music simultaneously. By moving his cursor back and forth, he could select the beginnings of musical events that were closest to a beat. I used a similar procedure but relied on Sonic Visualiser displaying the audio waveform, an envelope, a curve showing the spectral flux, and an onset curve from the Complex DF while simultaneously playing back the music in order to manually pick beat related peaks from the plots. When one investigates the waveform and the envelope curve, it becomes clear that the arrivals of new musical events do not result in higher energy levels. The curves showing spectral flux and Complex DF do show peaks, however the arrivals of new musical events are not represented by one unambiguous peak but by several, or a cluster of peaks. Naturally, the more complex the sound signal, the less clear the musical events are in the curves, but even the most straightforward musical events seem to be represented by multiple peaks rather than a single peak. For example, in one of the phrases early in the recording of Sud-Kåsen, the first three quarter notes can be discerned in the Complex DF curve as multiple peaks, whereas the following quarter notes are less clear (see Figure 4d). Even when moving the cursor back and fourth, starting the play back of the sound from different temporal points indicated by the peaks, it is unclear which peaks, if any, represent the musical events' actual perceptual onsets. When one listens to the recordings of Sud-Kåsen and Urjen, one perceives a beat level in the music to be synchronized with the fiddler's foot stamping, but any attempt to determine beat positions based on the physical sound signal proved fruitless.
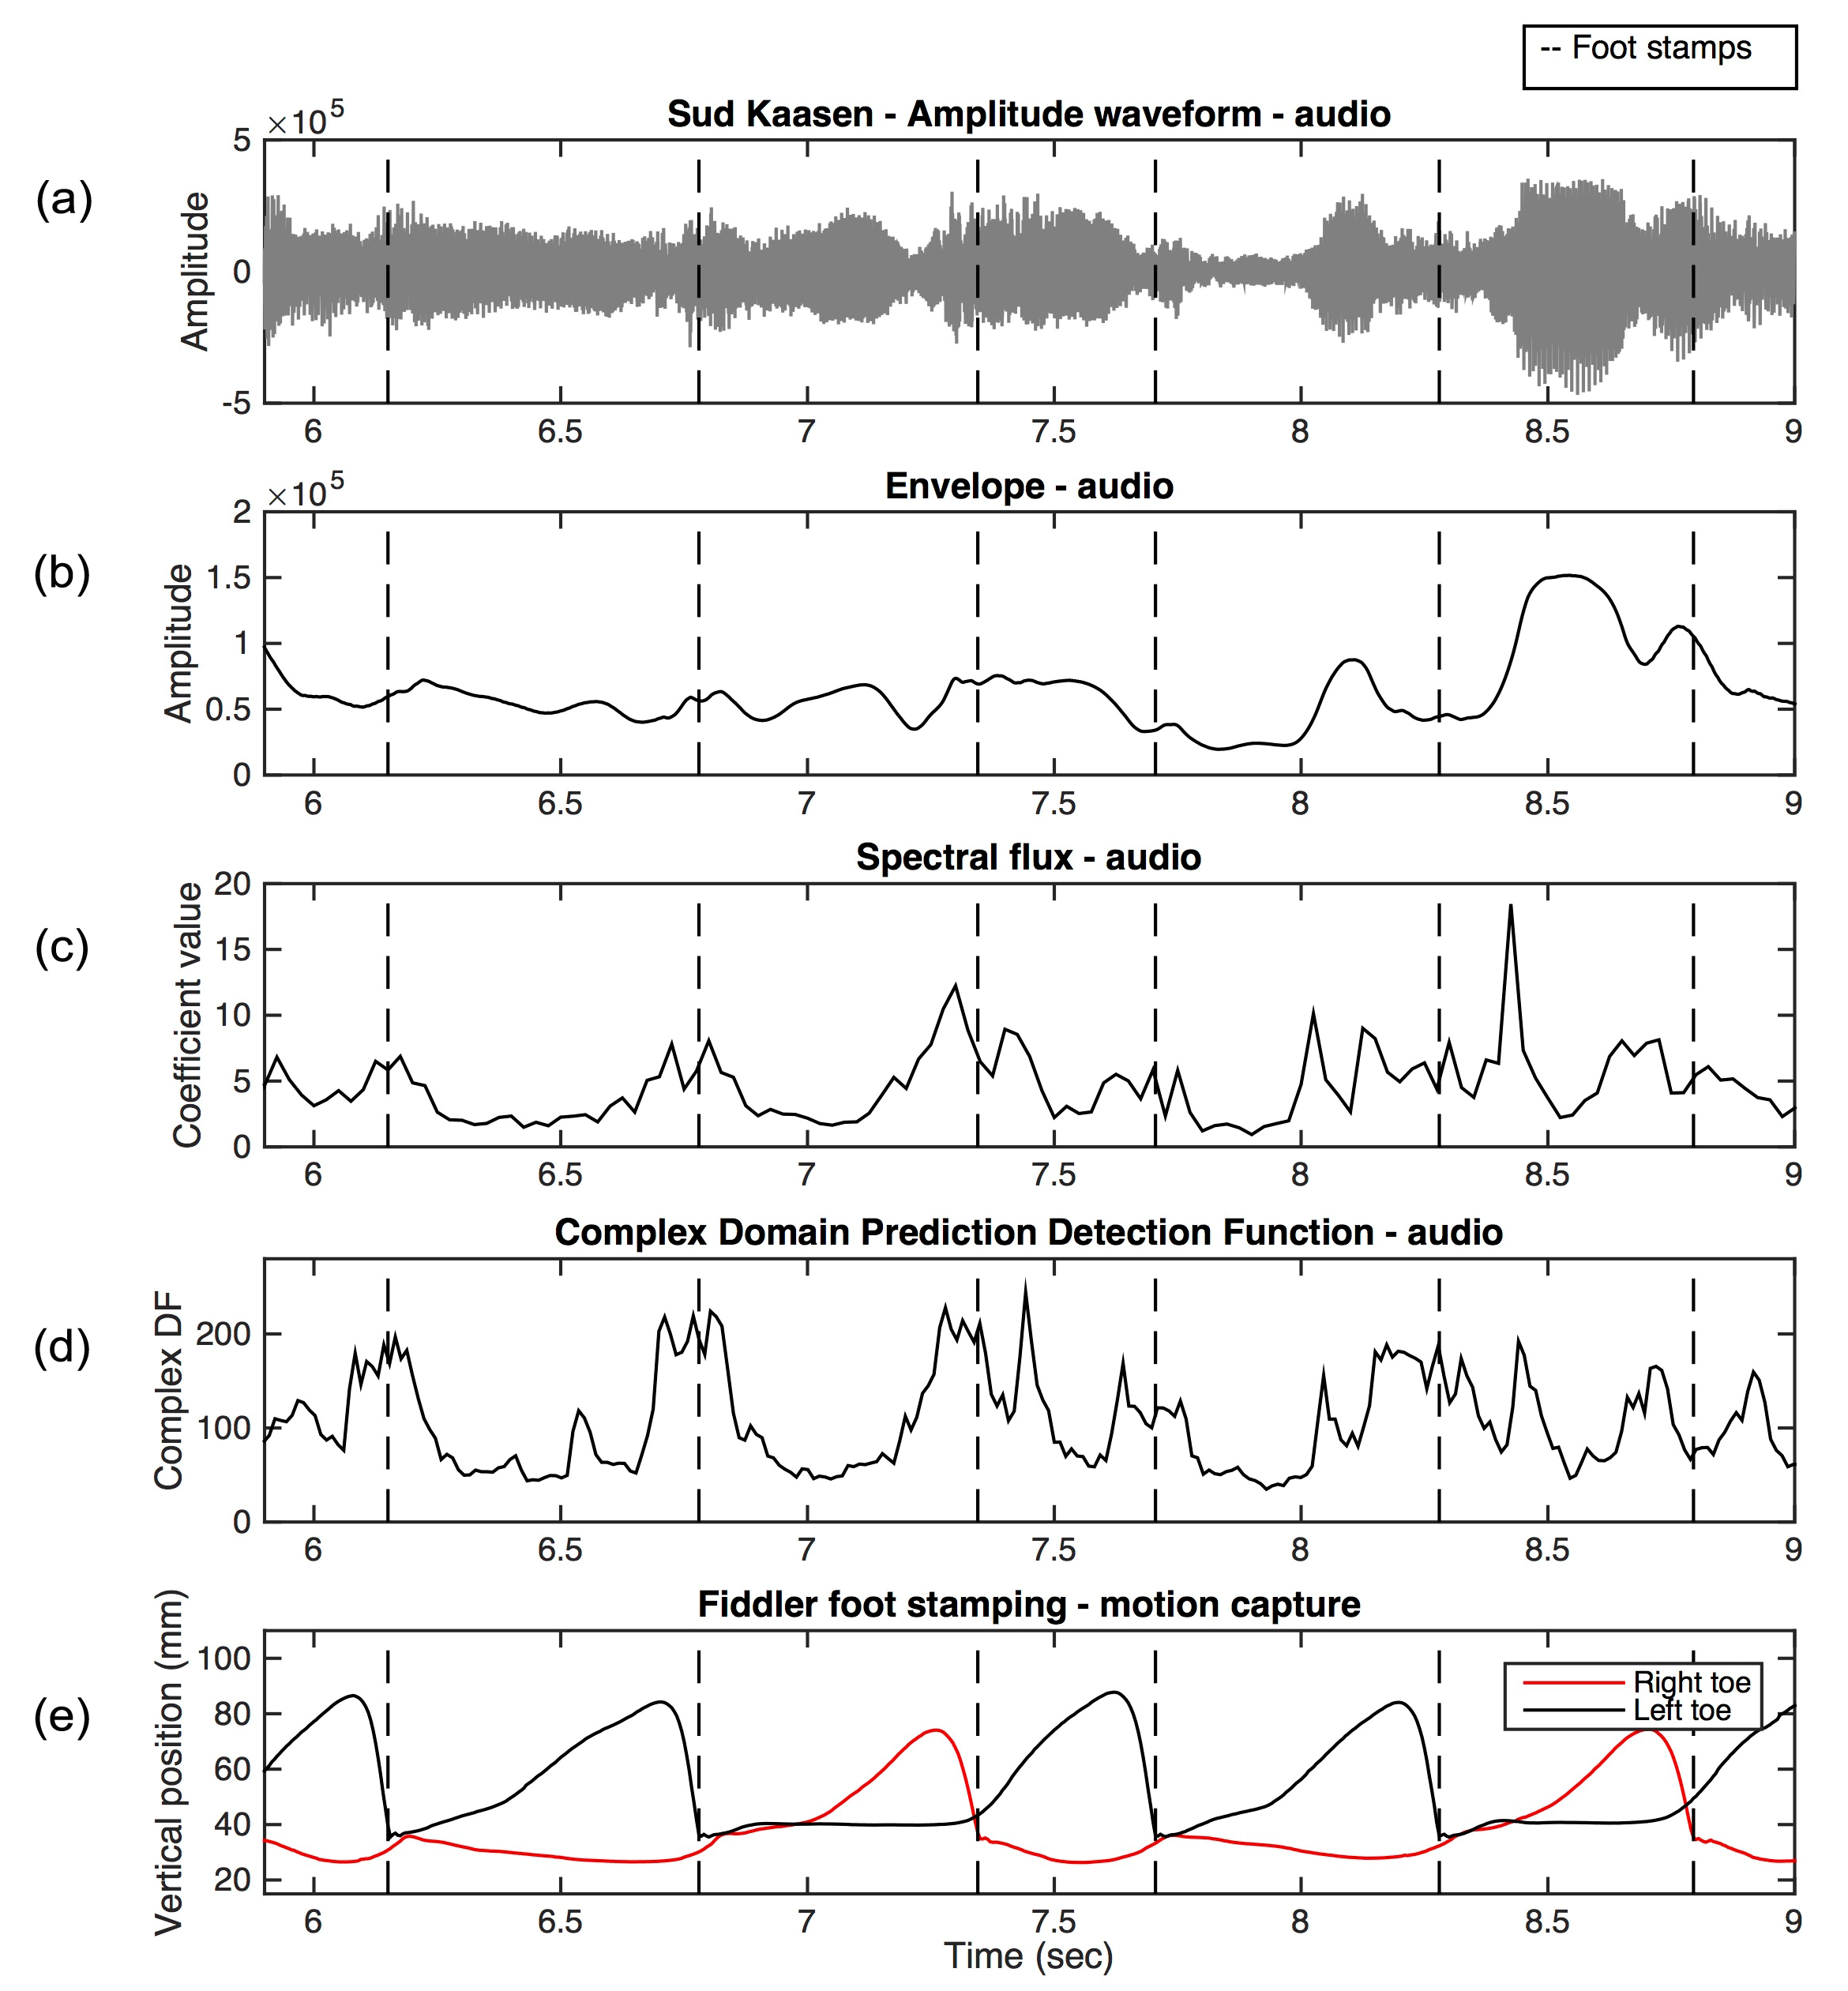
Figure 4. The correspondence between the audio signal and the fiddler's foot stamping in Sud-Kåsen visualized as the (a) waveform with the corresponding, (b) audio envelope, (c) spectral flux, (d) the onset curve based on the complex domain prediction detection function, and (e) the vertical motions of the fiddler's toes. The temporal beat positions, estimated from the fiddler's foot stamping, are indicated by vertical dotted lines in the plots.
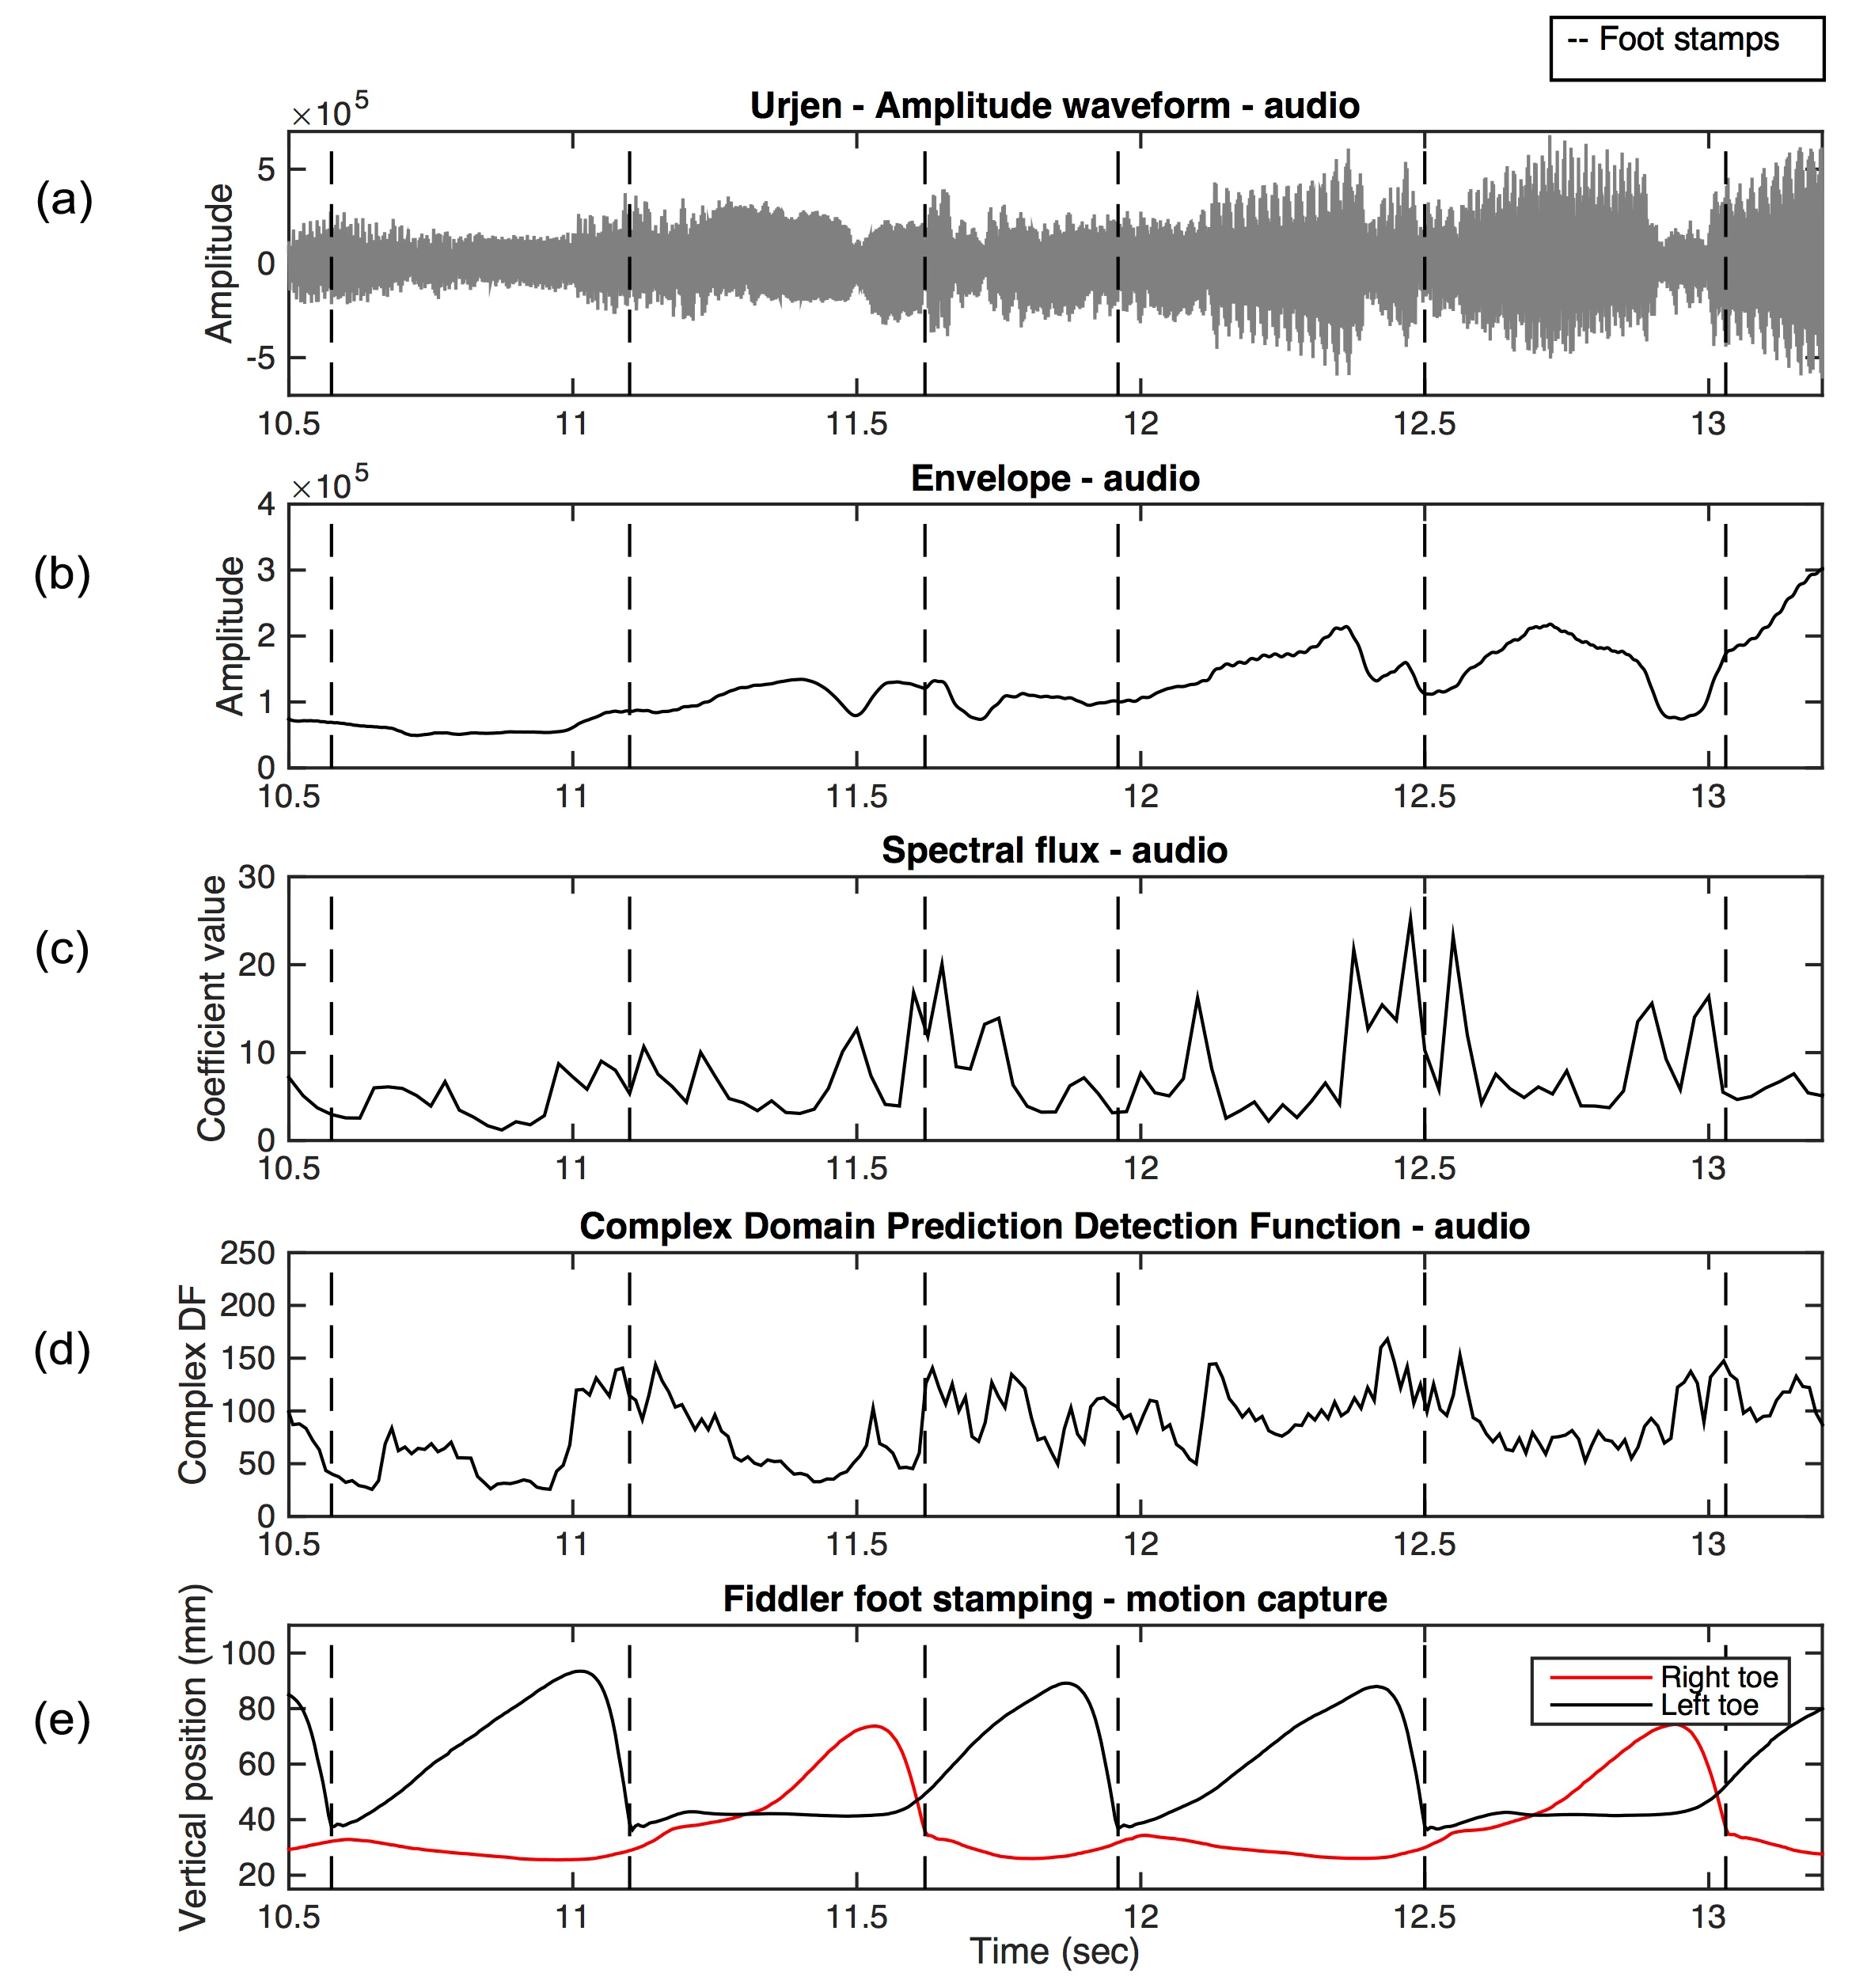
Figure 5. The correspondence between the audio signal and the fiddler's foot stamping in Urjen visualized as the (a) waveform with the corresponding, (b) audio envelope, (c) spectral flux, (d) the onset curve based on the complex domain prediction detection function, and (e) the vertical motions of the fiddler's toes. The temporal beat positions, estimated from the fiddler's foot stamping, are indicated by vertical dotted lines in the plots.
The Patterned Libration of the Body's Center of Gravity in the Telespringar Dancing
In traditional Norwegian folk dance, the vertical motion of the dancers' center of gravity is thought to follow a regular pattern. According to Blom's (1981, 1993, 2006) libration hypothesis, the vertical motion of the dancers' center of gravity in telespringar is composed of two down/up motions in each measure, with the second one being slightly deeper than the first (see Figure 1). In order to investigate whether the shape of the dancers' libration curves in the present study correspond to Blom's libration hypothesis, I plotted the vertical motion of the markers attached to the dancers' right back hip together with a visualization of Blom's libration hypothesis (see Figure 6). The markers attached to the dancers' right hip were chosen both because they were located near the dancers' center of gravity and because there were almost no missing frames in the data obtained from these markers. The gaps in the data were gap-filled by linear interpolation. The plots presented in Figure 6 indicate that the shape of the dancers' libration curves accords with Blom's libration hypothesis.
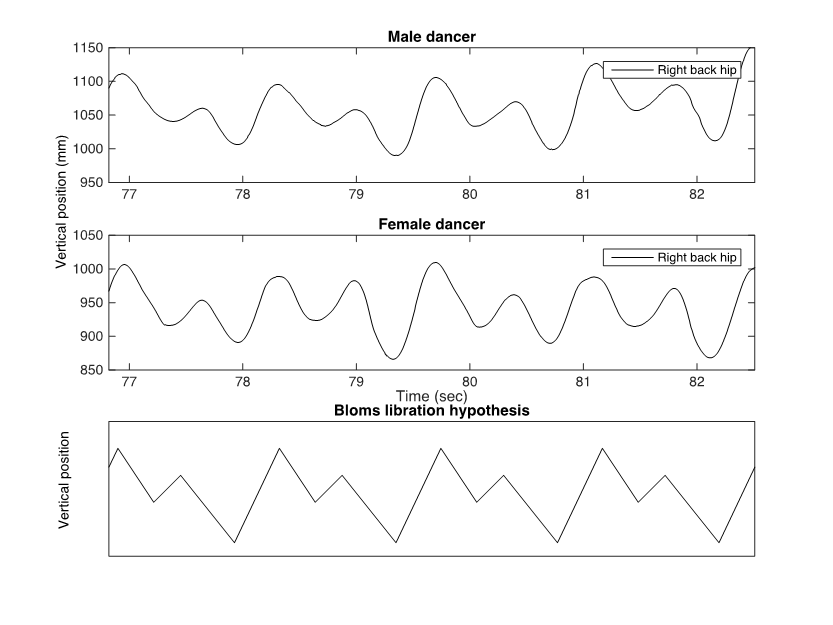
Figure 6. Plots showing the vertical motions of the dancers' hips and a visualization of Blom's libration hypothesis. The shape of the vertical motions of the dancers' hips seems to accord with Blom's libration hypothesis.
Since the dancers' libration pattern is typically understood to remain consistent throughout the dance performance, I wanted to see how stable the dancers' libration curves actually were. According to Blom's libration hypothesis the highest peaks in the libration curve correspond to the beginning of each measure (see Figure 1). In order to determine the start of each libration period, a custom made Matlab function that picked peaks in a graph based directional changes was applied to the dancers' libration curves. The peak corresponding to the first dance beat (the highest peak) was used as a starting point for the libration pattern in each cycle. The libration curves were then divided into measures, as defined by the first dance beat in each cycle, and plotted together. Since I was interested in the shape of the librations, not their exact measurements, the libration curves were normalized by the root mean square (RMS) of each curve. The plots in Figure 7 include all of the libration curves defined by the first peak in each libration pattern for each dancer for each tune. Both dancers' libration patterns consist of two down/up motions, the last one being slightly deeper than the first. This accords with Blom's hypothesis (see Figure 1). The plots in Figure 7 show that the shape of the libration curves is approximately the same in every measure, for both dancers in both tunes. This supports the view that the shape of the libration is in fact very stable over time.
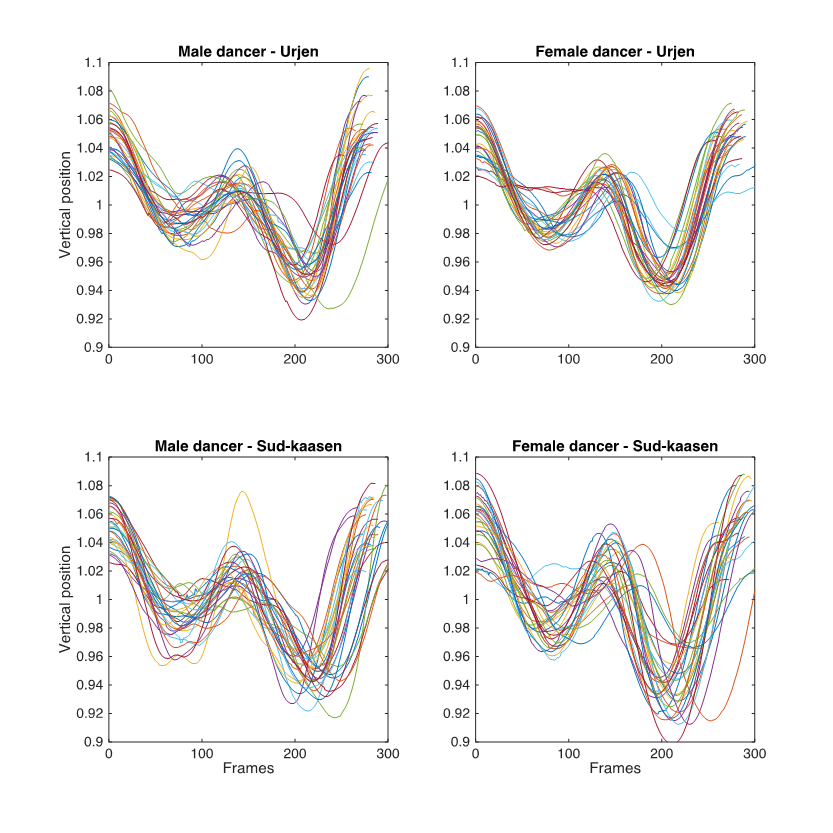
Figure 7. Plots showing the vertical motion of the marker attached to the dancers' right back hip. The libration curves are chunked into measures, as defined by the first dance beat in each cycle, and normalized by RMS of each curve.
According to Blom's (1981) hypothesis, a dancer's libration curve is related to the musical meter—that is, the first down/up motion corresponds to the duration of the first musical beat, the second down motion corresponds to the duration of the second musical beat, and the second up motion corresponds to the duration of the third musical beat (see Figure 1). In order to investigate the dancers' beat duration patterns based on the libration curves, I applied a mathematical function that picked peaks and troughs in a graph to each individual libration curve. In this way, the dance beats' corresponding peaks and troughs were extracted. Because it might take some time to "get into the groove," the first four dance measures in each recording were excluded from the analysis. In addition, one measure where the male dancer performed only one down/up motion instead of two was excluded in the analysis of Urjen. The durations of dance beats were estimated using the extracted peaks and troughs and converted into percentages, according to their percentage of the measure. The mean beat durations in percentages with corresponding standard deviations (SD) based on the turning points in the dancers' libration curves are presented in Table 3.
| Tunes | Dancer | Measures | Mean relative beat durations in % (SD) | Duration patterns | ||
| First | Second | Third | ||||
| Urjen | Male | 141 | 49 (5.8) | 27 (5.9) | 24 (3.9) | long-medium-short |
| Female | 141 | 50 (3.2) | 25 (3.5) | 25 (3.5) | long-short-short | |
| Sud-Kåsen | Male | 114 | 48 (4.6) | 28 (5.0) | 25 (2.5) | long-medium-short |
| Female | 114 | 49 (6.3) | 24 (5.0) | 26 (2.5) | long-short-medium | |
| Average (mean of means, N = 456): | 49 (5.1) | 26 (5.1) | 25 (3.2) | long-medium-short | ||
In order to investigate which of the variables dancer, tune, and beat type (first, second, or third beat) is responsible for most variation in the data, a repeated-measures three-way ANOVA was conducted for all beats, with dancer, tune, and beat type as the independent variables and beat durations as the dependent variable. The result showed significant main effects for beat type [F(1.8, 203.82) = 2917.34, p < .001, partial η2 = .96] and a significant interaction between the dancer and the beat type on the beat duration [F(1.44, 162.3) = 19.6, p < .001, partial η2 = .15]. No significant main effects were found for dancer [F(1, 113) = .85, p = .358] or tune [F(1, 113) = .01, p = .922], and there was no significant interaction between dancer and tune [F(1, 113) = 1.13, p = .29], tune and beat type [F(1.43, 161.1) = 2.72, p = .087] or dancer, tune and beat type [F(1.63, 183.88) = 2.09, p = .136]. Bonferroni corrected post-hoc tests of pairs of averaged mean beat durations showed significant differences between all beat types (all p < .01), suggesting an overall long–medium–short duration pattern.
I also wanted to investigate each dancer's beat duration pattern in each tune, based on the turning points in their libration curves. A one-way ANOVA showed significant differences between the durations (p < .001). For the male dancer, Bonferroni corrected post-hoc tests showed significant differences between all beat durations (p < .001), suggesting a long–medium–short duration pattern in both tunes, based on his libration curves. For the female dancer, on the other hand, significant differences were found between the first beats and the second and third beats in both tunes (all p < .001), and between the second and third beats in Sud-Kåsen (p < .01), but no significant differences were found between the second and third beats in Urjen (p = 1.00), indicating a long–short–short duration pattern for the female dancer in Urjen and a long–short–medium duration pattern in Sud-Kåsen.
Comparing the Fiddler's and Dancers' Beat Duration Patterns
The beat duration patterns obtained from the fiddler's foot stamping and the turning points in the dancers' libration curves indicate that all of the performers (that is, the fiddler, the male dancer, and the female dancer) work from different duration patterns. In order to investigate this more in detail, I compared the mean durations for the first, second, and third beats derived from the fiddler's foot stamping and the two dancers' libration curves for the recordings of Urjen and Sud-Kåsen, respectively. One-way ANOVAs showed significant differences between the durations (all p < .01 for Urjen and all p < .001 for Sud-Kåsen). For Urjen, Bonferroni corrected post-hoc tests showed significant differences between all of the second beat durations (all p < .001) and between the fiddler's first beat duration and both of the dancers' first beat durations (both p < .001). For Sud-Kåsen, significant differences were found between all of the beat durations for all beat types (all p < .001) except for the male and female dancers' first beat (p = .08). This result indicates not only that the female and male dancers' beat duration patterns, as defined by the turning points in their libration curves, seem to differ from the fiddler's beat duration pattern, but also that they seem to differ from one another.
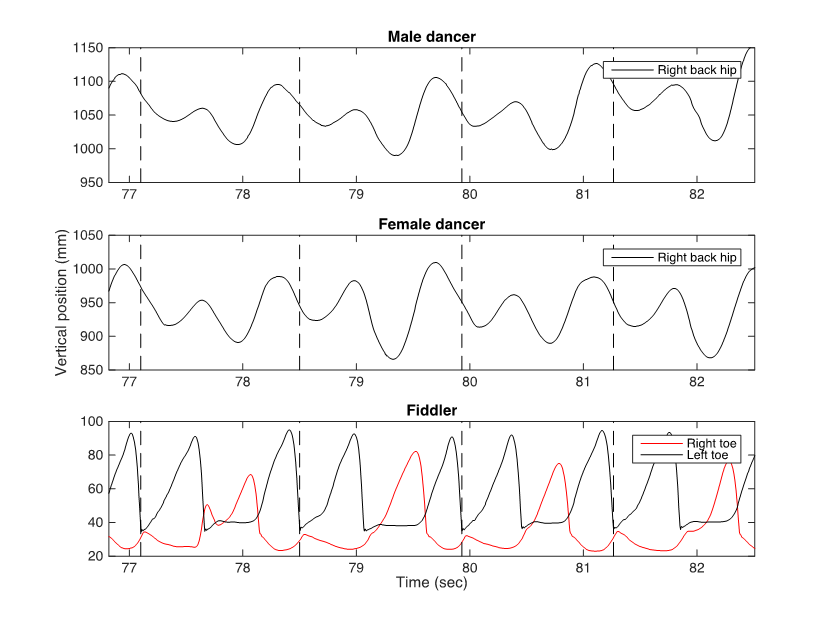
Figure 8. Plots showing the vertical motions of the dancers' hips and the vertical motion of the fiddler's foot stamping for four measures. The dancers' libration curves seem to follow a periodic pattern that corresponds to the measure level as defined by the fiddler's foot stamping. The temporal positions of the first beat in every measure, estimated from the fiddler's foot stamping, are indicated as vertical dashed lines.
An Alternative Interpretation of the Correspondence between the Fiddler's Foot Stamping and the Dancers' Libration Curves
Although the fiddler's foot stamping and the turning points in the dancer's libration curves do not seem to be synchronized, manual visual inspection of Figure 8 indicates that the dancers' libration curves follow a periodic pattern that corresponds to the measure level as defined by the fiddler's foot stamping. Moreover, chunked plots showing the vertical motion of the marker attached to the dancers' right back hip (Figure 7) show that the shape of the libration curve is also very stable over time. These observations indicate a relationship between the fiddler's foot stamping and the dancers' libration curves. Also, looking at the video, one has the impression that the lowest trough in the libration curve is related to the second beat in the music. In order to investigate how stable the libration curves were in relation to the fiddler's foot stamping, I divided the libration curves into measures, not by the turning points in the libration curves, as in Figure 7, but by the first beat as determined by the fiddler's foot stamping. Subsequently, the libration chunks were normalized by RMS and plotted together in order to generate an impression of the stability of the motion over time (see Figure 9). When divided by the fiddler's foot stamping, the libration patterns do not start at a turning point, but in the middle of a downward motion just before a turning point. This "half" down motion is followed by an up/down and an up/"half" down motion. This pattern is repeated in each measure for each dancer in both tunes indicating that the libration curves are stable, also when parsed according to the fiddler's foot stamping.
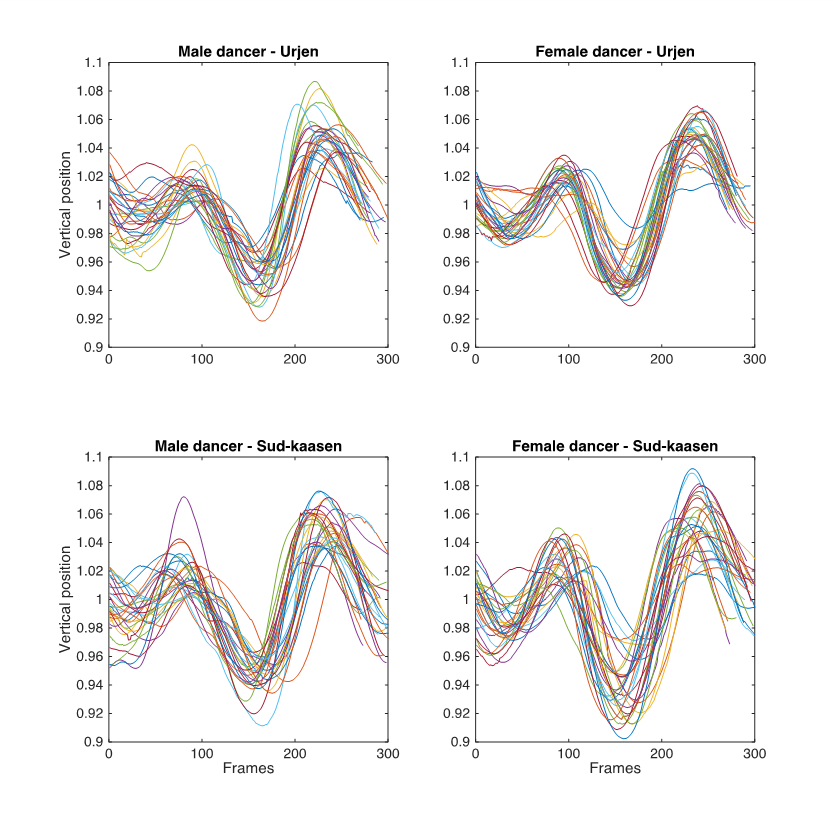
Figure 9. Plots showing the vertical motions of the male and female dancers' hips, chunked into measures according to the fiddler's foot stamping, normalized by RMS of each curve, and plotted in the same plot.
Since the libration curves seem to be stable over time at measure level according to the fiddler's foot stamping, I wanted to investigate whether they were stable at beat level as well. Consequently, I divided the libration curves into beats in accordance with the fiddler's foot stamping, normalized by each curve's RMS. The chunks corresponding to the first, second, and third beats were plotted in the same plot, respectively (see Figure 10).
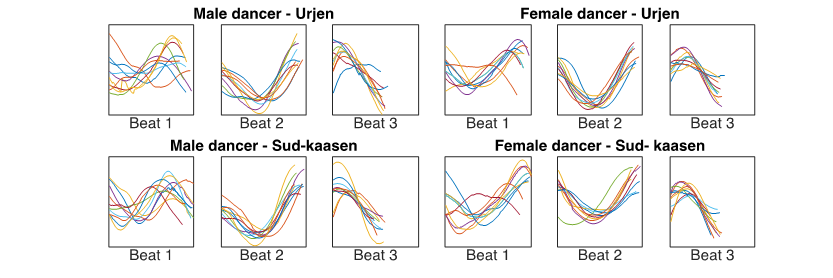
Figure 10. Plots showing the libration curves of the male and female dancers, divided into beats in accordance with the fiddler's foot stamping. The dancers' libration curves seem to follow the same motion pattern at beat level over time.
The plots in Figure 10 indicate that the shape of the libration curves is stable over time at beat level in relation to the fiddler's foot stamping. The second beat duration, in particular, seems to correspond to the dancers' deepest down/up motion. Blom's (1981) libration pattern hypothesis takes as point of departure that the turning points in the dancers' libration curves is synchronized with musical meter and the fiddler's foot stamping. The motion analysis of the dancers' libration curves in this study, however, does imply that it is not the turning points in the libration curve that corresponds to the fiddler's foot stamping but the libration shape that corresponds to the beat duration pattern indicated by the fiddler's foot stamping. The duration of the first beat seems to correspond to a vertical S-shape; the duration of the second beat corresponds to the deepest down/up motion; and the duration of the third beat corresponds to the final short up/down motion (Figure 10). These findings suggest an alternative interpretation of the correspondence between the beat level, as indicated by the fiddler's foot stamping, and the dancers' periodic libration pattern (Figure 11). The shape of the alternative libration curve and Blom's librations hypothesis is identical, but the alternative libration curve's position is phase shifted in relation to the beat level.
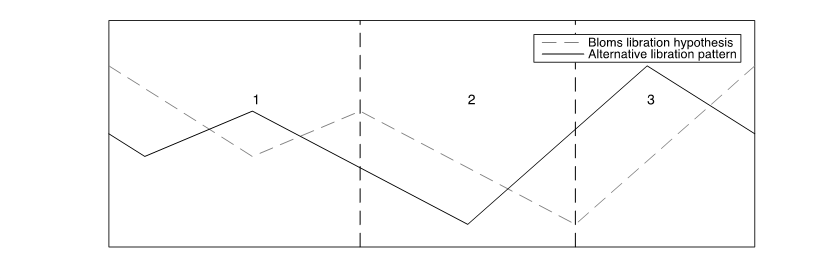
Figure 11. An illustration showing Blom's libration hypothesis (dashed line) and an alternative interpretation of the correspondence between the beat level, as indicated by the fiddler's foot stamping, and the dancers' libration pattern (solid line). The shape of the alternative libration pattern is identical to Blom's libration hypothesis, but its position in relation to the beat level is phase shifted.
To get an impression of how the data collected in this study corresponds with the alternative libration curve, I plotted the dancers' libration curves together with the temporal positions of the fiddler's foot stamping, both based on the actual measurements, and a visualization of the alternative libration curve for four measures (Figure 12). Vertical lines represent the temporal positions of the underlying beat pattern, as indicated by the fiddler's foot stamping. The first beat is represented by a vertical solid line and the second and third beats are represented by vertical dashed lines. The plots in Figure 12 show that the shape of the dancers' measured libration patterns, divided into beat durations as indicated by the fiddler's foot stamping, accords with the alternative libration hypothesis.
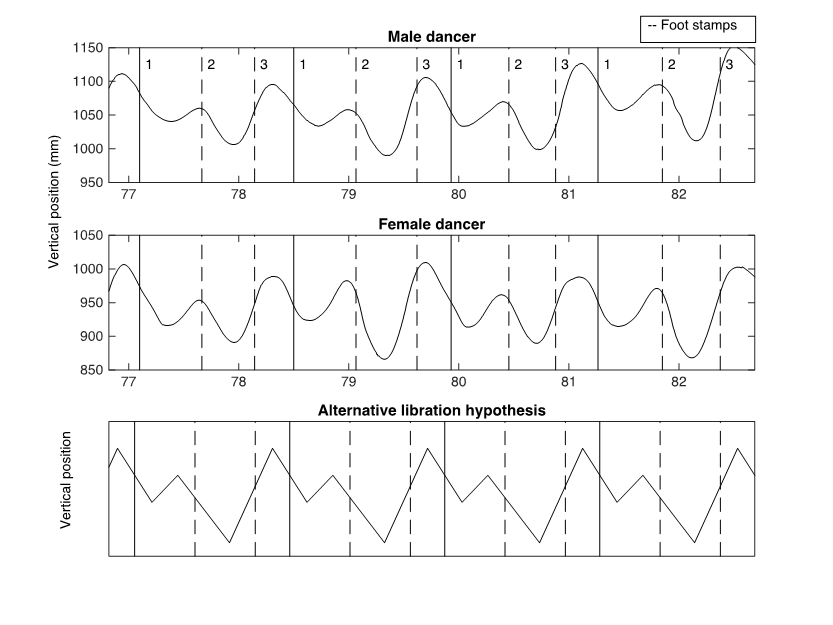
Figure 12. Plots showing the vertical motions of the dancers' hips and a visualization of the alternative libration hypothesis for four measures. The first beat in each measure is represented by vertical solid lines and the second and third beats are represented by vertical dashed lines. The plots of the dancers' libration curves and the fiddler's foot stamping is based on the data collected in this study, whereas the alternative libration hypothesis is a standardized model. The shape of the vertical motions of the dancers' hips, divided by the fiddler's foot stamping, seems to accord with the alternative libration hypothesis.
Discussion
In this paper, I sought to investigate whether performers' periodic body motion in telespringar performance could be understood as an expression of an underlying reference structure, and how this motion might correspond to beat related sonic events in the musical sound. The fiddler's foot stamping is thought to be an integral part of telespringar playing, and it has been suggested that it is related to the asymmetrical beats of the genre (Kvifte, 1983; Ahlbäck, 2003; Blom, 2006). The motion analysis of the fiddler's foot stamping in this study revealed a stable asymmetrical long–medium–short duration pattern at beat level, which agrees with previous observations and findings (Groven, 1971; Blom, 1981; Mårds, 1999; Haugen, 2015). Determining how this pattern corresponds to beat related musical events in the sound signal is no easy task. Unlike the unambiguous acceleration peaks in the fiddler's foot stamping, there are no immediate changes in the sound signal to indicate the obvious onset of a new music event, in either the energy domain or the spectral flux, or in their combination. The sound of Hardanger fiddle playing can be characterized as "flowing," and many things contribute to this quality. The Hardanger fiddle is a bowed instrument, so the arrival of a new musical event does not necessarily result in a sudden change in the sound signal; in addition, the temporal position of the perceptual attack point (Wright, 2008) is ambiguous at best. Likewise, the style of fiddle playing is very ornamented, and musical events are often characterized by a slide or grace note at the very beginning of the event (Johansson, 2010). 9 The resonating sympathetic strings also contribute a drone that makes it even more difficult to extract rhythm structures from an analysis of the sound signal. A complex domain onset detection function (Duxbury et al., 2003), combining energy-based and phase-based approaches, and a curve indicating contrasts in the spectrogram (spectral flux) indicated that the arrival of new musical events could be recognized in some short sections of the music, not as unambiguous peaks but as clusters of peaks. However, it was not possible to determine which of these peaks, if any, represented beat related musical events.
Despite the initially unclear beat patterns in the actual sounding music, people familiar with the style of telespringar can readily determine the temporal positions of the beats, as is proven by the very stable libration patterns of the dancers in this study. It is commonly agreed that the music and dance of telespringar evolved together and influenced one another, and it has been further suggested that the rhythm structures in the music should be investigated in relation to the motion patterns of the corresponding dance. In this regard, the vertical motion of the dancers' center of gravity, which produces the libration curves, has been highlighted as particularly important. Although the footsteps in telespringar dancing vary, the libration patterns of the dancers seem to be stable. Certain turning points (peaks and troughs) in the dancers' libration curves have been directly related to the beat level in the musical sound and the fiddler's foot stamping (see Figure 1). However, the findings of this study do not support this hypothesis. First of all, the rhythm patterns derived from the turning points in the dancers' libration curves deviate from the fiddler's foot stamping. Secondly, the male and female dancers seem to work from different rhythm patterns despite dancing together to the same music. As pointed out earlier, several metrical interpretations can coexist in certain music styles. One interpretation of these divergent duration patterns may be that the dancers' libration patterns introduce an additional metrical level, implying a polymetric interpretation of telespringar. Yet if the turning points in the dancers' libration curves and the fiddler's foot stamping indicated two possible metrical interpretations, they would have to have a common beat at some point. The libration segments in Figure 10, in which the libration curves are divided in accordance with the fiddler's foot stamping, indicate that neither the peaks nor the troughs in the dancers' libration curves seem to be synchronized with any of the foot stamps. The shape of the libration curves, on the other hand, seem to be very stable over time at both the measure level (Figure 9) and the beat level (Figure 10), as defined by the fiddler's foot stamping. The down/up motion that corresponds to the second beat is particularly similar from measure to measure. It is therefore not the temporal positions of the turning points in the dancers' libration curves that correspond to the temporal positions of the fiddler's foot stamping, but the libration shape that corresponds to the beat duration pattern indicated by the fiddler's foot stamping. Based on this finding, an alternative libration curve (Figure 11) has been suggested. The shape of the alternative libration curve is identical to Blom's (1981) libration curve, but its position in relation to the fiddler's foot stamping has been phase shifted.
The libration curves seem to be perfectly synchronized with both measure and beat levels of the fiddler's foot stamping, but, again, not in the arrival of the turning points but rather in the shape of the curve. The acceleration curve based on the fiddler's foot stamping, on the other hand, revealed unambiguous spikes that corresponded to the temporal positions where the fiddler's toes hit the floor. The periodicity and regularity of both the fiddler's foot stamping and the dancers' libration curves, and the correspondence between them, suggest that they have a common understanding of the underlying reference structure, and that this underlying structure may be externalized by the fiddler's foot stamping. Looking at the visualizations of the sound signal together with the fiddler's foot stamping, some clusters of onset peaks in the sound signal may correlate with the fiddler's foot stamping (see Figure 4 and Figure 5). One reason why telespringar rhythm structures cannot be analyzed correctly based on the sound signal alone may therefore be that the perception and production of those structures happen in relation to the corresponding body motions—that is, they are produced and perceived in relation to an embodied reference structure that is present in the dance and in the fiddler's body motion. In that sense, the perception and production of telespringar depend upon an embodied tacit knowledge of the underlying asymmetrical reference structure.
Conclusions
This paper investigates periodic rhythm patterns in music and body motions in Norwegian telespringar and argues that the underlying reference structure (meter) in telespringar is asymmetrical—that is, it consists of beats of uneven duration—and that this is tacitly embodied knowledge among people who are conversant with telespringar. I argue that this underlying asymmetrical structure is indicated by the fiddler's regular foot stamping and corresponds to the dancers' stable libration patterns, and also to beat related sonic events in the music. This is consistent with the view that the construction of meter should be understood in relation to body motion and the idea of a common slow pulse, suggesting a referent level above the beats that we divide using our bodies (Kvifte, 2007). This is also in line with the view that music perception comprises a fusion of auditory and motor sensations (Godøy, 2006, 2011), and also Blom's motor theory of rhythm, which implies that rhythm belongs to the field of tacit and embodied knowledge based on motor experiences (Blom, 2006). Telespringar is dance music, and the complexity of its rhythms may be a result of the mutual interaction of the music and the dance. This result can also be understood as a testament to the existence of an embodied meter in music. Although this paper deals with rhythm structures in Norwegian telespringar, its conclusions may also be relevant to a more general discussion of the correspondence between music and motion in rhythm perception.
ACKNOWLEDGEMENTS
The author would like to thank the telespringar performers for having participated in the study; Minho Song and Diana Kayser for assistance during the motion capture recordings; and Anne Danielsen, Alexander Refsum Jensenius, Kathrine Frey Frøslie, and Rolf Inge Godøy for valuable feedback on this article.
NOTES
-
Correspondence can be addressed to: Mari Romarheim Haugen, Department of Musicology, University of Oslo. E-mail: m.r.haugen@imv.uio.no.
Return to Text -
In this paper, the word polymetric is used to descibe music where more than one metrical interpretation is possible—an aural equivalent of Wittgenstein's ambiguous duck/rabbit figure, where the same figure can be seen as either a rabbit or a duck, but not both at the same time. See also the discussion of the principle of exclusive allocation in Bregman (1990).
Return to Text -
In free dance studies.
Return to Text -
See http://www.qualisys.com.
Return to Text -
See http://www.apple.com/logic-pro.
Return to Text -
See http://www.reaper.fm.
Return to Text -
http://fourms.uio.no.
Return to Text -
In this paper, the category medium is used to describe beat duration ratios significantly different from the long and the short beat duration categories. Here, for example, the medium category is closer to the long than the short.
Return to Text -
The challenge of determining exact beat onsets in the pols/springar tunes of Norway and Sweden, based on the physical sound signal, has been discussed in Johansson (2010).
Return to Text
REFERENCES
- Ahlbäck, S. (2003). About asymmetrical beat in the polska. In M. Ramsten (Ed.), The Polish dance in Scandinavia and Poland (vol. 17, pp. 165–180). Stockholm: Svenskt visarkiv.
- Baily, J. (1985). Music structure and human movement. In P. Howell, Ian Cross, & Robert West (Eds.), Musical structure and cognition (pp. 237–258). London: Academic Press.
- Bakka, E. (1978). Norske dansetradisjonar (vol. 15). Oslo: Samlaget.
- Bakka, E., Aksdal, B., & Flem, E. (1995). Springar and pols: Variation, dialect and age: Pilot project on the methodology for determining traditions structures and historical layering of old Norwegian couple dances. Trondheim: Rådet for folkemusikk og folkedans, the Rff Centre.
- Bengtsson, I. (1974). On notation of time, signature and rhythm in Swedish polskas. In G. Hilleström (Ed.), Studia instrumentorum musicae popularis III (pp. 22–31). Stockholm: Nordiska Musikförlaget.
- Bengtsson, I. (1987). Notation, motion and perception: Some aspects of musical rhythm. In A. Gabrielsson (Ed.), Action and perception in rhythm and music (vol. 55, pp. 69–80). Stockholm: The Royal Swedish Academy of Music.
- Blom, J-P. (1981). The dancing fiddle: On the expression of rhythm in Hardingfele Slåtter. In J. P. Blom, S. Nyhus, & R. Sevåg (Eds.), Norsk Folkemusikk (vol. 7, pp. 305–312). Oslo: Universitetsforlaget.
- Blom, J-P. (1993). Rytme og frasering—forholdet til dansen. In B. A. Nyhus & S. Nyhus (Eds.), Fanitullen. Innføring i norsk og samisk folkemusikk (pp. 161–184). Oslo: Universitetsforlaget.
- Blom, J-P. (2006). Making the music dance: Dance connotations in Norwegian fiddling. In I. A. Russell, M.A. (Ed.), Play it like it is: Fiddle and dance studies from around the North Atlantic (vol. 5, pp. 75–86). Aberdeen: The Elphinstone Institute, University of Aberdeen.
- Bregman, A. S. (1990). Auditory scene analysis: The perceptual organization of sound. Cambridge, Mass.: MIT Press.
- Brochard, R., Abecasis, D., Potter, D., Ragot, R., & Drake, C. (2003). The "ticktock" of our internal clock: Direct brain evidence of subjective accents in isochronous sequences. Psychological Science, 14(4), 362–366. Retrieved from http://www.jstor.org/stable/40063809. https://doi.org/10.1111/1467-9280.24441
- Burger, B. & Toiviainen, P. (2013). MoCap Toolbox—A Matlab toolbox for computational analysis of movement data. Proceedings of the 10th Sound and Music Computing Conference (SMC), 172–178. Retrieved from http://smcnetwork.org/system/files/MOCAP%20TOOLBOX%20–%20A%20MATLAB%20TOOLBOX%20FOR%20COMPUTATIONAL%20ANALYSIS%20OF%20MOVEMENT%20DATA.pdf
- Carvalho, J. J. D. (1999). Afro-Brazilian music and ritual: Part 1: From traditional genres to the beginnings of samba. Série antropologia 256, Universidade de Brasilia. Lecture presented in the Graduate Seminar in Ethnomusicology at the University of Wisconsin–Madison.
- Clayton, M. (2012). What is entrainment? Definition and applications in musical research. Empirical Musicology Review, 7(1–2), 49–56.
- Clayton, M. (2013). Entrainment, ethnography and musical interaction. In M. Clayton, B. Dueck & L. Leante (Eds.), Experience and meaning in music performance (pp. 17–39). New York: Oxford University Press. https://doi.org/10.1093/acprof:oso/9780199811328.003.0002
- Danielsen, A. (2010). Microrhythm and rhythmic structure: Here, there and everywhere: Three accounts of pulse in D'Angelo's "Left and Right." In A. Danielsen (Ed.), Musical rhythm in the age of digital reproduction (vol. 2, pp. 19–36). Farnham: Ashgate.
- Danielsen, A., Haugen, M. R., & Jensenius, A. R. (2015). Moving to the beat: Studying entrainment to micro-rhythmic changes in pulse by motion capture. Timing and Time Perception, 3(1–2), 133–154. https://doi.org/10.1163/22134468-00002043
- Duxbury, C., Bello, J. P., Davies, M., & Sandler, M. (2003). Complex domain onset detection for musical signals. Paper presented at the Proc. Digital Audio Effects Workshop (DAFx).
- Gerischer, C. (2006). O suingue baiano: Rhythmic feeling and microrhythmic phenomena in Brazilian percussion. Ethnomusicology, 50(1), 99–119. Retrieved from http://www.jstor.org/stable/20174425
- Godøy, R. I. (2006). Gestural-sonorous objects: Embodied extensions of Schaeffer's conceptual apparatus. Organised sound, 11(2), 149–157. https://doi.org/10.1017/S1355771806001439
- Godøy, R. I. (2011). Sound-action awareness in music. In D. Clarke & E. Clarke (Eds.), Music and consciousness: philosophical, psychological, and cultural perspectives (pp. 231–243). Oxford: Oxford University Press. https://doi.org/10.1093/acprof:oso/9780199553792.003.0069
- Grau, A. (1983). Sing a dance, dance a song: The relationship between two types of formalised movements and music among the Tiwi of Melville and Bathurst Islands, North Australia. Dance Research 1(2), 32–44. Retrieved from http://www.jstor.org/stable/1290759. https://doi.org/10.2307/1290759
- Groven, E. (1971). Musikkstudiar—ikkje utgjevne før. 1. Rytmestudiar. In O. Fjalestad (Ed.), Eivind Groven. Heiderskrift til 70-årsdagen 8. oktober 1971 (pp. 93–102). Oslo: Noregs boklag.
- Haugen, M. R. (2015). Asymmetrical meter in Scandinavian folk music and dance: A case study of Norwegian telespringar. In A. L. J. Ginsborg, M. Phillips, & S. Bramley (Eds.), Proceedings of the ninth triennial conference of the European Society for the Cognitive Sciences of Music (ESCOM) (pp. 432–436). Manchester, UK: Royal Northern College of Music.
- Honing, H. (2012). Without it no music: Beat induction as a fundamental musical trait. Annals of the New York Academy of Sciences, 1252(1), 85–91. https://doi.org/10.1111/j.1749-6632.2011.06402.x
- Honing, H. (2013). Structure and interpretation of rhythm in music. In D. Deutsch (Ed.), Psychology of music (pp. 369–404). San Diego, Calif.: Academic Press. https://doi.org/10.1016/B978-0-12-381460-9.00009-2
- Jensenius, A. R. (2007). Action - sound: developing methods and tools to study music-related body movement. Ph.D. dissertation, University of Oslo.
- Johansson, M. (2009). Rhythm into style: Studying asymmetrical grooves in Norwegian folk music. Ph.D. dissertation, University of Oslo.
- Johansson, M. (2010). The concept of rhythmic tolerance: Examining flexible grooves in Scandinavian folk fiddling. In A. Danielsen (Ed.), Musical rhythm in the age of digital reproduction (pp. 69–83). Farnham: Ashgate.
- Kubik, G. (1990). Drum patterns in the "Batuque" of Benedito Caxias. Latin American music review / Revista de Música Latinoamericana, 11(2), 115–181. Retrieved from http://www.jstor.org/stable/780123. https://doi.org/10.2307/780123
- Kvifte, T. (1983). Om flertydighet i opplevelse av metrum. Studia musicologica Norvegica (trykt utg.) 9, 27–42.
- Kvifte, T. (1999). Fenomenet "asymmetrisk takt" i norsk og svensk folkemusikk. Studia Musicologica Norvegica, 25, pp. 387–430.
- Kvifte, T. (2004). Description of grooves and syntax/process dialectics. Studia Musicologica Norvegica, 30, 54–77. https://doi.org/10.18261/issn.1504-2960
- Kvifte, T. (2007). Categories and timing: On the perception of meter. Ethnomusicology, 51(1), 64–84. Retrieved from http://www.jstor.org/stable/20174502
- Lartillot, O., & Toiviainen, P. (2007). A Matlab toolbox for musical feature extraction from audio. In Proceedings of the 10th international conference on digital audio effects (DAFx-07). Bordeaux, France.
- Lee, C. S. (1991). The perception of metrical structure: Experimental evidence and a model. In P. Howell, I. Cross & R. West (Eds.), Representing musical structure (pp. 59–127). London: Academic Press.
- Leman, M., & Godøy, R. I. (2010). Why study musical gestures? In R. I. Godøy & M. Leman (Eds.) Musical gestures: Sound, movement, and meaning, (pp. 3–11). New York & London: Routhledge.
- Lerdahl, F., & Jackendoff, R. (1983). A generative theory of tonal music. Cambridge, Mass.: MIT Press.
- London, J. (2012). Hearing in time: Psychological aspects of musical meter. Oxford: Oxford University Press. https://doi.org/10.1093/acprof:oso/9780199744374.001.0001
- Manning, F., & Schutz, M. (2013). "Moving to the beat" improves timing perception. Psychonomic Bulletin and Review, 20(6), 1133–1139. https://doi.org/10.3758/s13423-013-0439-7
- Mårds, T. (1999). Svikt, kraft og tramp: en studie av bevegelse og kraft i folkelig dans. Master's thesis, Norges Idrettshøgskole, Oslo.
- Mariani, M. E. (1998). African influences in Brazilian dance. In K. W. Asante (Ed.), African dance (pp. 79–97). Eritrea: Africa World Press.
- Merchant, H., Grahn, J., Trainor, L., Rohrmeier, M., & Fitch, W. T. (2015). Finding the beat: A neural perspective across humans and non-human primates. Philosophical Transactions of the Royal Society of London B: Biological Sciences, 370 (1664). https://doi.org/10.1098/rstb.2014.0093
- Naveda, L. & Leman, M. (2009). A Cross-modal Heuristic for Periodic Pattern Analysis of Samba Music and Dance. Journal of New Music Research, 38(3), 255–283. https://doi.org/10.1080/09298210903105432
- Nozaradan, S., Peretz, I., Missal, M., & Mouraux, A. (2011). Tagging the neuronal entrainment to beat and meter. Journal of Neuroscience, 31(28), 10234–10240. https://doi.org/10.1523/JNEUROSCI.0411-11.2011
- Omholt, P. Å. (2009). Regional og typologisk variasjon i norsk slåttemusikk: en kvantitativ tilnærming med et historisk perspektiv. Ph.D. dissertation, University of Bergen.
- Parncutt, R. (1994). A perceptual model of pulse salience and metrical accent in musical rhythms. Music Perception, 11(4), 409–464. https://doi.org/10.2307/40285633
- Polak, R. (2010). Rhythmic feel as meter: Non-isochronous beat subdivision on Jembe music from Mali. Music Theory Online, 16(4). http://www.mtosmt.org/issues/mto.10.16.4/mto.10.16.4.polak.html
- Repp, B. H., & Su, Y.-H. (2013). Sensorimotor synchronization: A review of recent research (2006–2012). Psychonomic Bulletin and Review, 20(3), 403–452. https://doi.org/10.3758/s13423-012-0371-2
- Sethares, W. A. (2007). Rhythm and transforms. London: Springer. https://doi.org/10.1007/978-1-84628-640-7
- Shove, P., & Repp, B. H. (1995). Musical motion and performance: Theoretical and empirical perspectives. In J. Rink (Ed.), The practice of performance: Studies in musical interpretation (pp. 55–83). Cambridge: Cambridge University Press. https://doi.org/10.1017/CBO9780511552366.004
- Su, Y.-H., & Pöppel, E. (2012). Body movements enhance the extraction of temporal structures in auditory sequences. Psychological Research, 76(3), 373–382. https://doi.org/10.1007/s00426-011-0346-3
- Toiviainen, P., Luck, G., & Thompson, M. R. (2010). Embodied meter: Hierarchical Eigenmodes in music-induced movement. Music Perception 28(1), 59–70. https://doi.org/10.1525/mp.2010.28.1.59
- Van Dyck, E., Moelants, D., Demey, M., Deweppe, A., Coussement, P., & Leman, M. (2013). The impact of the bass drum on human dance movement. Music Perception 30(4), 349–359. https://doi.org/10.1525/mp.2013.30.4.349
- Wright, M. J. (2008). The shape of an instant: Measuring and modeling perceptual attack time with probability density functions. Ph.D. dissertation, Stanford University.
APPENDIX A
Placement of the markers attached to the fiddle, the fiddler's body, and the dancers' bodies. Twenty-six markers were attached to the fiddler/fiddle and thirty markers were attached to the dancers' bodies (L = left, R = right, F = front, B = back, CTR = control).
| Markers | Fiddler/fiddle | Dancers | Markers | Fiddler/fiddle | Dancers |
| 1 | RF head | RF head | 16 | R toe | LB hip |
| 2 | RB head | RB head | 17 | L knee | R knee |
| 3 | LF head | LF head | 18 | L heel | R ankle |
| 4 | LB head | LB head | 19 | L toe | R heel |
| 5 | R shoulder | R shoulder | 20 | CTR back | R toe |
| 6 | R elbow | R elbow | 21 | Bow tip | L knee |
| 7 | R wrist | R wrist | 22 | Bow frog | L ankle |
| 8 | L shoulder | L shoulder | 23 | F tail piece | L heel |
| 9 | L elbow | L elbow | 24 | Fiddle head | L toe |
| 10 | L wrist | L wrist | 25 | Fiddle R corner | CTR back |
| 11 | Neck | Neck | 26 | Fiddle L corner | CTR front |
| 12 | RB hip | Manubrium of sternum | 27 | - | CTR R upper arm |
| 13 | LB hip | RF hip | 28 | - | CTR R lower arm |
| 14 | R knee | RB hip | 29 | - | CTR L upper arm |
| 15 | R heel | LF hip | 30 | - | CTR L lower arm |
